Financial Performance Analysis of BHP Billiton Ltd and CSR Ltd: Report
VerifiedAdded on 2023/06/07
|22
|5456
|193
Report
AI Summary
This report provides a comprehensive comparative analysis of the financial performance of BHP Billiton Ltd and CSR Ltd over a three-year period. The analysis focuses on the companies' cash flow statements, statement of changes in equity, and related financial metrics, including deferred tax assets and liabilities, cash tax, and effective tax rates. The study examines the changes in equity items, providing insights into the reasons behind these changes. The report offers a comparative analysis of the debt and equity positions of both companies, highlighting key differences and trends. The cash flow statements are scrutinized to identify trends in operating, investing, and financing activities. Additionally, the report compares items reported in the comparative income statements, as well as items not reported, providing explanations for their exclusion. The analysis also considers the effective tax rates, cash tax rates, and the relationship between cash tax and book tax rates. The report concludes with a comparison of the overall financial health and performance of the two companies, based on the analysis of their financial statements and related data.

Assignment 2
Paraphrase This Document
Need a fresh take? Get an instant paraphrase of this document with our AI Paraphraser
Executive Summary
In this report, the financial performance of the two companies, BHP Billiton Ltd and CSR
Ltd has been compared for the last three years. Their cash flow statement has been compared
and commented from edge to edge, which will give a clear picture and understanding of
financial health of both the companies. Further, deferred tax asset and deferred tax liability
has also been considered, which arises generally due to the timing difference. The cash tax
and cash tax rate calculation has been done for both the companies.
Table of Contents
Executive Summary...................................................................................................................2
Statement of change in equity....................................................................................................4
BHP Billiton...........................................................................................................................4
CSR Ltd..................................................................................................................................4
Cash flow statement...................................................................................................................5
BHP Billiton Ltd.....................................................................................................................5
Cash flow statement of CSR Ltd............................................................................................8
Comparative analysis of cash flow statement of BHP Billiton Ltd...........................................9
Comparative Analysis of Cash Flow Statement of CSR Ltd.....................................................9
Comparison between cash flow statements of both companies...............................................10
Items reported in comparative income of BHP Billiton Ltd and CSR Ltd..............................10
Items not reported in Comparative Income Statement.............................................................11
Reason for not reporting these items........................................................................................11
Should comprehensive income be included?...........................................................................11
Income tax expenses shown in balance sheet..........................................................................12
Effective tax rates of both companies......................................................................................12
Deferred tax liability................................................................................................................12
Increase or decrease in the deferred tax assets or in the deferred tax liability.........................13
Cash tax amount for both companies.......................................................................................15
Cash tax rates for both companies...........................................................................................16
Cash tax rate vs. the book tax rate............................................................................................16
References................................................................................................................................17
Appendix..................................................................................................................................18
⊘ This is a preview!⊘
Do you want full access?
Subscribe today to unlock all pages.
Trusted by 1+ million students worldwide
Statement of change in equity
BHP Billiton
From the table 1, it can be seen thatthere is no change in the shares capital of BHP Billiton
Ltd and BHP Billiton Plc. that means no shares have been issued to them(BHP, 2018).Total
Comprehensive income is showing negative balance, which means that income is not fruitful
for the company any more(Demirgüç-Kunt & Maksimovic, 2002).There is a slight decrease
in the value of Reserves due to the employees shares awarded forfeited and net employee
contributions. The retained earnings are reflecting positive balance as entire change was in
positive (Chandra, 2008).Non- controlling interest is reflecting a slight change, when
compared with the previous year’s figure.
CSR Ltd
From the table 2, it can be seen Issued capital and Reserves for CSR Ltd is almost similar for
both the years.In Reserves, at the end of the year, negative balance is reflecting, which means
that there is payment for the uncertainty which the company has not accounted in
provision(CSR Limited, 2018).Retained Profit has increased in the year 2017, which means
that company has retained their profit for their development and smooth functioning for
longer run. Non-controlling interest has increased more than double which indicates that the
company’s ownership is getting diluted by third parties and hence, liability to pay dividend
also increases in future(Ohlson, 2009).
Paraphrase This Document
Need a fresh take? Get an instant paraphrase of this document with our AI Paraphraser
Cash flow statement
BHP BillitonLtd
From the table 3, it can be inferred that there are has been a good increase of sales and
income in the year 2017 when compared with 2016 and 2015. In 2016, the company has
experienced uncertainty losses. Non- operating exceptional items has reduced more than ten
times when compared with the last year’s figure. Depreciation and amortization expense has
slightly reduced when compared with the last two years, which means the company has
disposed their assets. Impairment of property, plant and equipment, financial assets and
intangibles has reduced more than fifty percent in 2016 when compared with 2015. However,
in 2017 these values have slightly decreased. The company has disposed few assets in 2016
and 2017 due to which, impairment of assets also got reduced. Net finance cost has increased
by almost fifty percent when compared with 2016, which means liability increases in the
current year. In 2016, the value of net finance cost was just half when compared with 2015.
The company has increased their loans and hence, their cost also increases(Henderson et al.,
2015).
Shares of operating profit of equity accounted income were following a decreasing trend
from 2015, as the performance level reduced from the previous years. Trade and receivables
have fallen down drastically in the year 2017 compared with 2015 and 2016. It may be
because of reduction in sales or the company has received the amount before the completion
of the financial year. Inventories were reflecting negative balance which means the company
is facing inventory issues in the year 2017. Trade and payables both have a positive balance
when compared with 2016 and 2015. Hence, the company is either unable to pay their vendor
on the due date, whichleads to increase in creditors list or they are making purchases at the
end of the financial year which enhances the creditors list.Provisions and other assets and
liabilities have shown a slight decrease in 2017(BHP, 2018). Dividend received has just
increased to double when compared with the last year’s figure, which means the company has
invested their fund in shares and equity accounted investments.
Interest received and interest paid are following an increasing pattern, which means the
company has given a loan to the third party and repayment of interest-bearing liabilities also
increased (Mlachila & Chirwa, 2002). Settlement of cash management related instruments is
showing a negative balance that means the company is facing adverse consequences while
settling the cash related instruments. Purchase of property, plant and equipment has increased
almost half times in 2016 when compared with 2015 that means the company has purchased
assets in 2016. However, in 2017 there is slight decrease in the purchase of property.
Exploration expenditure has increased from 2016, which means the expenses have increased.
However, it has reduced in 2016 as compared to 2015 which means the company has not
increased exploration.The exploration expenditure form an important part of the cash flow
statements (Ronald, 2010).
Proceeds from sale of assets has increased more than five times which means the company
has sold their assets in huge quantity in 2017 when compared with 2016.
Proceeds from divestment of subsidiaries, operations and joint operations have decreased in
2016 when compared with 2015. In 2017, it is slightly increased which means the company is
increasing the list of subsidiaries. Proceeds from interest-bearing liabilities have decreased
drastically when compared to 2016. In 2016,it became half as compared to 2015, which
means the company is not taking any further loans on interest. Proceeds from debt related
instruments increased in 2016 as compared to 2015 but, it again decreased in 2017 which
clearly states that the company is not dependent on debt much(United States. Bureau of
Internal Revenue, 2011). Repayment of interest-bearing liabilities has increased drastically in
2017which means that the company paid all loans in 2017. Purchases of ESOP trust has
slightly increased from 2016. However, it got reduced by fifty percent from 2015 that means
⊘ This is a preview!⊘
Do you want full access?
Subscribe today to unlock all pages.
Trusted by 1+ million students worldwide
the company has spent their funds in ESOP in the year 2015. Proceeds from ordinary shares
are only reflected in 2015, which means that the company has stopped investing in ordinary
shares. Dividend paid has decreased in 2016 as compared to 2015. Dividend paid to non -
controlling interest has decreased drastically in 2016 when compared with 2015. However, it
again rises up in 2017. This means that in 2016, the company has low controlling interest and
hence, fewer dividends are paid. Net financing cash flow from discontinued operations
reflects only in 2015 that mean the company has stopped few operations and hence, their cash
flow also stopped(Investopedia, 2018).
Cash flow statement of CSR Ltd
From the table 4, it can be inferred that receipts of the customer is following an increasing
trend since 2015 which indicates that the company is able to clear its debts on due date.
Payment to supplier and employees has increased from year to year which states that
expenses is increasing proportionately to the increase in income. Dividend and distribution
received enhances, which indicates that the company is diverting its fund into operations,
which lead to the generation of the dividend since 2015. Interest received and purchase of
controlled entities, and businesses, net of cash acquired are following decreasing trend since
2015, which means that the company is not advancing to any other third party. Income tax
paid enhances has increased more than twenty times since 2015 which indicates that income
of the company increases, which leads to increase in the tax also. Purchase of property, plant,
and equipment and other assets have reduced which indicates that the company has not
undertaken any new assets (Robbins & Bush, 2015). Proceeds from the sale of property,
plant, and equipment, and other assetsis showing decreasingtrend since 2015 which means
that few assets have attained their life, due to which they have to dispose of. The cost
associated with the acquisition of businesses has reduced to almost ten times compared to last
Paraphrase This Document
Need a fresh take? Get an instant paraphrase of this document with our AI Paraphraser
year. The main reason for this could possibly be that the business cost has decreased or less
development of business leaders has led to reduced cost(Snow, 2011). Loans and advances
have increased more than five times which indicates that the company has funded to some
other company in the form of loans and advances. Net (repayment) drawdown of borrowings
is showing positive balance when compared to the last year which states that the company
has not repaid any of its loans. The company has repaid its borrowing in 2015. Dividend paid
increased slightly that indicates that the company has not issued more shares. However,
dividend paid has increased almost double since 2015. Acquisition of share by CSR
employee trust has reduced which indicates that employees have sold their share or, the
acquisition by the employees is less(Visser et al., 2015). Interest and other financial cost paid
are almost similar to last year. However, it became half since 2015 which indicates that the
company has reduced their debt and hence, their finance cost also reduces.
Comparative analysis of cash flow statement of BHP Billiton Ltd
Net cash flow from operating activities shows an increase in 2017 when compared to 2016.
However, 2015 has more cash flow when compared to both the years which means that
expenses have increased. Net cash flow from investing activities has a negative balance since
2015. However, in 2017 the value has reduced which means that the company is not investing
in any other assets or any other company’s operations or joint operations. Net cash flow from
financing activities is negative only in 2017 which clearly states that the company has paid
off their loans along with interest. However, the net cash after combining from all the three
activities in 2017 has more cash balance as compared to 2016 and 2015, which means that
though the company is paying off their debt and interest, they also have good operating
income simultaneously(Jury, 2012).
Comparative Analysis of Cash Flow Statement of CSR Ltd
Net cash flow from operating activities is following an increasing trend since 2015, which
clearly states that the company is performing positively and able to maintain healthy cash
flow. Net cash used in investing activities have increased to almost double in 2016 since 2015
but, it again reduced in 2017which indicates that the company has invested their fund in 2016
excessively.Net cash used in financing activities, reflecting negative balance since 2015, has
become almost double in 2017 which means that company is operating under debt from the
third party and hence,is ending up with paying interest and dividend to the third party
(Wahlen et al., 2010).
Comparison between cash flow statements of both companies
In both the companies cash flows from operating activities have increased in 2017 when
compared to the last year. Further, the common factor in both the companies is that, they has
not invested their fund in the acquisition of any new asset, ownership in controlled entities,
loans and advances in 2017. The cash flow is negative in finance activities for both the
companies in 2017, which shows that they are paying either loans or interests. However,
BHP Billiton Ltd is performing effectively well when compared with CSR Ltd.
Items reported in comparative income of BHP Billiton Ltd and CSR Ltd
1) The items reported in comparative income of both companies are as follows:
- Gain or loss arises from the sale of investments
- Gain or loss from cash flow hedges
- Exchange fluctuations of translation of foreign operations
2) Tax recognized within other comprehensive income
3) Items which are not under income statement:
⊘ This is a preview!⊘
Do you want full access?
Subscribe today to unlock all pages.
Trusted by 1+ million students worldwide
- Re-measurement gains or losses on pension and medical science
- Tax recognized within other comprehensive income(Plewa Jr. & Friedlob, 2009)
Items not reported in Comparative Income Statement
In Comparative income statement, the profit or loss arising from the discontinued operations
of the company are taken into account such as cash flow hedges, sales of investment which
have led to the equity or transferred to the income statement, foreign exchange fluctuations,
gain or loss from pension and medical schemes, income tax related to such operations etc.
(Reeve et al., 2011).
Reason for not reporting these items
If the items which are listed under comparative income statement are taken under the profit
and loss account, then it will lead to inappropriate accounting as these items relate to the
discontinued operations and hence, it will not give the true and fair value of the company.
The shareholder wealth will get affected due to the presence of these items in the profit and
loss account (Nikolai et al., 2009).
Should comprehensive income be included?
Yes, other comparative income statement should be taken into consideration while evaluating
the performance of the manager of the company. The item of the other comparative income
statement speaks about discontinued operations which were parts of the running business but
due to inefficient management, the operations needed to be disrupted. A manager should be
able to understand the business complexity and must deal. (Clarke, 2012).
Paraphrase This Document
Need a fresh take? Get an instant paraphrase of this document with our AI Paraphraser
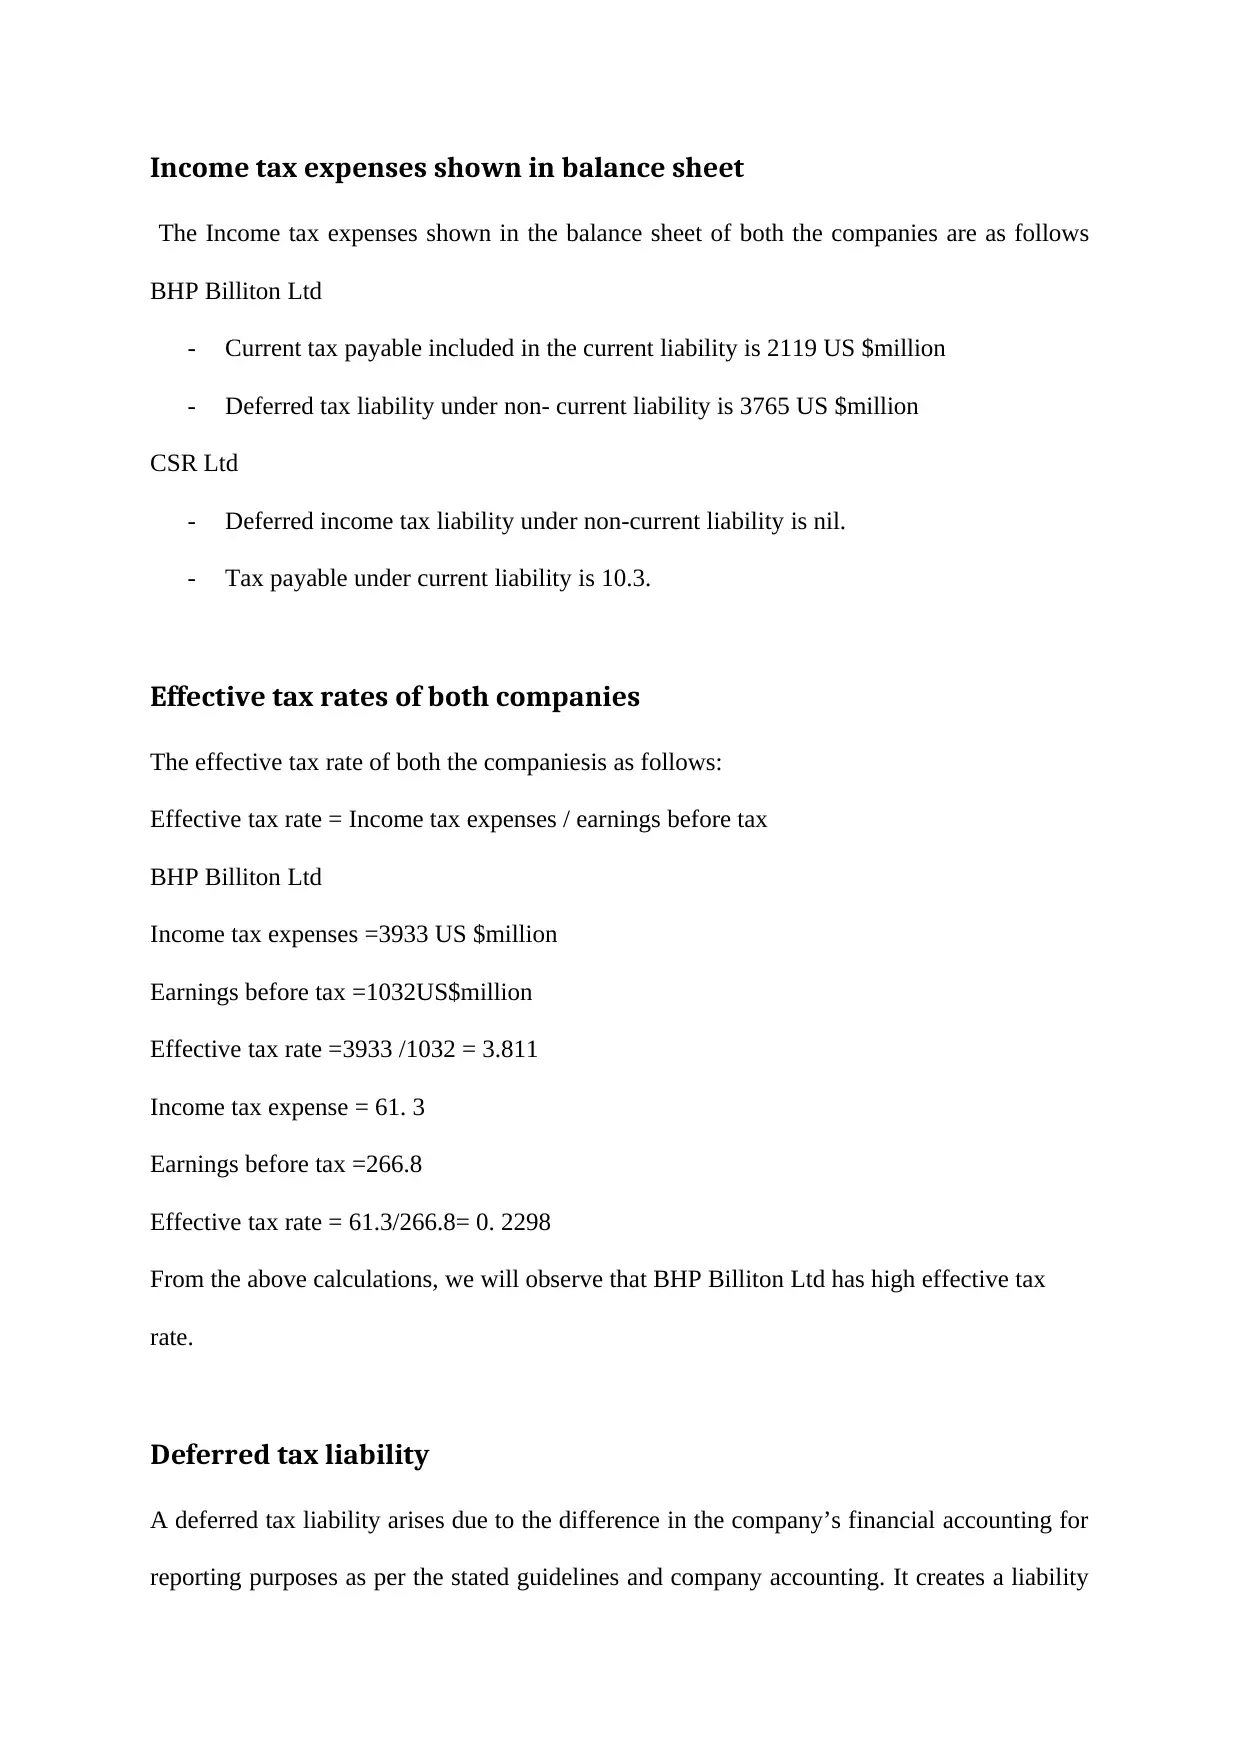
Income tax expenses shown in balance sheet
The Income tax expenses shown in the balance sheet of both the companies are as follows
BHP Billiton Ltd
- Current tax payable included in the current liability is 2119 US $million
- Deferred tax liability under non- current liability is 3765 US $million
CSR Ltd
- Deferred income tax liability under non-current liability is nil.
- Tax payable under current liability is 10.3.
Effective tax rates of both companies
The effective tax rate of both the companiesis as follows:
Effective tax rate = Income tax expenses / earnings before tax
BHP Billiton Ltd
Income tax expenses =3933 US $million
Earnings before tax =1032US$million
Effective tax rate =3933 /1032 = 3.811
Income tax expense = 61. 3
Earnings before tax =266.8
Effective tax rate = 61.3/266.8= 0. 2298
From the above calculations, we will observe that BHP Billiton Ltd has high effective tax
rate.
Deferred tax liability
A deferred tax liability arises due to the difference in the company’s financial accounting for
reporting purposes as per the stated guidelines and company accounting. It creates a liability
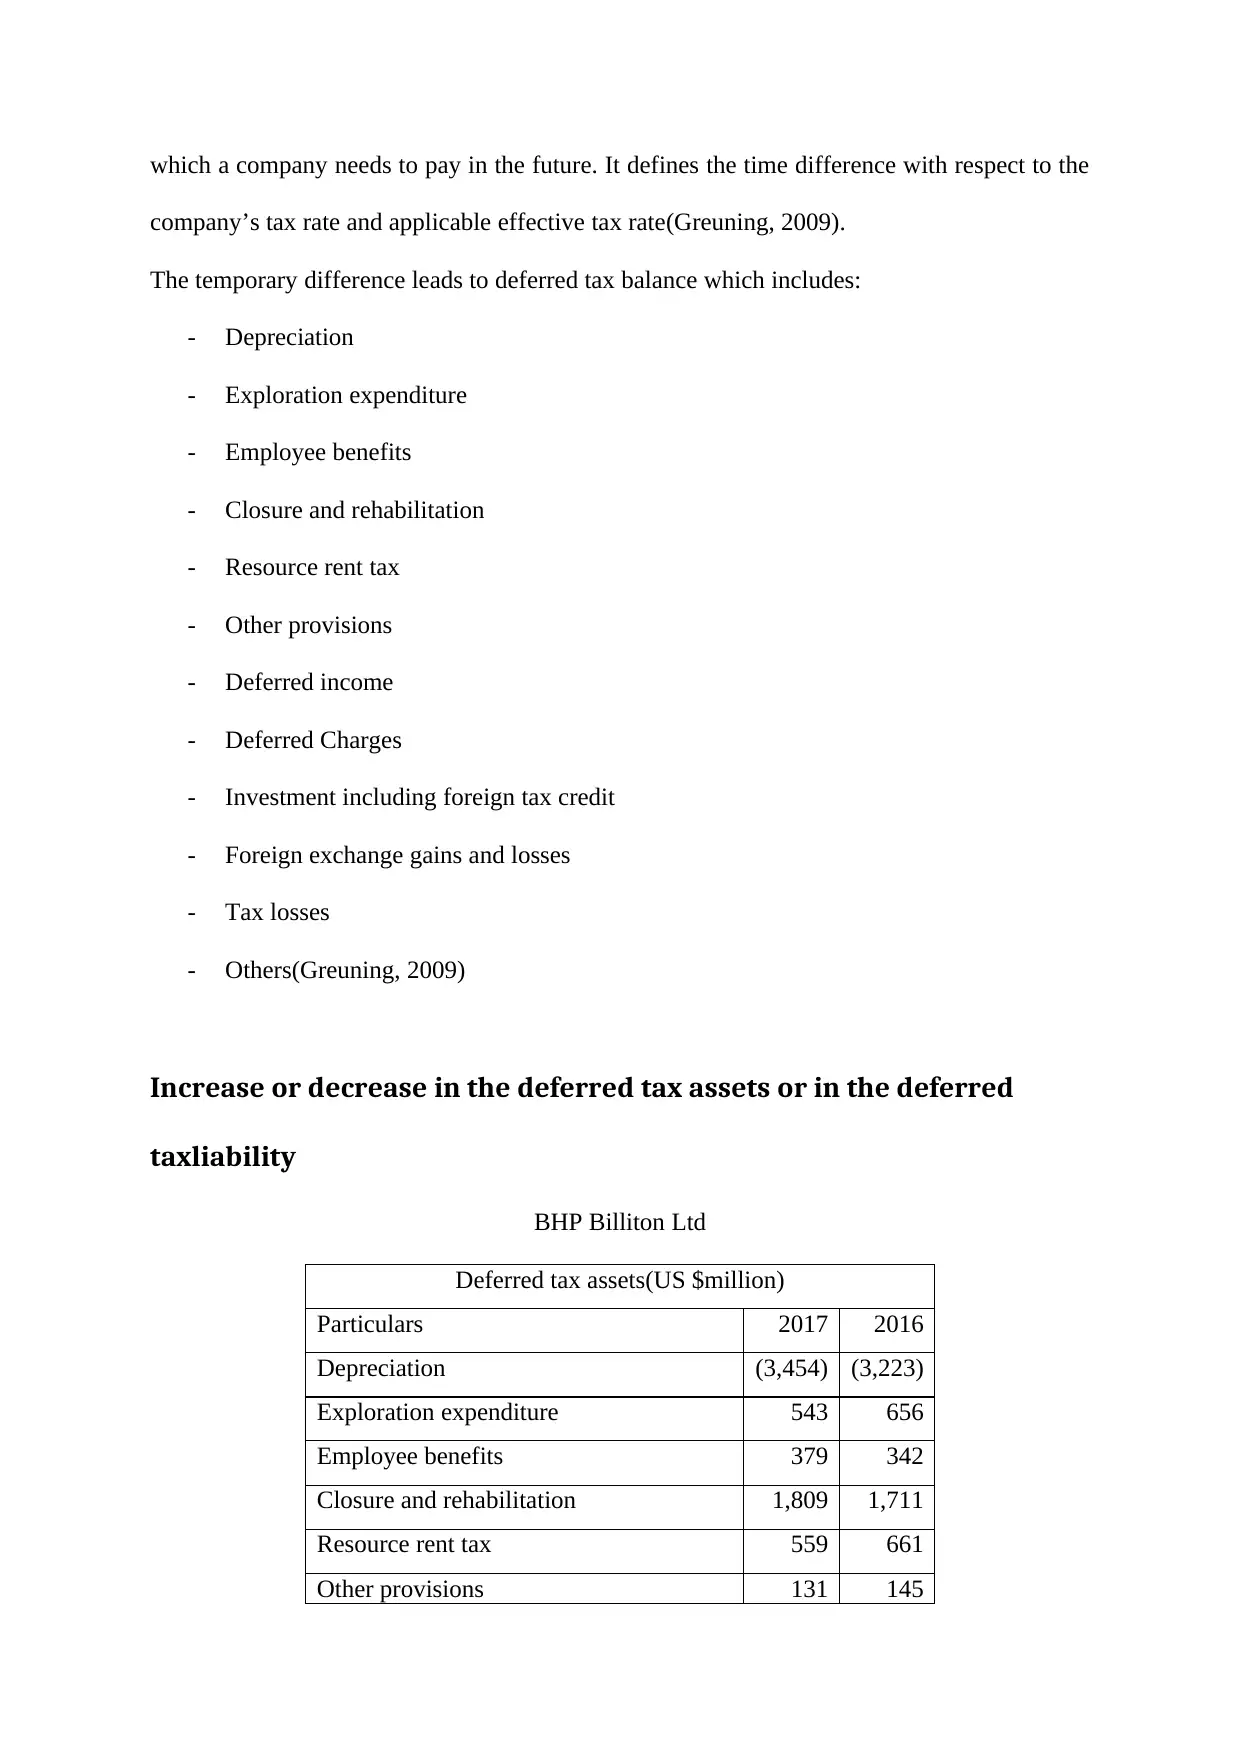
which a company needs to pay in the future. It defines the time difference with respect to the
company’s tax rate and applicable effective tax rate(Greuning, 2009).
The temporary difference leads to deferred tax balance which includes:
- Depreciation
- Exploration expenditure
- Employee benefits
- Closure and rehabilitation
- Resource rent tax
- Other provisions
- Deferred income
- Deferred Charges
- Investment including foreign tax credit
- Foreign exchange gains and losses
- Tax losses
- Others(Greuning, 2009)
Increase or decrease in the deferred tax assets or in the deferred
taxliability
BHP Billiton Ltd
Deferred tax assets(US $million)
Particulars 2017 2016
Depreciation (3,454) (3,223)
Exploration expenditure 543 656
Employee benefits 379 342
Closure and rehabilitation 1,809 1,711
Resource rent tax 559 661
Other provisions 131 145
⊘ This is a preview!⊘
Do you want full access?
Subscribe today to unlock all pages.
Trusted by 1+ million students worldwide
1 out of 22
Related Documents


Your All-in-One AI-Powered Toolkit for Academic Success.
+13062052269
info@desklib.com
Available 24*7 on WhatsApp / Email
![[object Object]](/_next/static/media/star-bottom.7253800d.svg)
Unlock your academic potential
Copyright © 2020–2026 A2Z Services. All Rights Reserved. Developed and managed by ZUCOL.