FINC20018 Managerial Finance: BHP Billiton Performance Report
VerifiedAdded on 2022/11/14
|16
|2920
|107
Report
AI Summary
This report provides a comprehensive analysis of BHP Billiton's financial performance, risk profile, and payout policies. The introduction provides an overview of BHP Billiton, its operations, and its competitors. The risk profile section discusses systematic and unsystematic risks faced by the company. The report then analyzes the company's overall financial performance using ratio analysis, including dividend yield, EV/EBITDA, net profit margin, and other key metrics from 2014 to 2018. The time value of money concept is applied to estimate the company's intrinsic value. The sources of finance and payout policies are identified and interpreted. The report concludes with a summary of the key findings and analysis.

Managerial Finance
1
1
Paraphrase This Document
Need a fresh take? Get an instant paraphrase of this document with our AI Paraphraser
Executive Summary
This report is based on business finance in which a real company is taken for critical analysis. In
this report, BHP Billiton is taken for further analysis and investigation of their financial
performance. It also identifies and analyse the systematic and unsystematic risks that the BHP
Billiton faces in their business operations. Finally, this report also identifies the link between the
BHP Billiton financial situation and the concept of the time value of money. Sources of finance
and payout policy are also identified and interpreted in this report.
2
Table of Contents
Executive Summary.........................................................................................................................2
1. Introduction..................................................................................................................................4
2. Risk Profile..................................................................................................................................5
3. Overall financial performance.....................................................................................................6
4. Time value of money...................................................................................................................9
5. Identification of the company’s sources of finance...................................................................11
6. The pay-out policy of the company...........................................................................................11
Conclusion.....................................................................................................................................12
References......................................................................................................................................13
3
⊘ This is a preview!⊘
Do you want full access?
Subscribe today to unlock all pages.
Trusted by 1+ million students worldwide
1. Introduction
BHP Billiton is the largest international and diversified natural resources company, established
in 2001 by way of a merger between BHP Ltd. and Billiton PLC. The company headquarters are
in Melbourne, Australia and also listed on ASX. The chairman of the company is KEN
MACKENZIE and CEO is ANDRE MACKENZIE. The company has the operation of
producing commodities along with substantial interest in energy coal, gas, and oil. The main
important business operation of BHP Billiton is the exploration and production of mineral and
refining, and production of petroleum. BHP’s business operations mainly involve petroleum,
copper, potash, coal, iron ore and nickel.
The structure of the company is Dual Listed having two parent companies (BHP Group PLC and
BHP Group LTD.). The company sold its products over worldwide and has mining operations in
North America, South America, and Australia whereas petroleum operations in the U.S., Tobago,
Algeria, and the U.K.
The main competitors of the company are listed below:
Rio Tinto
Warrior
Hydro
Vale
Alcoa
Shell
The company main goal and objective is to build long-term shareholder value through the
discovery, development, innovation, marketing, and acquisition of natural resources. BHP
Billiton has an unmatched high-quality growth opportunities portfolio that will ensure the
company regularly meets the changing needs of customers and also fulfill the demand of
resources of emerging economies at every stage of their growth.
The company has also proven a record of offering superior returns to shareholders. This is done
through the execution of the disciplined unchanged strategy of maintaining and operating large,
4
Paraphrase This Document
Need a fresh take? Get an instant paraphrase of this document with our AI Paraphraser

low-cost, expandable, long-life, upstream assets diversified by market, commodity, and
geography
5
geography
5
2. Risk Profile
According to the CAPM framework, risk can be divided into two parts, being:
Non-systematic or diversifiable risk, and
Systematic or non- diversifiable risk
Systematic Risk faced by BHP
Based on BHP analysis report which shows that the company offers a wide variety of products
and it cannot be protected from price change which is influenced by the competitive market
where there are government and tough competitors who play the main role. In other words,
product price fluctuations may incur due to changes in the price of industry reflecting potential
geopolitical and global economic factors which cannot be controlled by the company (Brown,
2019).
6
⊘ This is a preview!⊘
Do you want full access?
Subscribe today to unlock all pages.
Trusted by 1+ million students worldwide
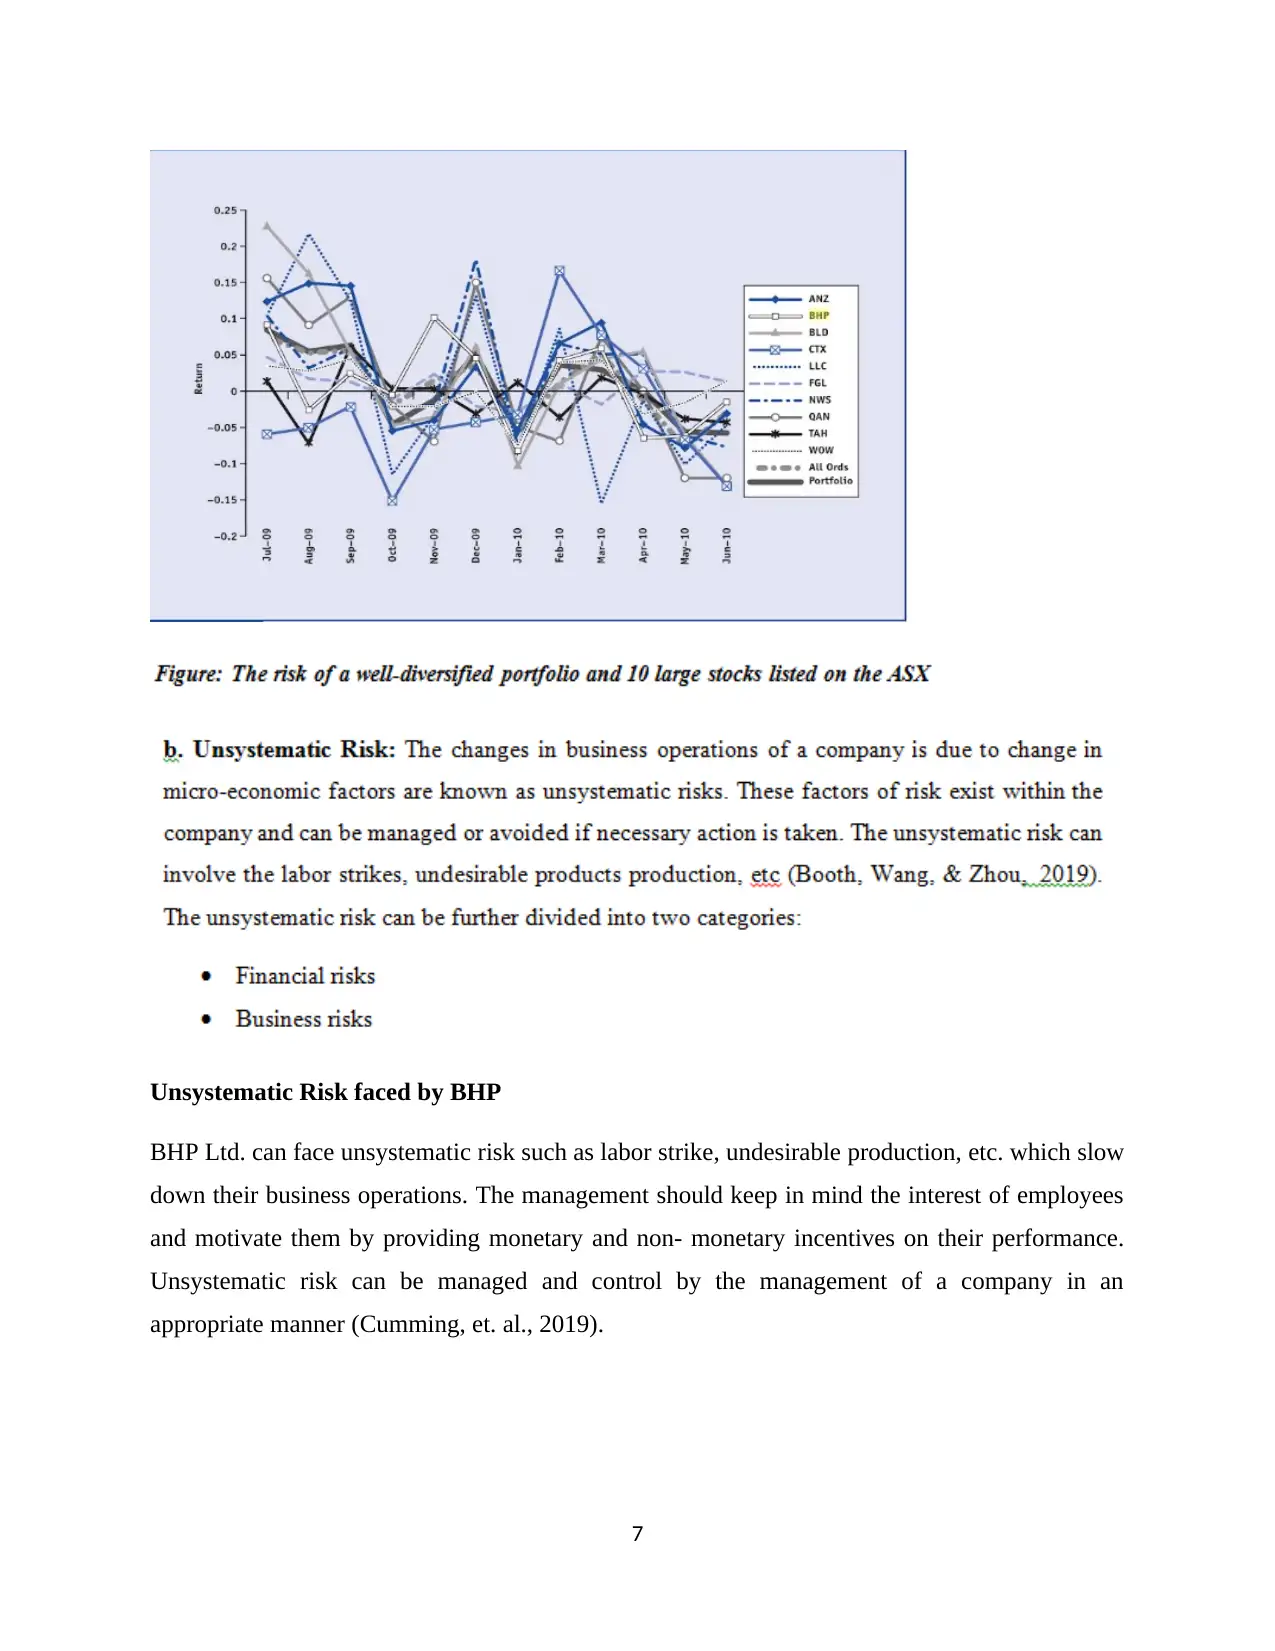
Unsystematic Risk faced by BHP
BHP Ltd. can face unsystematic risk such as labor strike, undesirable production, etc. which slow
down their business operations. The management should keep in mind the interest of employees
and motivate them by providing monetary and non- monetary incentives on their performance.
Unsystematic risk can be managed and control by the management of a company in an
appropriate manner (Cumming, et. al., 2019).
7
Paraphrase This Document
Need a fresh take? Get an instant paraphrase of this document with our AI Paraphraser
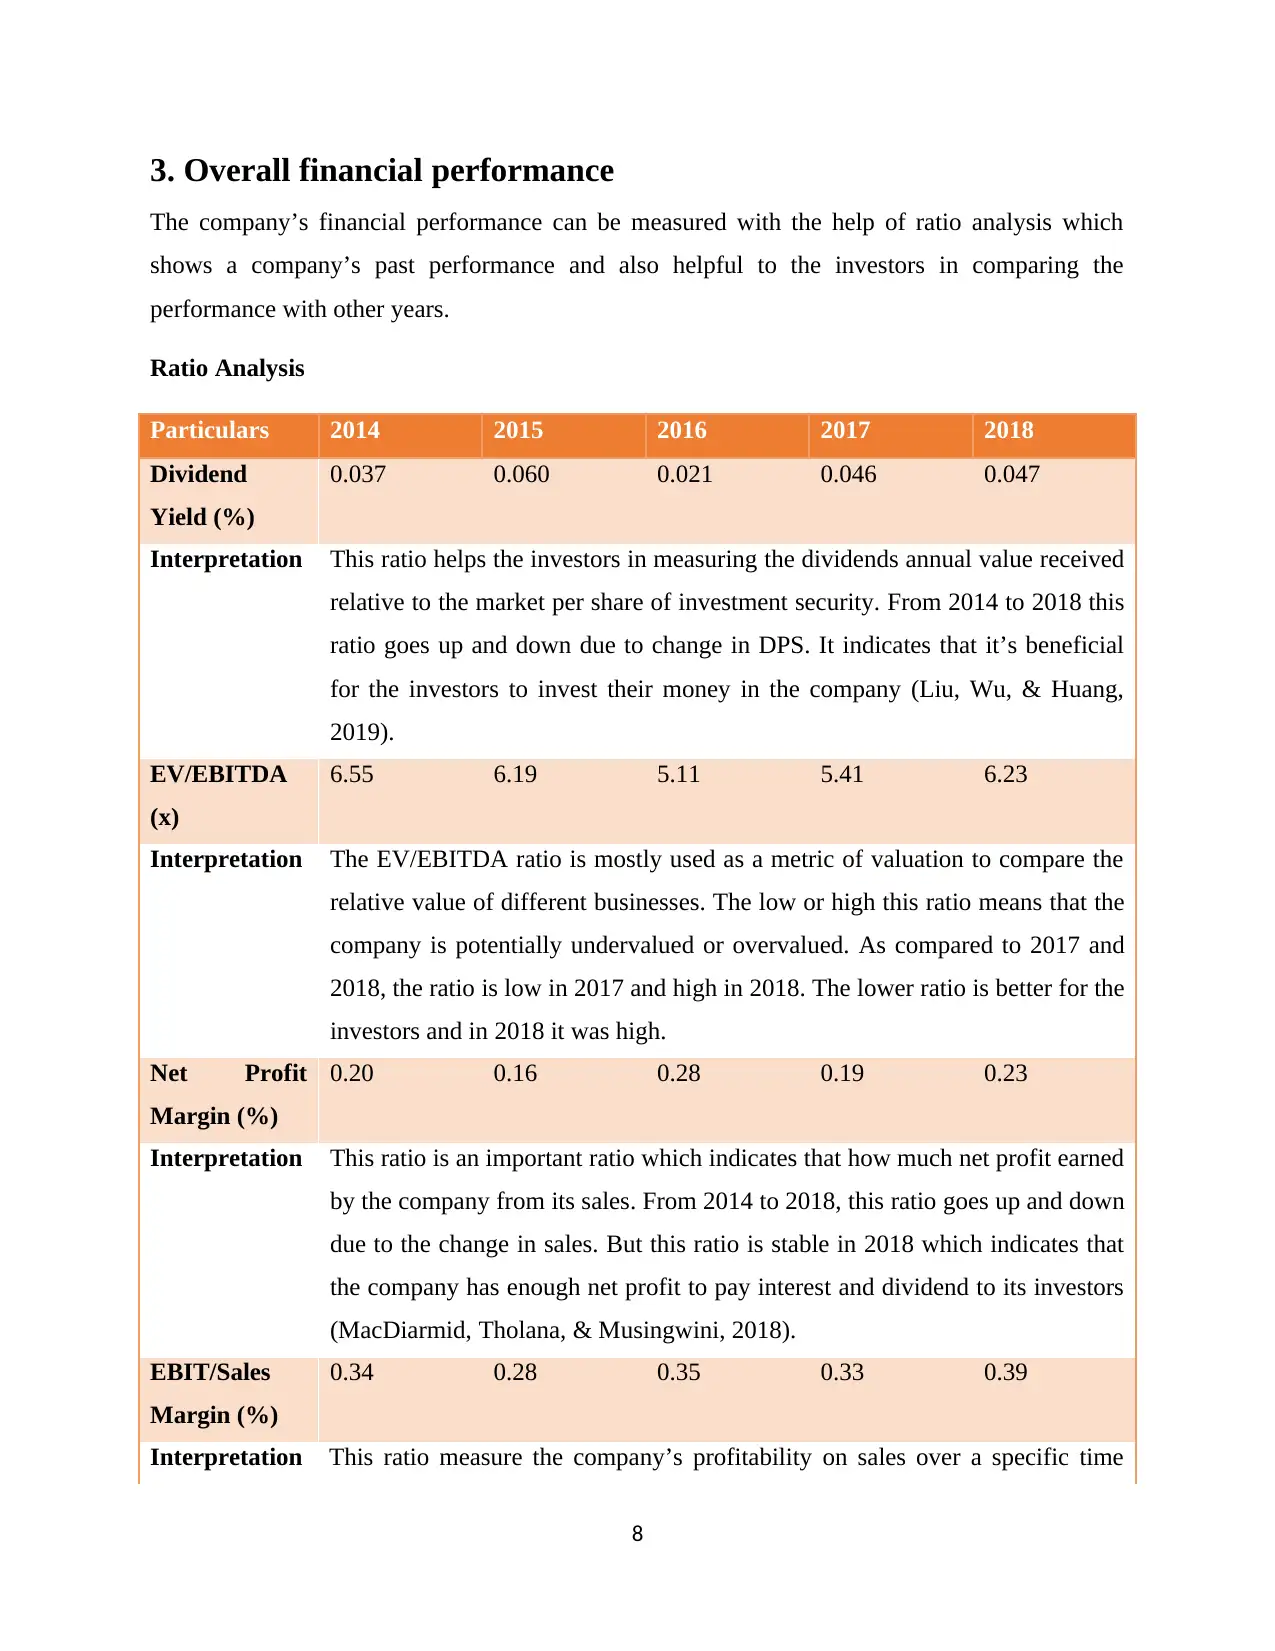
3. Overall financial performance
The company’s financial performance can be measured with the help of ratio analysis which
shows a company’s past performance and also helpful to the investors in comparing the
performance with other years.
Ratio Analysis
Particulars 2014 2015 2016 2017 2018
Dividend
Yield (%)
0.037 0.060 0.021 0.046 0.047
Interpretation This ratio helps the investors in measuring the dividends annual value received
relative to the market per share of investment security. From 2014 to 2018 this
ratio goes up and down due to change in DPS. It indicates that it’s beneficial
for the investors to invest their money in the company (Liu, Wu, & Huang,
2019).
EV/EBITDA
(x)
6.55 6.19 5.11 5.41 6.23
Interpretation The EV/EBITDA ratio is mostly used as a metric of valuation to compare the
relative value of different businesses. The low or high this ratio means that the
company is potentially undervalued or overvalued. As compared to 2017 and
2018, the ratio is low in 2017 and high in 2018. The lower ratio is better for the
investors and in 2018 it was high.
Net Profit
Margin (%)
0.20 0.16 0.28 0.19 0.23
Interpretation This ratio is an important ratio which indicates that how much net profit earned
by the company from its sales. From 2014 to 2018, this ratio goes up and down
due to the change in sales. But this ratio is stable in 2018 which indicates that
the company has enough net profit to pay interest and dividend to its investors
(MacDiarmid, Tholana, & Musingwini, 2018).
EBIT/Sales
Margin (%)
0.34 0.28 0.35 0.33 0.39
Interpretation This ratio measure the company’s profitability on sales over a specific time
8
period. It gives information on a company’s ability to earnings. The higher
EBIT margin reflects a more profitable business or more efficient cost
management. In 2018 it was high as compared to other years and it is
beneficial for investors to invest in the company.
ROE (%) 0.20 0.17 0.28 0.19 0.23
Interpretation One of the most important metrics of profitability is a return on equity. ROE
indicates that how a company employing investor’s capital in their business
operations. From 2014 to 2018 it was increasing and decreasing but stable in
2018 and beneficial for investment.
ROIC (%) 0.16 0.10 0.12 0.12 0.17
Interpretation It is a measure of performance used to evaluate the efficiency of an investment.
This ratio indicates that how a company uses the investment to generate
earnings. The higher ROIC indicates that the company is earning more money
on less investment. In 2018 it was higher as compare to the other years and it is
beneficial for investors to invest in the company.
EBITDA/Sales
Margin (%)
0.47 0.49 0.62 0.54 0.53
Interpretation It measures the company’s profitability, calculated by EBITDA divided by
total revenue or sales. Higher EBITDA indicates that the company is earning
sufficient revenue to cover its operating expenses. In 2018 it was high as
compared to 2014 and 2015 but low as compared to 2016 and 2017 (Ewing, &
Thompson, 2016).
ROA (%) 0.099 0.066 0.084 0.073 0.102
Interpretation It is a ratio of profitability that measures how accurately a company is earning
profits from its total assets. The higher ROA indicates that the companies is
more efficient to manage its total assets. In 2018 it was higher than in other
years and suitable for investors in investing purpose.
Interest Cover 19.42 20.60 10.61 8.88 13.57
Interpretation This ratio is used to measure how a company can easily pay their interest
expenses on outstanding debt. It is calculated by dividing EBIT by interest
expenses for the same period. It is low in 2018 which indicates that the
9
⊘ This is a preview!⊘
Do you want full access?
Subscribe today to unlock all pages.
Trusted by 1+ million students worldwide
company’s debt is low as compare to the other years and it is also suitable for
investors for their investment decision.
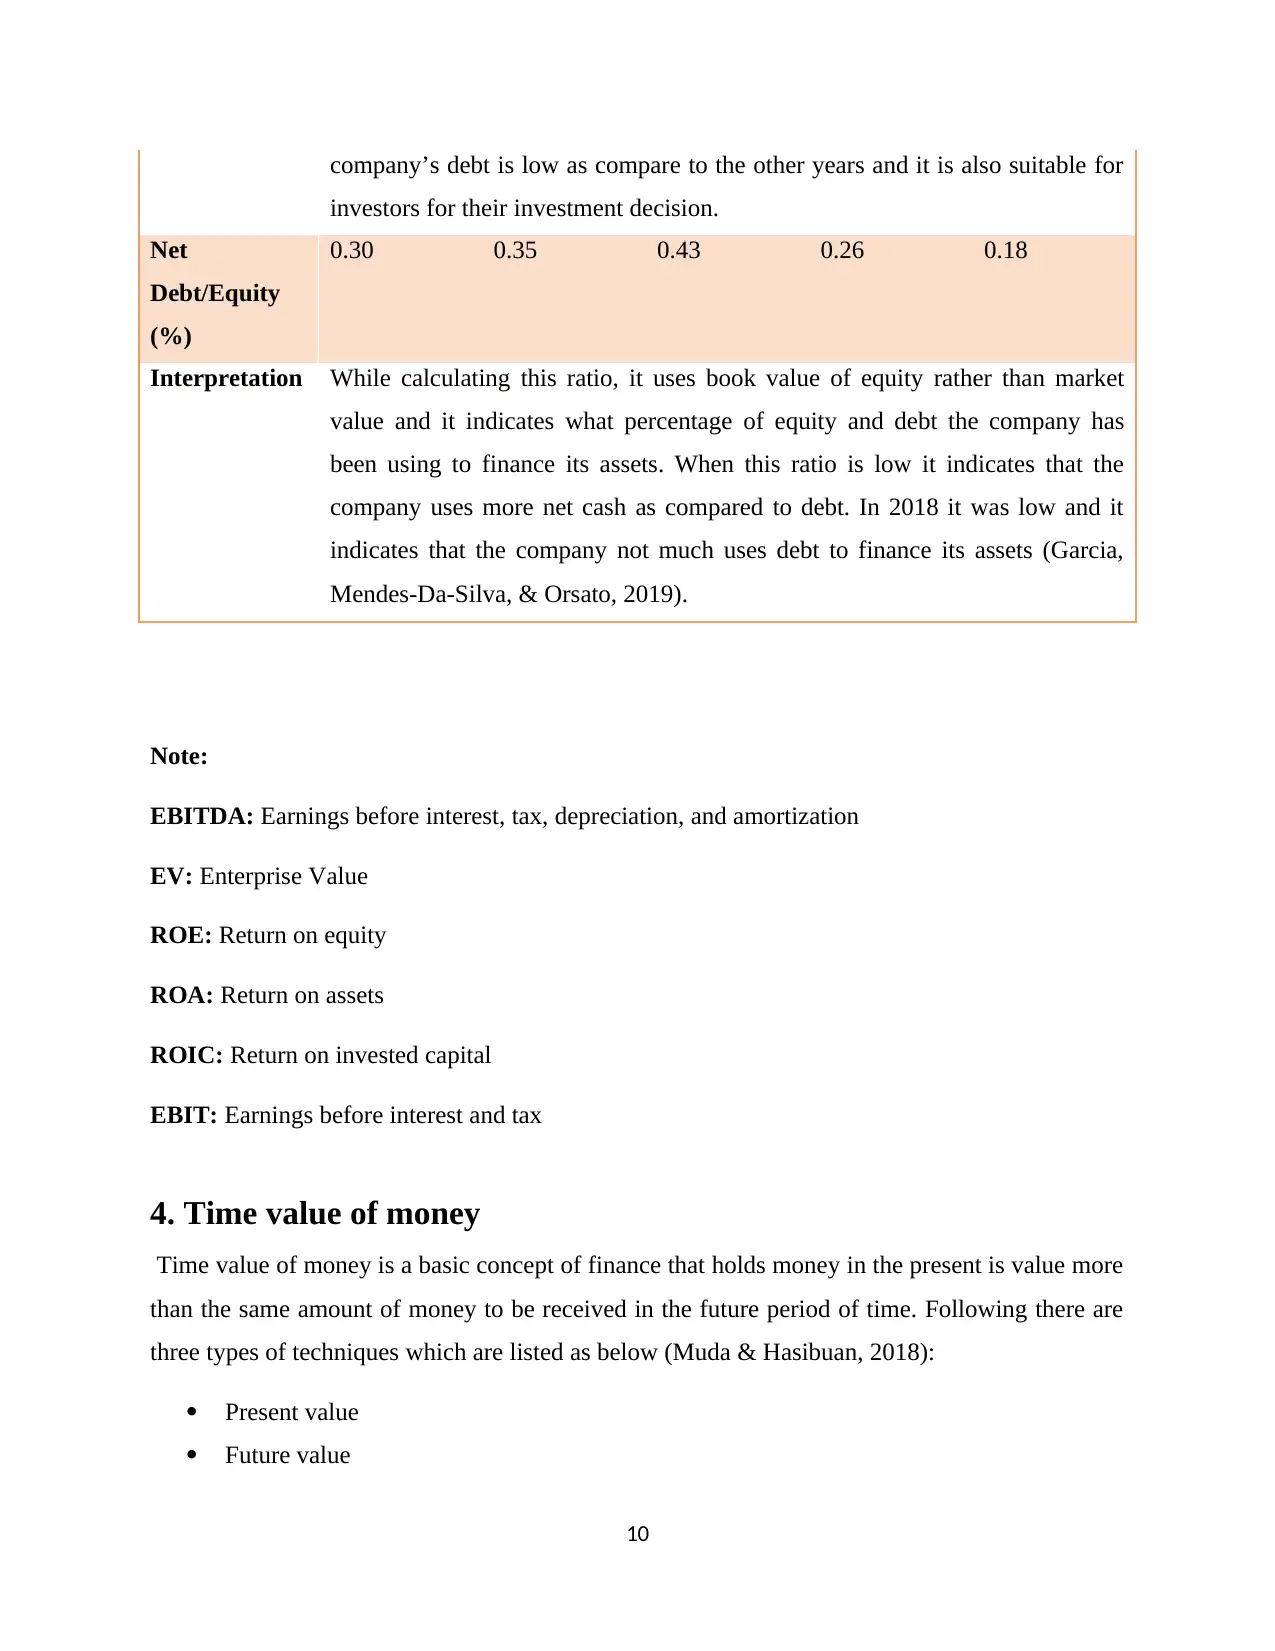
Net
Debt/Equity
(%)
0.30 0.35 0.43 0.26 0.18
Interpretation While calculating this ratio, it uses book value of equity rather than market
value and it indicates what percentage of equity and debt the company has
been using to finance its assets. When this ratio is low it indicates that the
company uses more net cash as compared to debt. In 2018 it was low and it
indicates that the company not much uses debt to finance its assets (Garcia,
Mendes-Da-Silva, & Orsato, 2019).
Note:
EBITDA: Earnings before interest, tax, depreciation, and amortization
EV: Enterprise Value
ROE: Return on equity
ROA: Return on assets
ROIC: Return on invested capital
EBIT: Earnings before interest and tax
4. Time value of money
Time value of money is a basic concept of finance that holds money in the present is value more
than the same amount of money to be received in the future period of time. Following there are
three types of techniques which are listed as below (Muda & Hasibuan, 2018):
Present value
Future value
10
investors for their investment decision.
Net
Debt/Equity
(%)
0.30 0.35 0.43 0.26 0.18
Interpretation While calculating this ratio, it uses book value of equity rather than market
value and it indicates what percentage of equity and debt the company has
been using to finance its assets. When this ratio is low it indicates that the
company uses more net cash as compared to debt. In 2018 it was low and it
indicates that the company not much uses debt to finance its assets (Garcia,
Mendes-Da-Silva, & Orsato, 2019).
Note:
EBITDA: Earnings before interest, tax, depreciation, and amortization
EV: Enterprise Value
ROE: Return on equity
ROA: Return on assets
ROIC: Return on invested capital
EBIT: Earnings before interest and tax
4. Time value of money
Time value of money is a basic concept of finance that holds money in the present is value more
than the same amount of money to be received in the future period of time. Following there are
three types of techniques which are listed as below (Muda & Hasibuan, 2018):
Present value
Future value
10
Paraphrase This Document
Need a fresh take? Get an instant paraphrase of this document with our AI Paraphraser
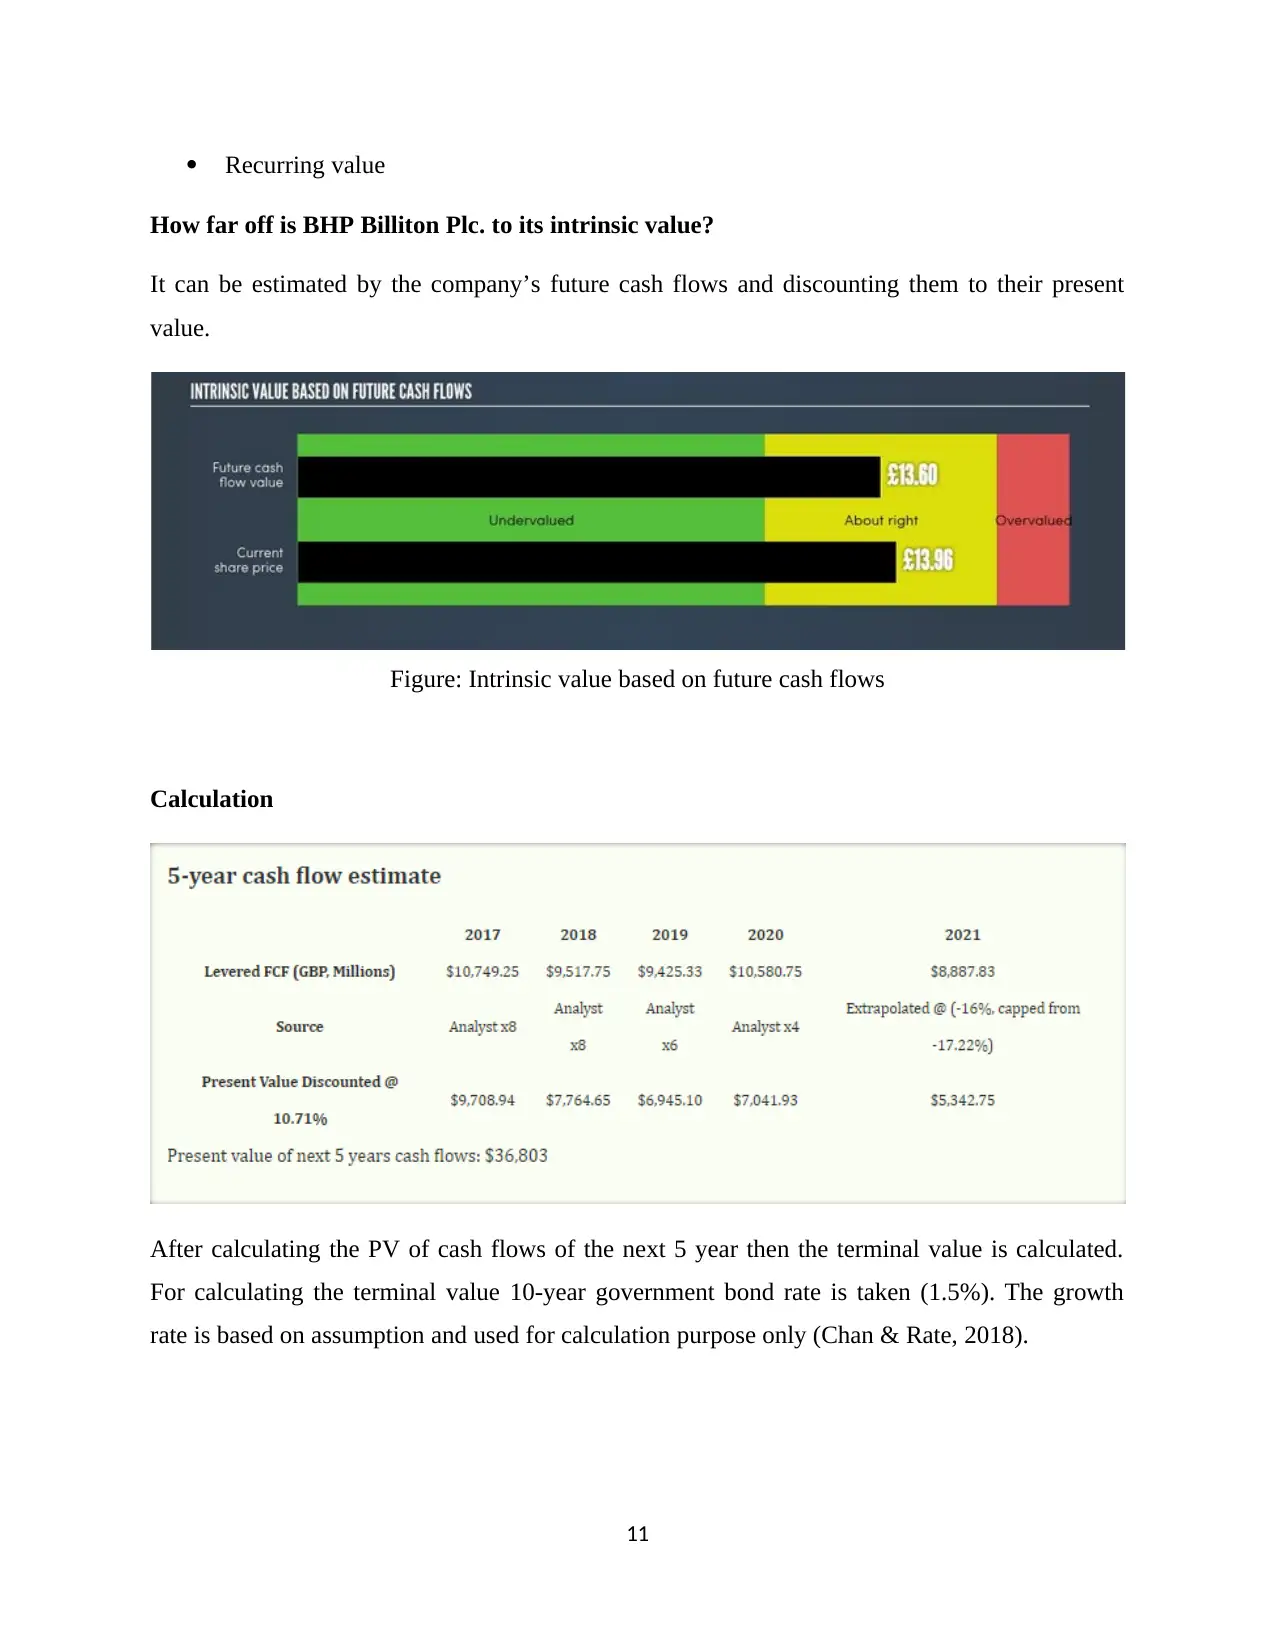
Recurring value
How far off is BHP Billiton Plc. to its intrinsic value?
It can be estimated by the company’s future cash flows and discounting them to their present
value.
Figure: Intrinsic value based on future cash flows
Calculation
After calculating the PV of cash flows of the next 5 year then the terminal value is calculated.
For calculating the terminal value 10-year government bond rate is taken (1.5%). The growth
rate is based on assumption and used for calculation purpose only (Chan & Rate, 2018).
11
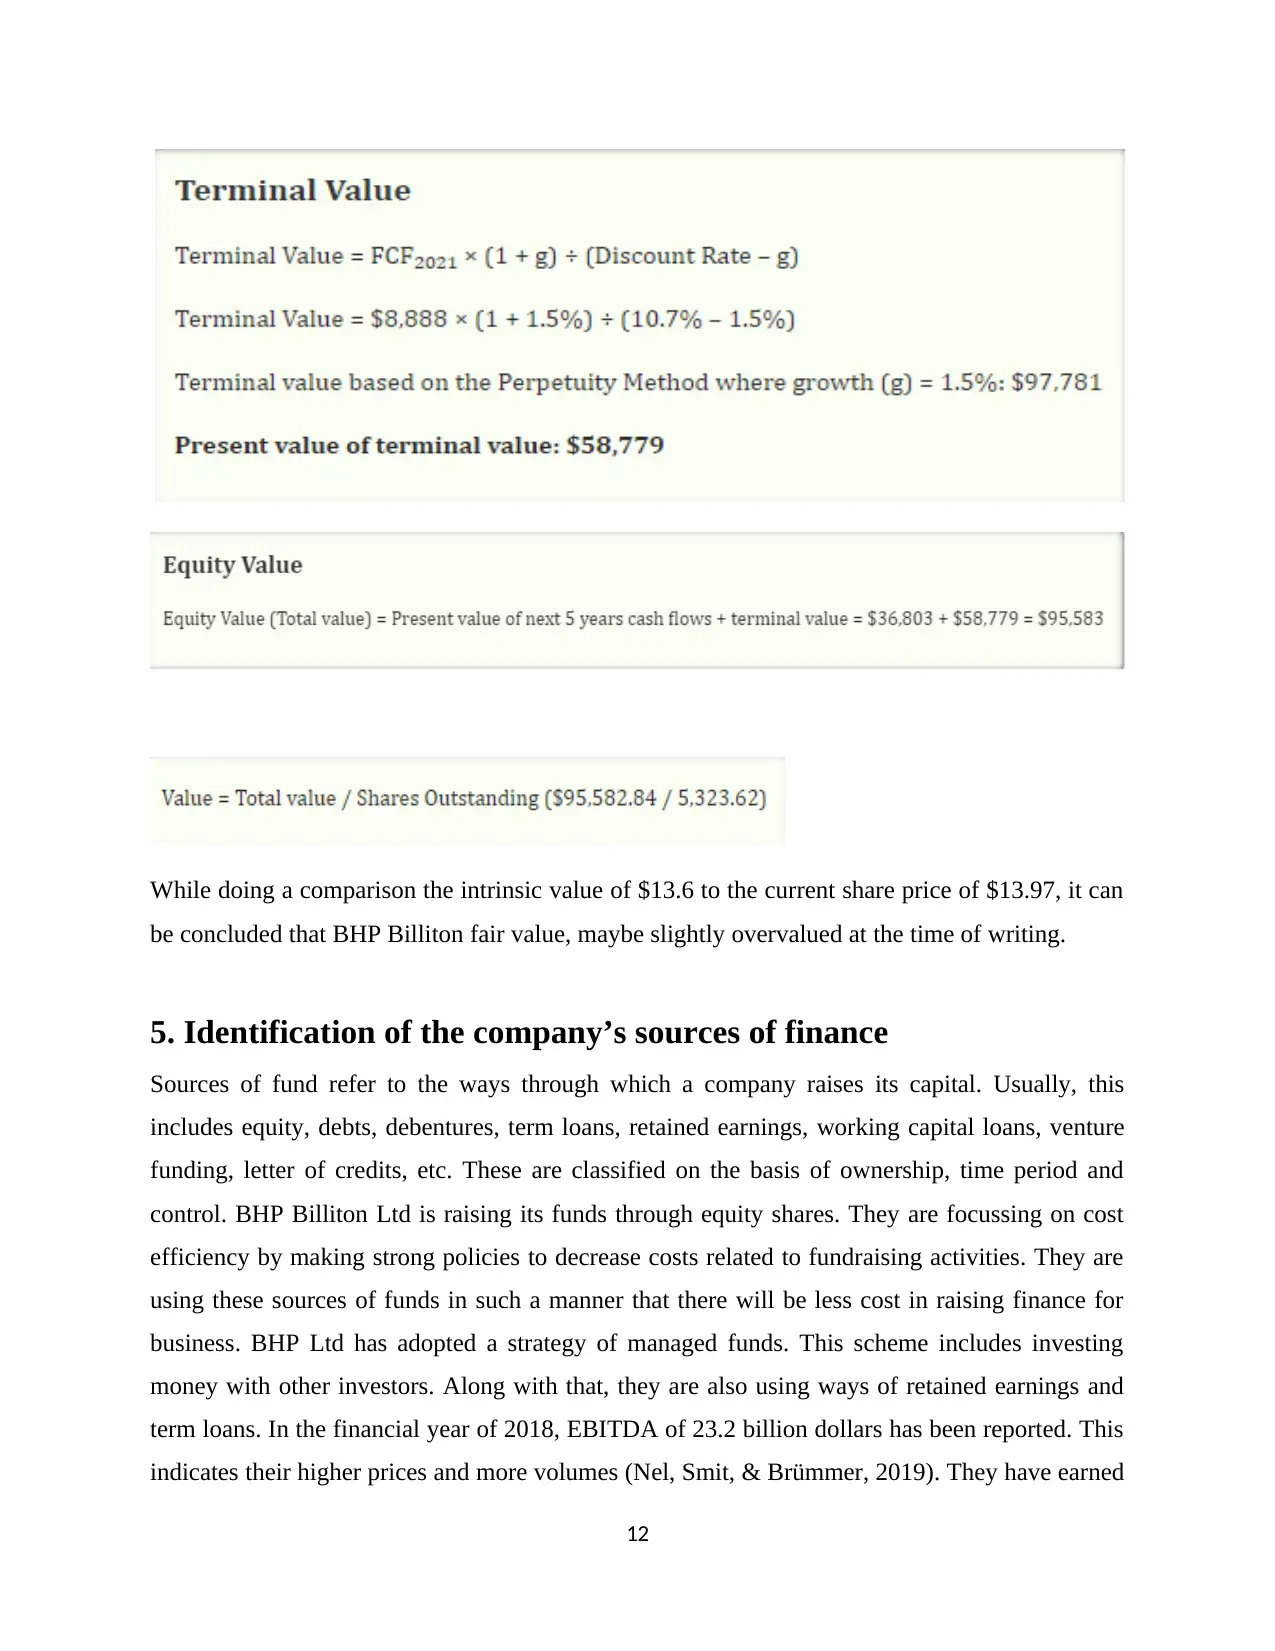
While doing a comparison the intrinsic value of $13.6 to the current share price of $13.97, it can
be concluded that BHP Billiton fair value, maybe slightly overvalued at the time of writing.
5. Identification of the company’s sources of finance
Sources of fund refer to the ways through which a company raises its capital. Usually, this
includes equity, debts, debentures, term loans, retained earnings, working capital loans, venture
funding, letter of credits, etc. These are classified on the basis of ownership, time period and
control. BHP Billiton Ltd is raising its funds through equity shares. They are focussing on cost
efficiency by making strong policies to decrease costs related to fundraising activities. They are
using these sources of funds in such a manner that there will be less cost in raising finance for
business. BHP Ltd has adopted a strategy of managed funds. This scheme includes investing
money with other investors. Along with that, they are also using ways of retained earnings and
term loans. In the financial year of 2018, EBITDA of 23.2 billion dollars has been reported. This
indicates their higher prices and more volumes (Nel, Smit, & Brümmer, 2019). They have earned
12
⊘ This is a preview!⊘
Do you want full access?
Subscribe today to unlock all pages.
Trusted by 1+ million students worldwide
1 out of 16
Related Documents


Your All-in-One AI-Powered Toolkit for Academic Success.
+13062052269
info@desklib.com
Available 24*7 on WhatsApp / Email
![[object Object]](/_next/static/media/star-bottom.7253800d.svg)
Unlock your academic potential
Copyright © 2020–2026 A2Z Services. All Rights Reserved. Developed and managed by ZUCOL.