Financial Performance Analysis of BHP: Income, Cash Flow, and Ratios
VerifiedAdded on 2021/06/14
|19
|3321
|46
Report
AI Summary
This report provides a comprehensive analysis of BHP's financial performance, examining its income statement, cash flow statement, and balance sheet for the 2017 financial year, comparing the results with the previous year (2016) and with its competitor, RIO Tinto Limited. The report delves into key financial metrics such as revenue, finance income, finance expenses, and net profit, highlighting trends and comparative performance. Furthermore, it includes a detailed ratio analysis, calculating Return on Assets, Inventory Turnover, Quick Ratio, and Price-Earnings Ratio for the years 2015, 2016, and 2017 to evaluate the company's financial position and provide insights for investors. The report also covers ethical considerations, including corporate governance and business operations, and concludes with recommendations based on the financial analysis, assessing BHP's overall performance and its potential for future investment.

RUNNING HEAD: ACCOUNTING FOR BUSINESS
ACCOUNTING FOR BUSINESS
ACCOUNTING FOR BUSINESS
Paraphrase This Document
Need a fresh take? Get an instant paraphrase of this document with our AI Paraphraser
ACCOUNTING FOR BUSINESS 1
EXECUTIVE SUMMARY
In this assignment, organisational performance of the BHP is considered. BHP
Billiton Limited is an Australian based public company established in 1885 engaged in
multinational mining, oil and gas, metals and petroleum products. The company is
headquartered in Melbourne, Australia. The company is operating as a Dual listed company
with two parent companies named BHP Billiton limited and BHP Billiton Plc. which is refer
as BHP. The performance of BHP is evaluated by analysing income statement, cash flow
statement and balance sheet by comparing current financial year’s figures (2017) with the
previous financial year (2016) and with the competitor (RIO Tinto Limited). Further four
financial ratios are also calculated for evaluating financial position such as Return on Assets,
Inventory Turnover, Quick ratio and Price-earnings ratio by taking three financial years
(2017, 2016 and 2015). This report also includes the ethical standards including corporate
governance, business operations, major competitors, industry size etc. Thus, this has been
concluded that BHP’s overall performance is good and investors should invest in this
company for earning sound returns in future.
ACCOUNTING FOR BUSINESS 2
Contents
BHP........................................................................................................................................................3
INTRODUCTION.................................................................................................................................3
COMPANY OVERVIEW.......................................................................................................................3
SECTION 1..........................................................................................................................................4
Analyse Consolidated Income statement and comparison with the previous year’s figures and
also from the competitor (RIO Tinto limited)................................................................................4
Analyse Cash Flow statement........................................................................................................7
Analyse Balance Sheet...................................................................................................................8
SECTION 2..........................................................................................................................................9
⊘ This is a preview!⊘
Do you want full access?
Subscribe today to unlock all pages.
Trusted by 1+ million students worldwide
ACCOUNTING FOR BUSINESS 3
BHP
INTRODUCTION
This report will provide the analysis of the BHP financial performance considering
2017 financial year. The performance of this company is gauged in three sections. The first
section includes analysing income statement, cash flow statement and balance sheet by
comparing current financial year’s figures (2017) with the previous financial year (2016) and
with the competitor (RIO Tinto Limited). Second section of the report includes ratio analysis
technique where financial position of BHP is evaluated from Return on Assets, Inventory
Turnover, Quick ratio and Price-earnings ratio by taking three financial years (2017, 2016
and 2015) to recommend to the current investor whether to continue to capitalize in BHP or
not and also to the potential investor whether to spend in the company or not. Last but not the
least third section of the report includes ethical standards including corporate governance
statement, elaborating business operations, identification of major competitors, industry size,
market value etc. explaining how management works for the best interest of the company.
Further this report begins with the company overview and ends with recommendations and
conclusions.
The financial figures will be pull out from the Balance sheet, income statement and
the cash flow statement given in the Annual report. The financial health will be determined
for the purpose of assessing whether the investor should invest or not.
COMPANY OVERVIEW
BHP is an Australian based publicly listed company incorporated in 1885. The issuer code is
ASX: BHP. The headquarter of the company is situated in Melbourne, Australia. From 2001,
the company is functioning as a Double registered company with two parent companies
Paraphrase This Document
Need a fresh take? Get an instant paraphrase of this document with our AI Paraphraser
ACCOUNTING FOR BUSINESS 4
named BHP Billiton limited and BHP Billiton Plc. which is commonly known as BHP. The
company is engaged in the production, advertising, discovery, expansion of coper, iron ore,
oil and gas, diamond, silver, lead, zinc, alumina, aluminium, coal, manganese, nickel and
other range of natural assets. In financial year 2017, the company was announced as a largest
independent mining and metals company based on market capitalisation. Currently company
providing services in 25 nations with marketing and sales led through from United States,
Houston and Singapore. Key executives of the company are: Ken MacKenzle, he is the
chairman of the company and Andrew MacKenzle, he is the Chief executive officer of the
company The BHP employs approximately 60,000 workforces composing 20.5 % of women
while promoting variety and morals at the workplace. The main objective of the company is
to offer turn-key results across the globe in order to create long-term shareholder’s value
(BHP, 2018).
Therefore, after discussion of the company overview, BHP’s financial heath is analysed as
per the three sections discussed below:
SECTION 1
Analyse Consolidated Income statement and comparison with the
previous year’s figures and also from the competitor (RIO Tinto limited).
The following are the key highlights of the BHP’s profitability position:
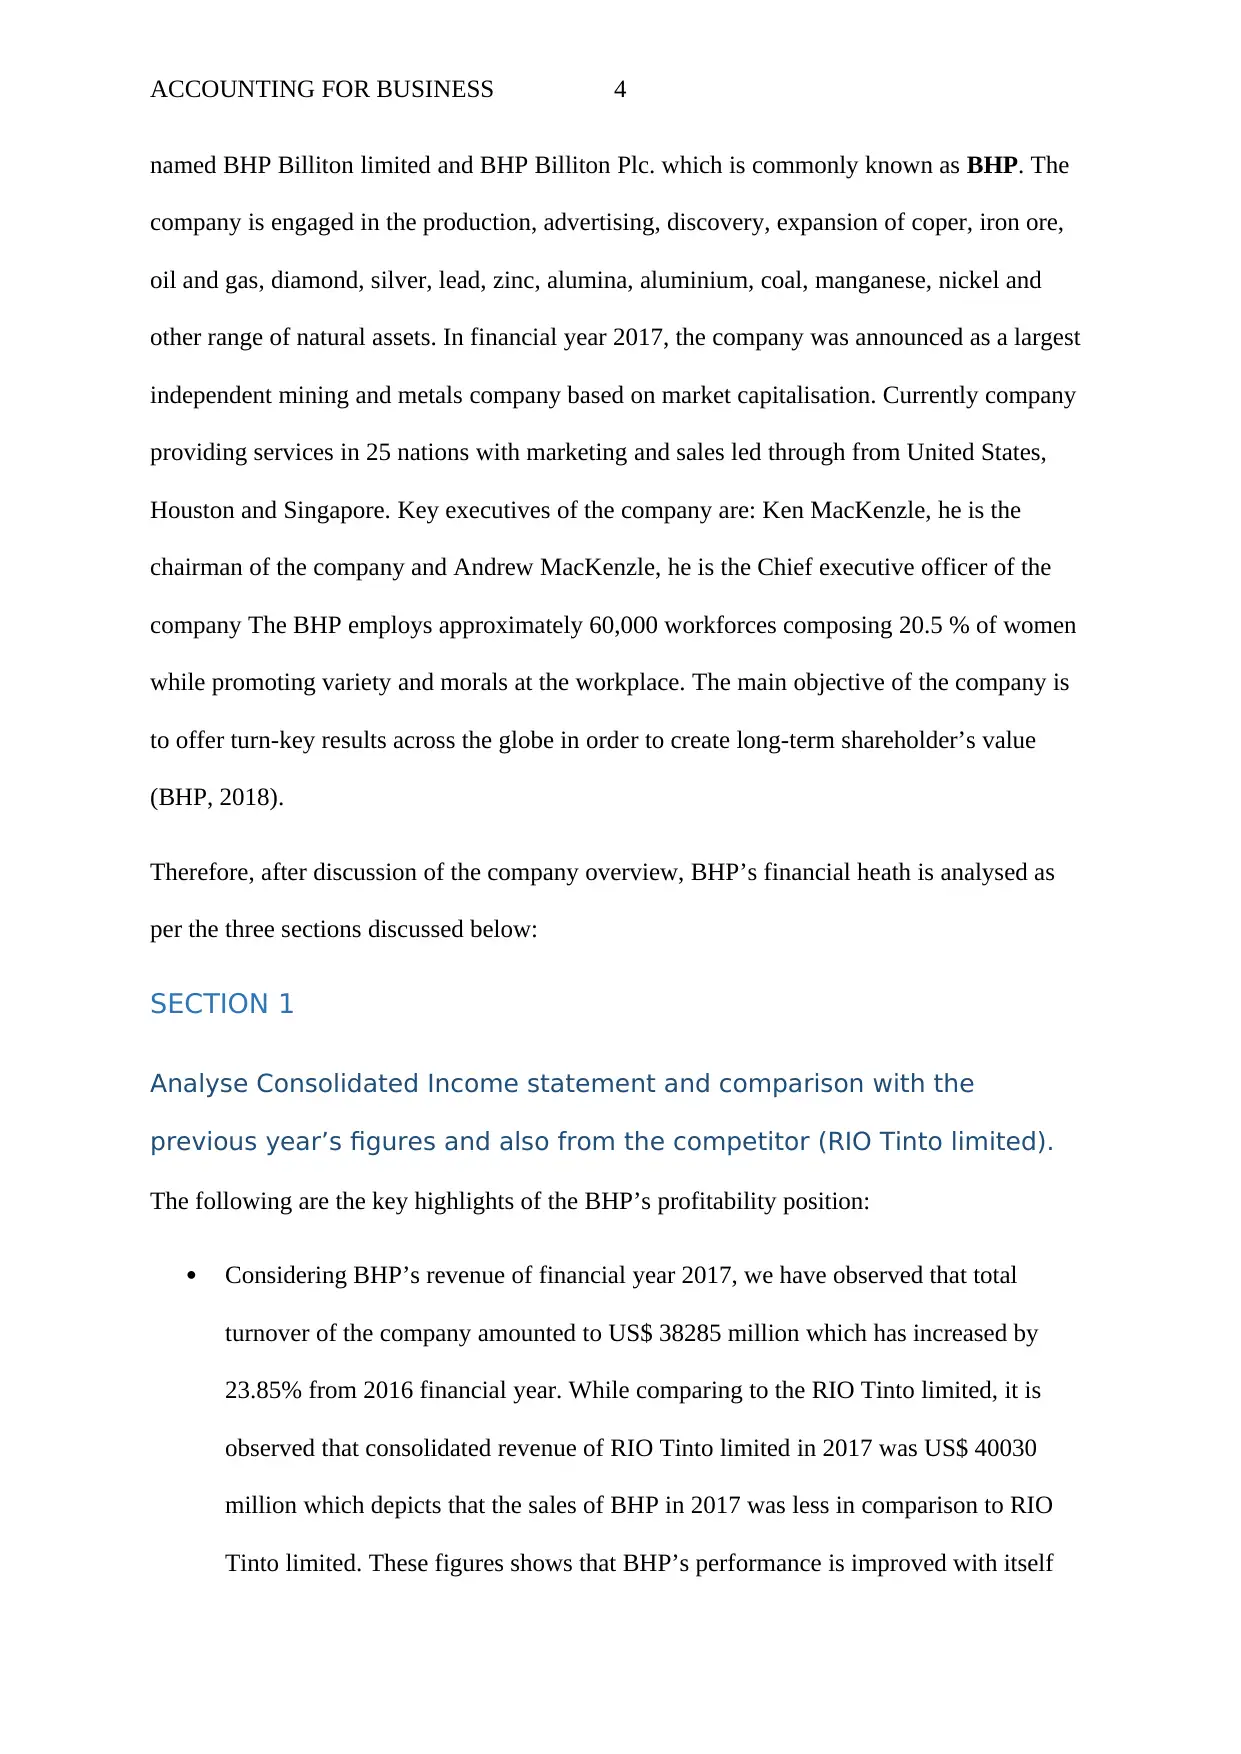
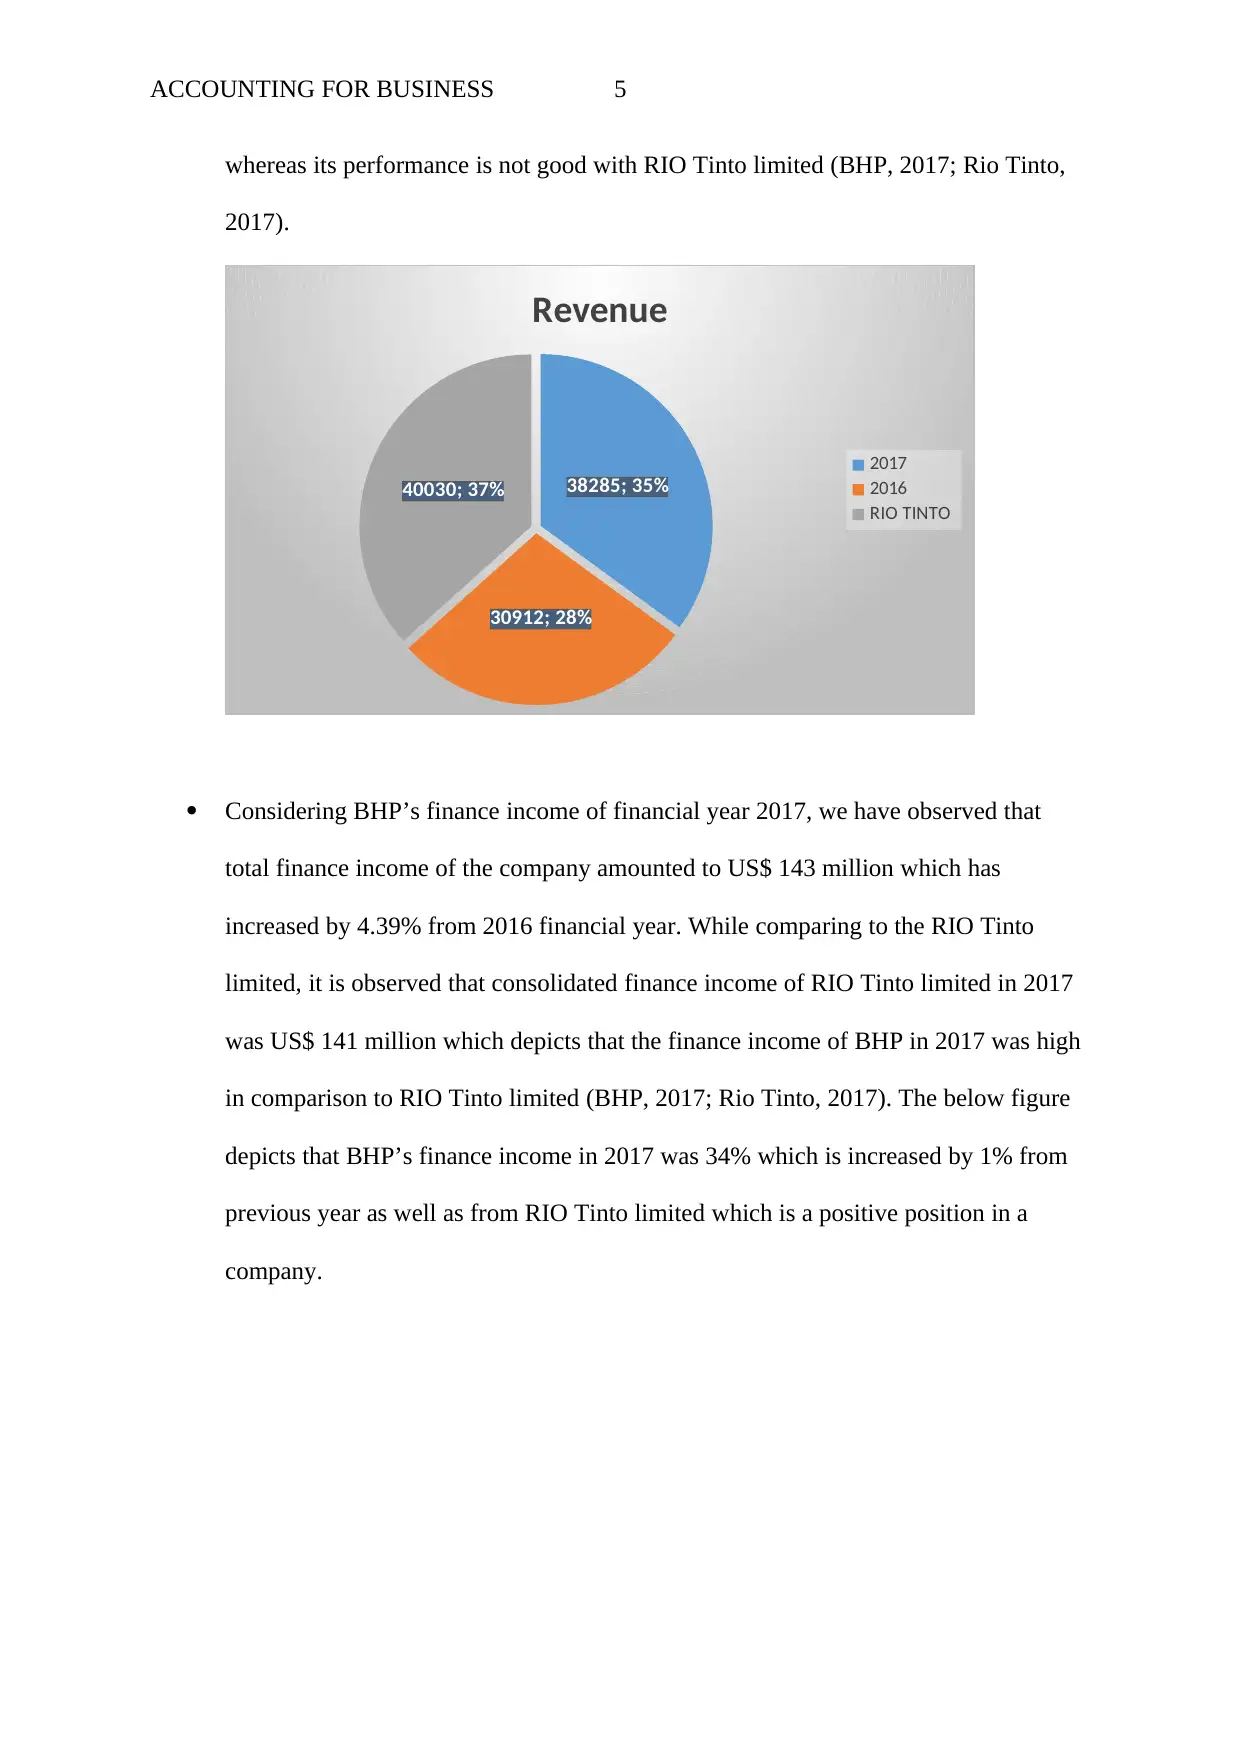
Considering BHP’s revenue of financial year 2017, we have observed that total
turnover of the company amounted to US$ 38285 million which has increased by
23.85% from 2016 financial year. While comparing to the RIO Tinto limited, it is
observed that consolidated revenue of RIO Tinto limited in 2017 was US$ 40030
million which depicts that the sales of BHP in 2017 was less in comparison to RIO
Tinto limited. These figures shows that BHP’s performance is improved with itself
named BHP Billiton limited and BHP Billiton Plc. which is commonly known as BHP. The
company is engaged in the production, advertising, discovery, expansion of coper, iron ore,
oil and gas, diamond, silver, lead, zinc, alumina, aluminium, coal, manganese, nickel and
other range of natural assets. In financial year 2017, the company was announced as a largest
independent mining and metals company based on market capitalisation. Currently company
providing services in 25 nations with marketing and sales led through from United States,
Houston and Singapore. Key executives of the company are: Ken MacKenzle, he is the
chairman of the company and Andrew MacKenzle, he is the Chief executive officer of the
company The BHP employs approximately 60,000 workforces composing 20.5 % of women
while promoting variety and morals at the workplace. The main objective of the company is
to offer turn-key results across the globe in order to create long-term shareholder’s value
(BHP, 2018).
Therefore, after discussion of the company overview, BHP’s financial heath is analysed as
per the three sections discussed below:
SECTION 1
Analyse Consolidated Income statement and comparison with the
previous year’s figures and also from the competitor (RIO Tinto limited).
The following are the key highlights of the BHP’s profitability position:
Considering BHP’s revenue of financial year 2017, we have observed that total
turnover of the company amounted to US$ 38285 million which has increased by
23.85% from 2016 financial year. While comparing to the RIO Tinto limited, it is
observed that consolidated revenue of RIO Tinto limited in 2017 was US$ 40030
million which depicts that the sales of BHP in 2017 was less in comparison to RIO
Tinto limited. These figures shows that BHP’s performance is improved with itself
ACCOUNTING FOR BUSINESS 5
whereas its performance is not good with RIO Tinto limited (BHP, 2017; Rio Tinto,
2017).
38285; 35%
30912; 28%
40030; 37%
Revenue
2017
2016
RIO TINTO
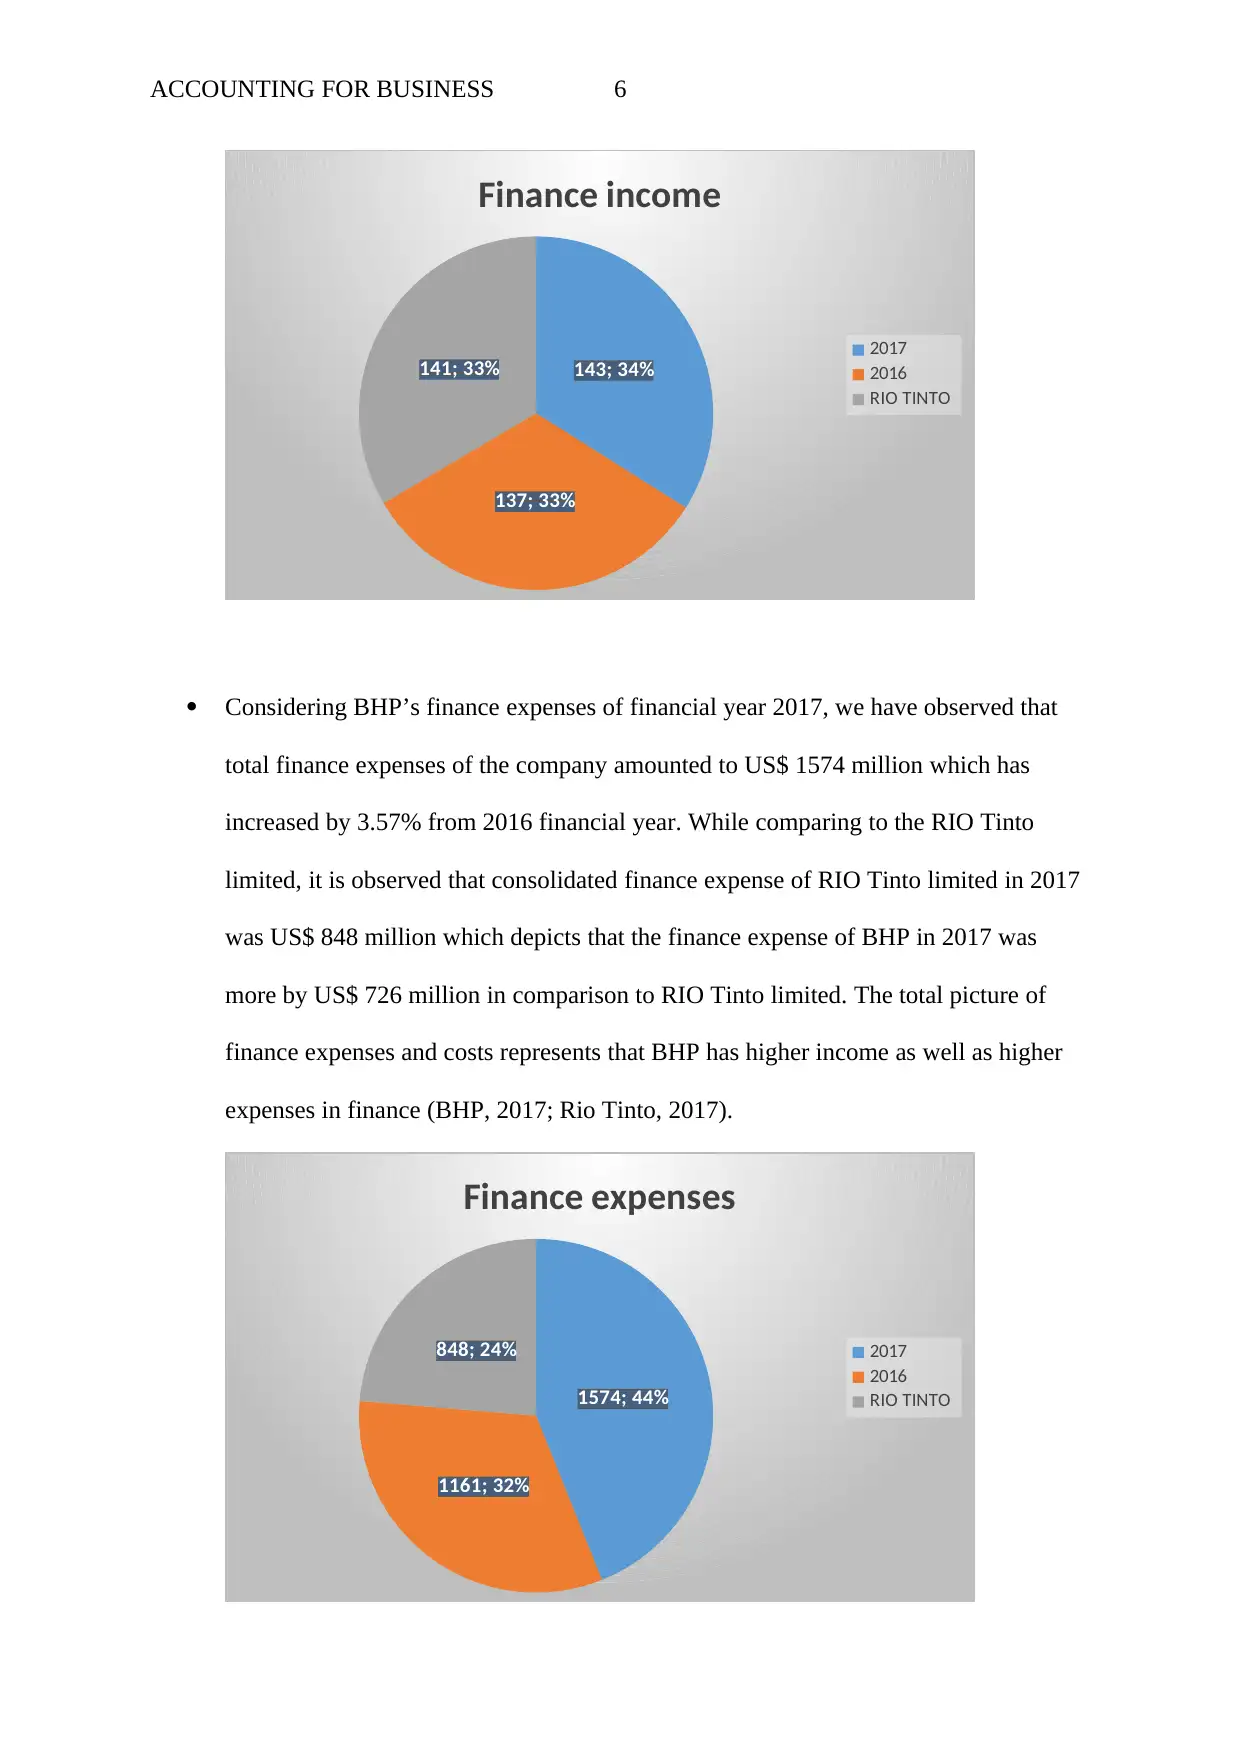
Considering BHP’s finance income of financial year 2017, we have observed that
total finance income of the company amounted to US$ 143 million which has
increased by 4.39% from 2016 financial year. While comparing to the RIO Tinto
limited, it is observed that consolidated finance income of RIO Tinto limited in 2017
was US$ 141 million which depicts that the finance income of BHP in 2017 was high
in comparison to RIO Tinto limited (BHP, 2017; Rio Tinto, 2017). The below figure
depicts that BHP’s finance income in 2017 was 34% which is increased by 1% from
previous year as well as from RIO Tinto limited which is a positive position in a
company.
whereas its performance is not good with RIO Tinto limited (BHP, 2017; Rio Tinto,
2017).
38285; 35%
30912; 28%
40030; 37%
Revenue
2017
2016
RIO TINTO
Considering BHP’s finance income of financial year 2017, we have observed that
total finance income of the company amounted to US$ 143 million which has
increased by 4.39% from 2016 financial year. While comparing to the RIO Tinto
limited, it is observed that consolidated finance income of RIO Tinto limited in 2017
was US$ 141 million which depicts that the finance income of BHP in 2017 was high
in comparison to RIO Tinto limited (BHP, 2017; Rio Tinto, 2017). The below figure
depicts that BHP’s finance income in 2017 was 34% which is increased by 1% from
previous year as well as from RIO Tinto limited which is a positive position in a
company.
⊘ This is a preview!⊘
Do you want full access?
Subscribe today to unlock all pages.
Trusted by 1+ million students worldwide
ACCOUNTING FOR BUSINESS 6
143; 34%
137; 33%
141; 33%
Finance income
2017
2016
RIO TINTO
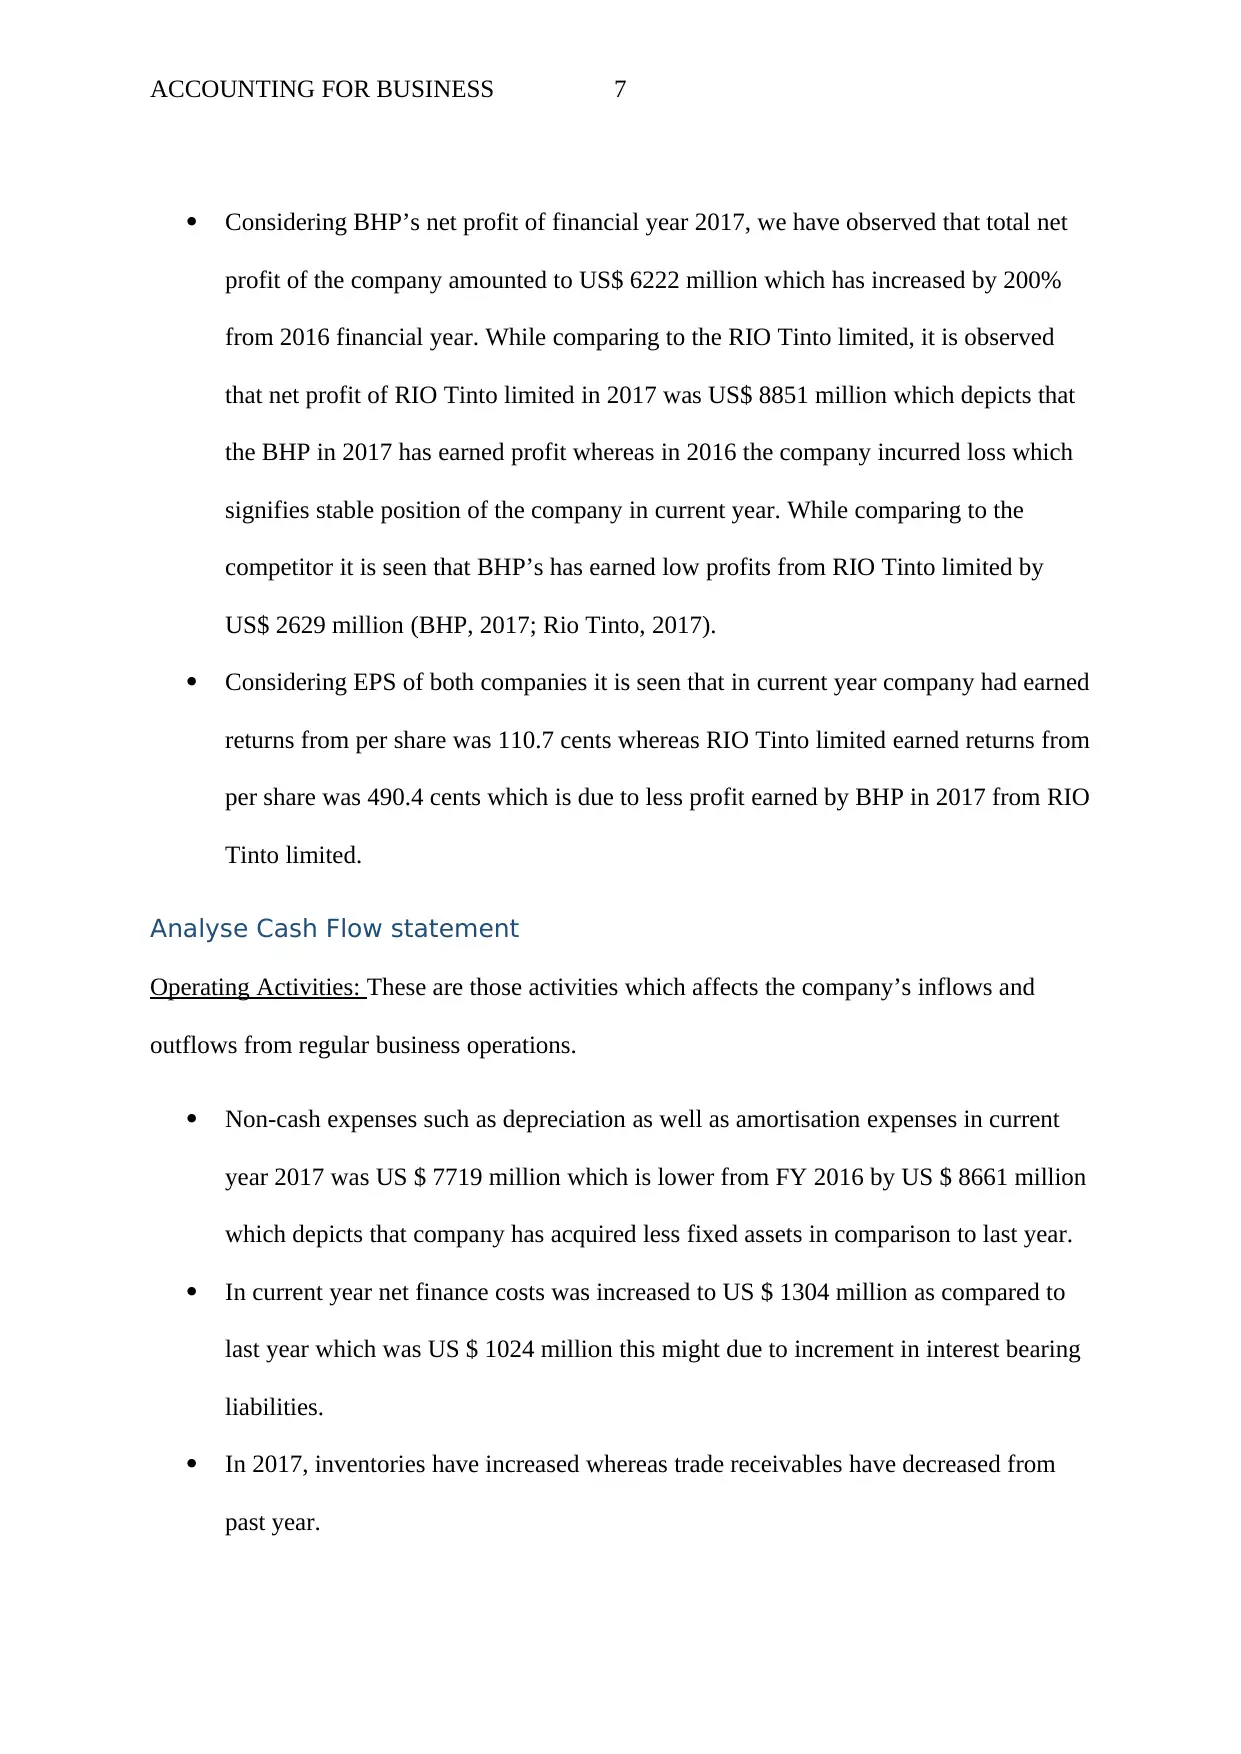
Considering BHP’s finance expenses of financial year 2017, we have observed that
total finance expenses of the company amounted to US$ 1574 million which has
increased by 3.57% from 2016 financial year. While comparing to the RIO Tinto
limited, it is observed that consolidated finance expense of RIO Tinto limited in 2017
was US$ 848 million which depicts that the finance expense of BHP in 2017 was
more by US$ 726 million in comparison to RIO Tinto limited. The total picture of
finance expenses and costs represents that BHP has higher income as well as higher
expenses in finance (BHP, 2017; Rio Tinto, 2017).
1574; 44%
1161; 32%
848; 24%
Finance expenses
2017
2016
RIO TINTO
143; 34%
137; 33%
141; 33%
Finance income
2017
2016
RIO TINTO
Considering BHP’s finance expenses of financial year 2017, we have observed that
total finance expenses of the company amounted to US$ 1574 million which has
increased by 3.57% from 2016 financial year. While comparing to the RIO Tinto
limited, it is observed that consolidated finance expense of RIO Tinto limited in 2017
was US$ 848 million which depicts that the finance expense of BHP in 2017 was
more by US$ 726 million in comparison to RIO Tinto limited. The total picture of
finance expenses and costs represents that BHP has higher income as well as higher
expenses in finance (BHP, 2017; Rio Tinto, 2017).
1574; 44%
1161; 32%
848; 24%
Finance expenses
2017
2016
RIO TINTO
Paraphrase This Document
Need a fresh take? Get an instant paraphrase of this document with our AI Paraphraser
ACCOUNTING FOR BUSINESS 7
Considering BHP’s net profit of financial year 2017, we have observed that total net
profit of the company amounted to US$ 6222 million which has increased by 200%
from 2016 financial year. While comparing to the RIO Tinto limited, it is observed
that net profit of RIO Tinto limited in 2017 was US$ 8851 million which depicts that
the BHP in 2017 has earned profit whereas in 2016 the company incurred loss which
signifies stable position of the company in current year. While comparing to the
competitor it is seen that BHP’s has earned low profits from RIO Tinto limited by
US$ 2629 million (BHP, 2017; Rio Tinto, 2017).
Considering EPS of both companies it is seen that in current year company had earned
returns from per share was 110.7 cents whereas RIO Tinto limited earned returns from
per share was 490.4 cents which is due to less profit earned by BHP in 2017 from RIO
Tinto limited.
Analyse Cash Flow statement
Operating Activities: These are those activities which affects the company’s inflows and
outflows from regular business operations.
Non-cash expenses such as depreciation as well as amortisation expenses in current
year 2017 was US $ 7719 million which is lower from FY 2016 by US $ 8661 million
which depicts that company has acquired less fixed assets in comparison to last year.
In current year net finance costs was increased to US $ 1304 million as compared to
last year which was US $ 1024 million this might due to increment in interest bearing
liabilities.
In 2017, inventories have increased whereas trade receivables have decreased from
past year.
ACCOUNTING FOR BUSINESS 8
Interest received to the company is more than the interest paid by the company in
2017 in comparison to 2016.
As a whole, company’s cash flows from operating activities in 2017 was US$ 16804
million which is increased by US $ 6179 million from past year which depicts that the
company has sound earnings from business operations.
Investing Activities: These are those activities from which company’s cash position is
affected due to long term assets and investments owned by the company.
In 2017, the company has sold its assets for US$ 648 million while it was only US$
107 million in 2016.
Purchase of plant, property and equipment in 2017 was US$ 4252 million while in
last year acquisition was amounted to US$ 6946 million which depicts that company
has spent less by US$ 2694 million in plant, property and equipment.
In 2017, company had made investment and funding of equity accounted investments
for US$ 234 million while in last year it was – US$ 40 million.
As a whole, company’s cash flows used in investing activities in 2017 was US$ 4161
million which was decreased by US $ 3084 million from past year which depicts that the
company’s cash movement in current year was better as compare to last year.
Financing Activities: These are those activities which affects the company’s cash movement
due to external activities that allow to raise capital.
BHP’s has proceeded from the interest bearing liabilities was only US$ 1577 million
while last year it was US$ 7239 million whereas repayment of interest bearing
liabilities was US$ 7120 million in 2017 while last year it was US$ 2788 million.
Thus, net cash outflow was US$ 5543 million which has impacted highly on cash
flow from financing activities.
⊘ This is a preview!⊘
Do you want full access?
Subscribe today to unlock all pages.
Trusted by 1+ million students worldwide
ACCOUNTING FOR BUSINESS 9
Current year dividend paid was US$ 2921 million while last year dividend paid was
US$ 4130 million.
As a whole, company’s cash flows used in financing activities in 2017 was US$ 9133
million while it was positive in 2016 which depicts that the company’s cash movement in
current year was worst as compare to last year.
Analyse Balance Sheet
Assets
Cash and cash equivalents was US$ 14153 million in 2017 which has increased by
US$ 3834 million from past year which depicts that the company has highly liquid
assets which are readily convertible into known amount of cash.
BHP’s trade and other receivables had decreased to US$ 2838 million from US$
3155 million. The majority of overdue are less than 30 days.
Property, plant and equipment was decreased by US$ 3478 million from last year.
Intangible assets have also decreased by US$ 119 million.
Inventories are raw materials, WIP and finished goods comprising of current as well
as non-current total amounting to US$ 4768 million
As an overall total assets had decreased from past year by 1.64%.
Liabilities
Company had interest bearing liabilities comprising current and non-current total
amounted to US$ 30474 million which has tremendously decreased from 2016
financial year amounted to US$ 36421 million.
Company’s trade and other payables had increased from the past year to US$ 154
million.
Paraphrase This Document
Need a fresh take? Get an instant paraphrase of this document with our AI Paraphraser
ACCOUNTING FOR BUSINESS 10
Company’s provision amount was also increased in 2017 by 2.54% from financial
year 2016.
As an overall total liabilities had decreased from past year by 7.82%.
Thus, net assets of the company have increased to US$ 62726 million whereas it was US$
60071 million in 2016.
SECTION 2
Following are the calculation of four financial ratios considering three financial years (2017,
2016 and 2015).
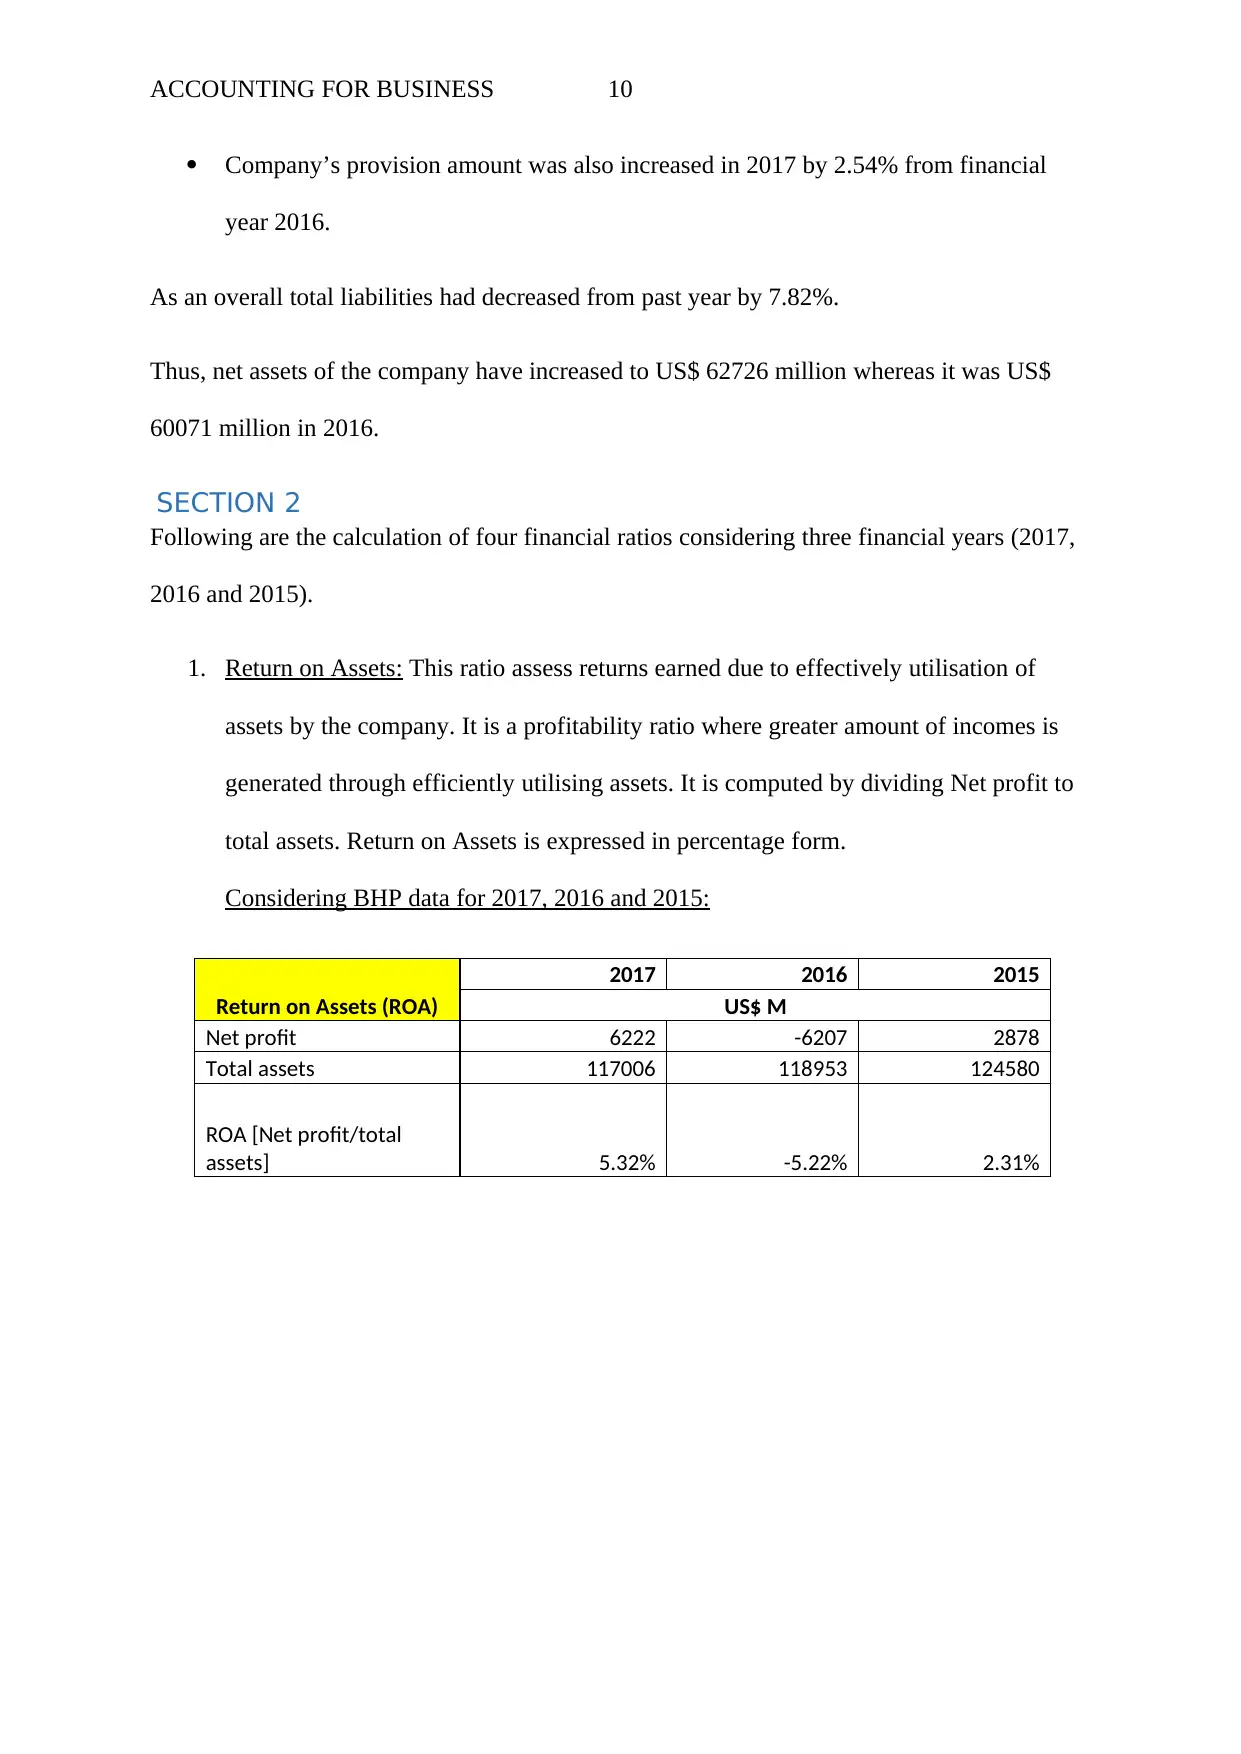
1. Return on Assets: This ratio assess returns earned due to effectively utilisation of
assets by the company. It is a profitability ratio where greater amount of incomes is
generated through efficiently utilising assets. It is computed by dividing Net profit to
total assets. Return on Assets is expressed in percentage form.
Considering BHP data for 2017, 2016 and 2015:
Return on Assets (ROA)
2017 2016 2015
US$ M
Net profit 6222 -6207 2878
Total assets 117006 118953 124580
ROA [Net profit/total
assets] 5.32% -5.22% 2.31%
Company’s provision amount was also increased in 2017 by 2.54% from financial
year 2016.
As an overall total liabilities had decreased from past year by 7.82%.
Thus, net assets of the company have increased to US$ 62726 million whereas it was US$
60071 million in 2016.
SECTION 2
Following are the calculation of four financial ratios considering three financial years (2017,
2016 and 2015).
1. Return on Assets: This ratio assess returns earned due to effectively utilisation of
assets by the company. It is a profitability ratio where greater amount of incomes is
generated through efficiently utilising assets. It is computed by dividing Net profit to
total assets. Return on Assets is expressed in percentage form.
Considering BHP data for 2017, 2016 and 2015:
Return on Assets (ROA)
2017 2016 2015
US$ M
Net profit 6222 -6207 2878
Total assets 117006 118953 124580
ROA [Net profit/total
assets] 5.32% -5.22% 2.31%
ACCOUNTING FOR BUSINESS 11
2017
2016
2015
Return on Assets (ROA)
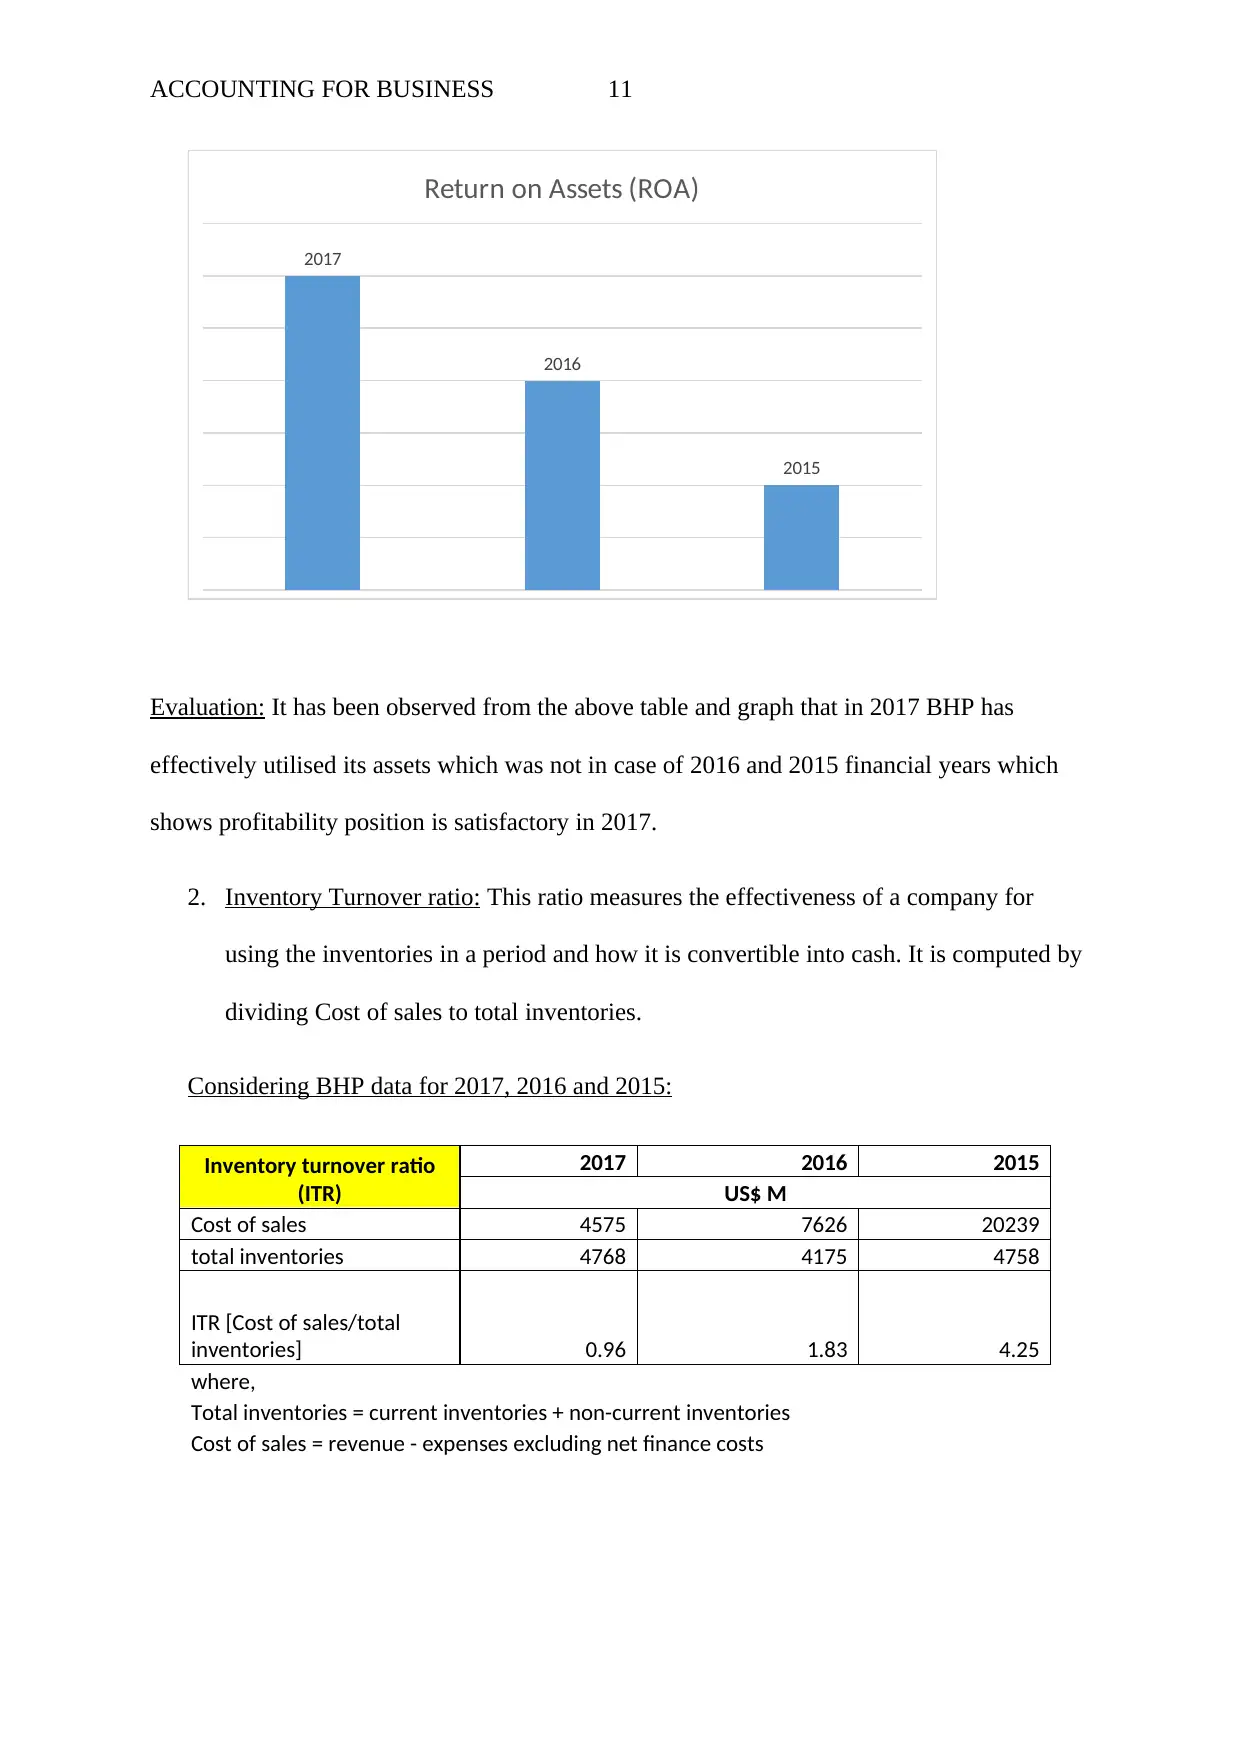
Evaluation: It has been observed from the above table and graph that in 2017 BHP has
effectively utilised its assets which was not in case of 2016 and 2015 financial years which
shows profitability position is satisfactory in 2017.
2. Inventory Turnover ratio: This ratio measures the effectiveness of a company for
using the inventories in a period and how it is convertible into cash. It is computed by
dividing Cost of sales to total inventories.
Considering BHP data for 2017, 2016 and 2015:
Inventory turnover ratio
(ITR)
2017 2016 2015
US$ M
Cost of sales 4575 7626 20239
total inventories 4768 4175 4758
ITR [Cost of sales/total
inventories] 0.96 1.83 4.25
where,
Total inventories = current inventories + non-current inventories
Cost of sales = revenue - expenses excluding net finance costs
2017
2016
2015
Return on Assets (ROA)
Evaluation: It has been observed from the above table and graph that in 2017 BHP has
effectively utilised its assets which was not in case of 2016 and 2015 financial years which
shows profitability position is satisfactory in 2017.
2. Inventory Turnover ratio: This ratio measures the effectiveness of a company for
using the inventories in a period and how it is convertible into cash. It is computed by
dividing Cost of sales to total inventories.
Considering BHP data for 2017, 2016 and 2015:
Inventory turnover ratio
(ITR)
2017 2016 2015
US$ M
Cost of sales 4575 7626 20239
total inventories 4768 4175 4758
ITR [Cost of sales/total
inventories] 0.96 1.83 4.25
where,
Total inventories = current inventories + non-current inventories
Cost of sales = revenue - expenses excluding net finance costs
⊘ This is a preview!⊘
Do you want full access?
Subscribe today to unlock all pages.
Trusted by 1+ million students worldwide
1 out of 19
Related Documents


Your All-in-One AI-Powered Toolkit for Academic Success.
+13062052269
info@desklib.com
Available 24*7 on WhatsApp / Email
![[object Object]](/_next/static/media/star-bottom.7253800d.svg)
Unlock your academic potential
Copyright © 2020–2026 A2Z Services. All Rights Reserved. Developed and managed by ZUCOL.