Financial Analysis Report: Evaluating BHP's Financial Statements

Verified

Added on  2022/08/14

|9
|1627
|14
Report
AI Summary
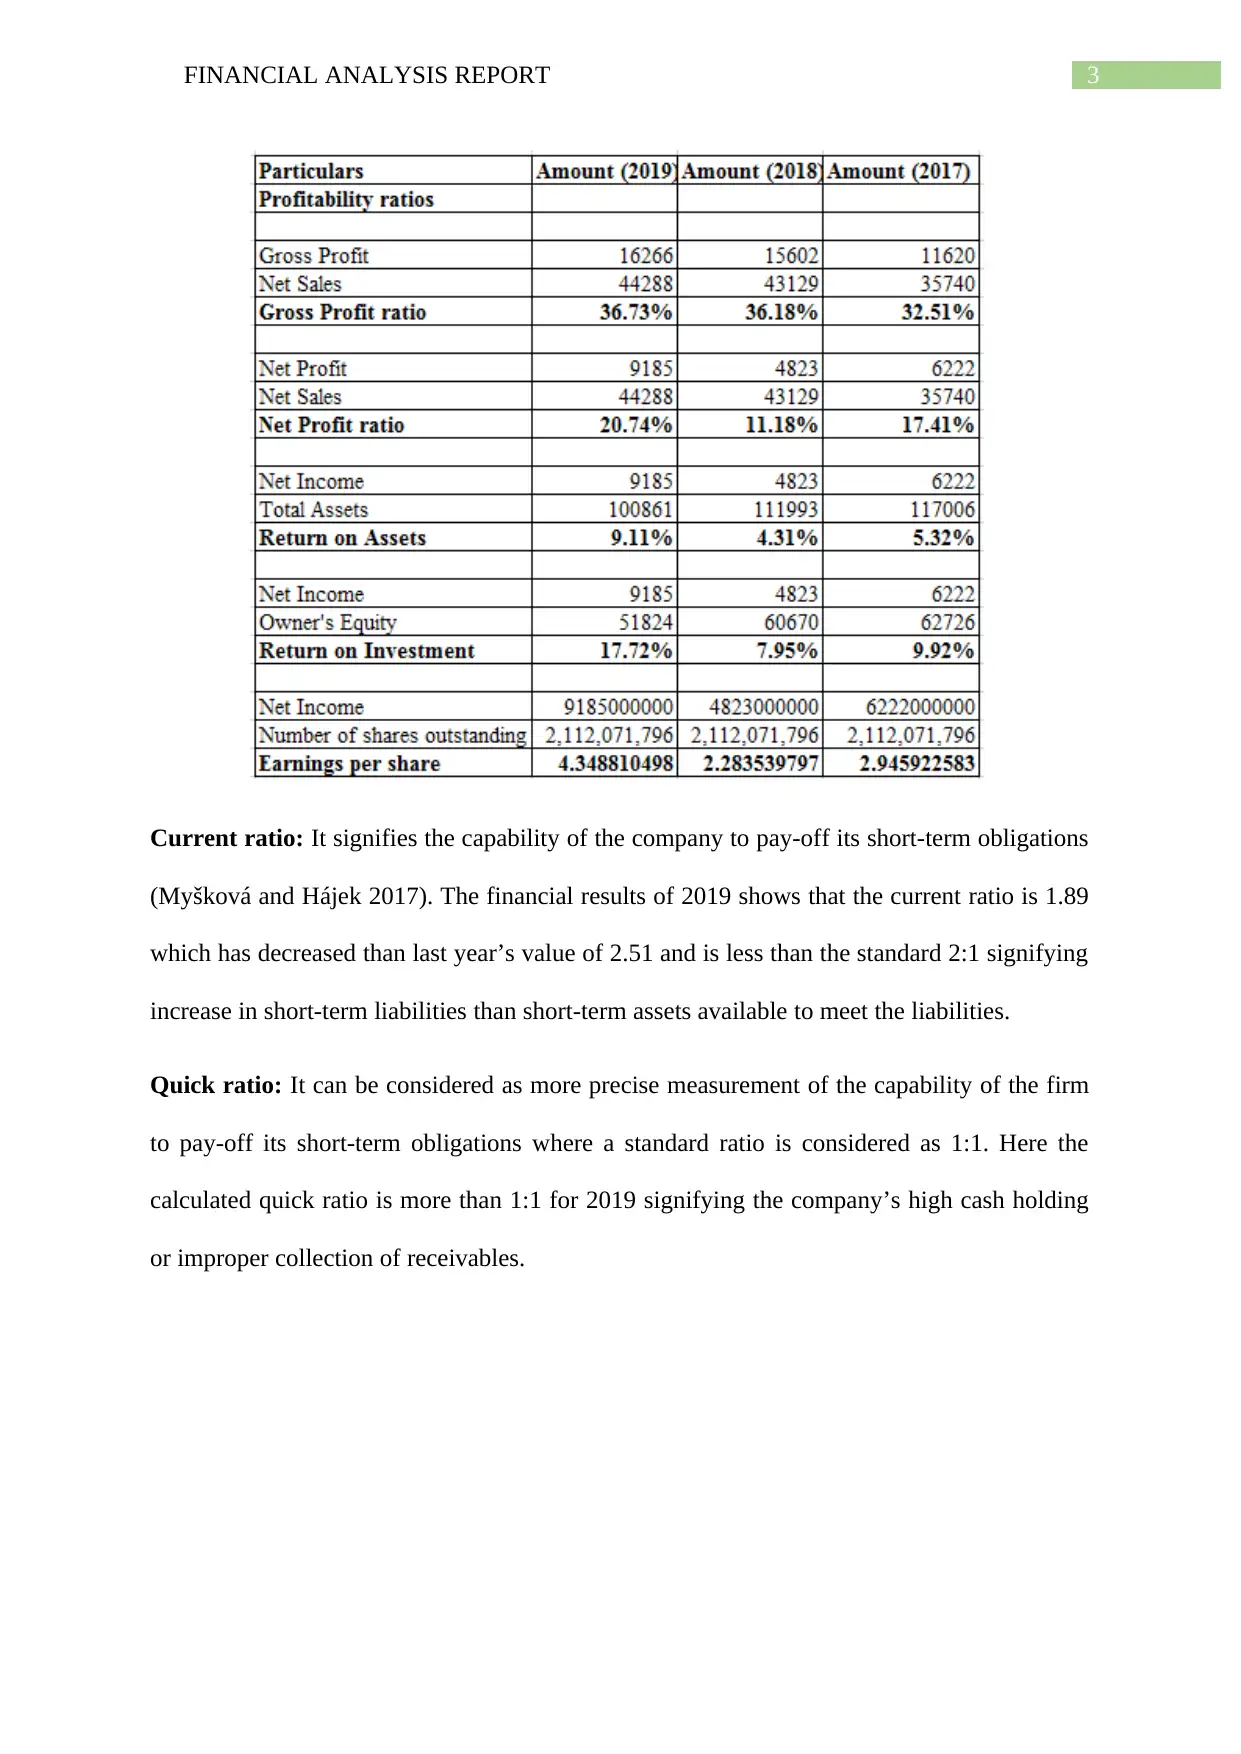
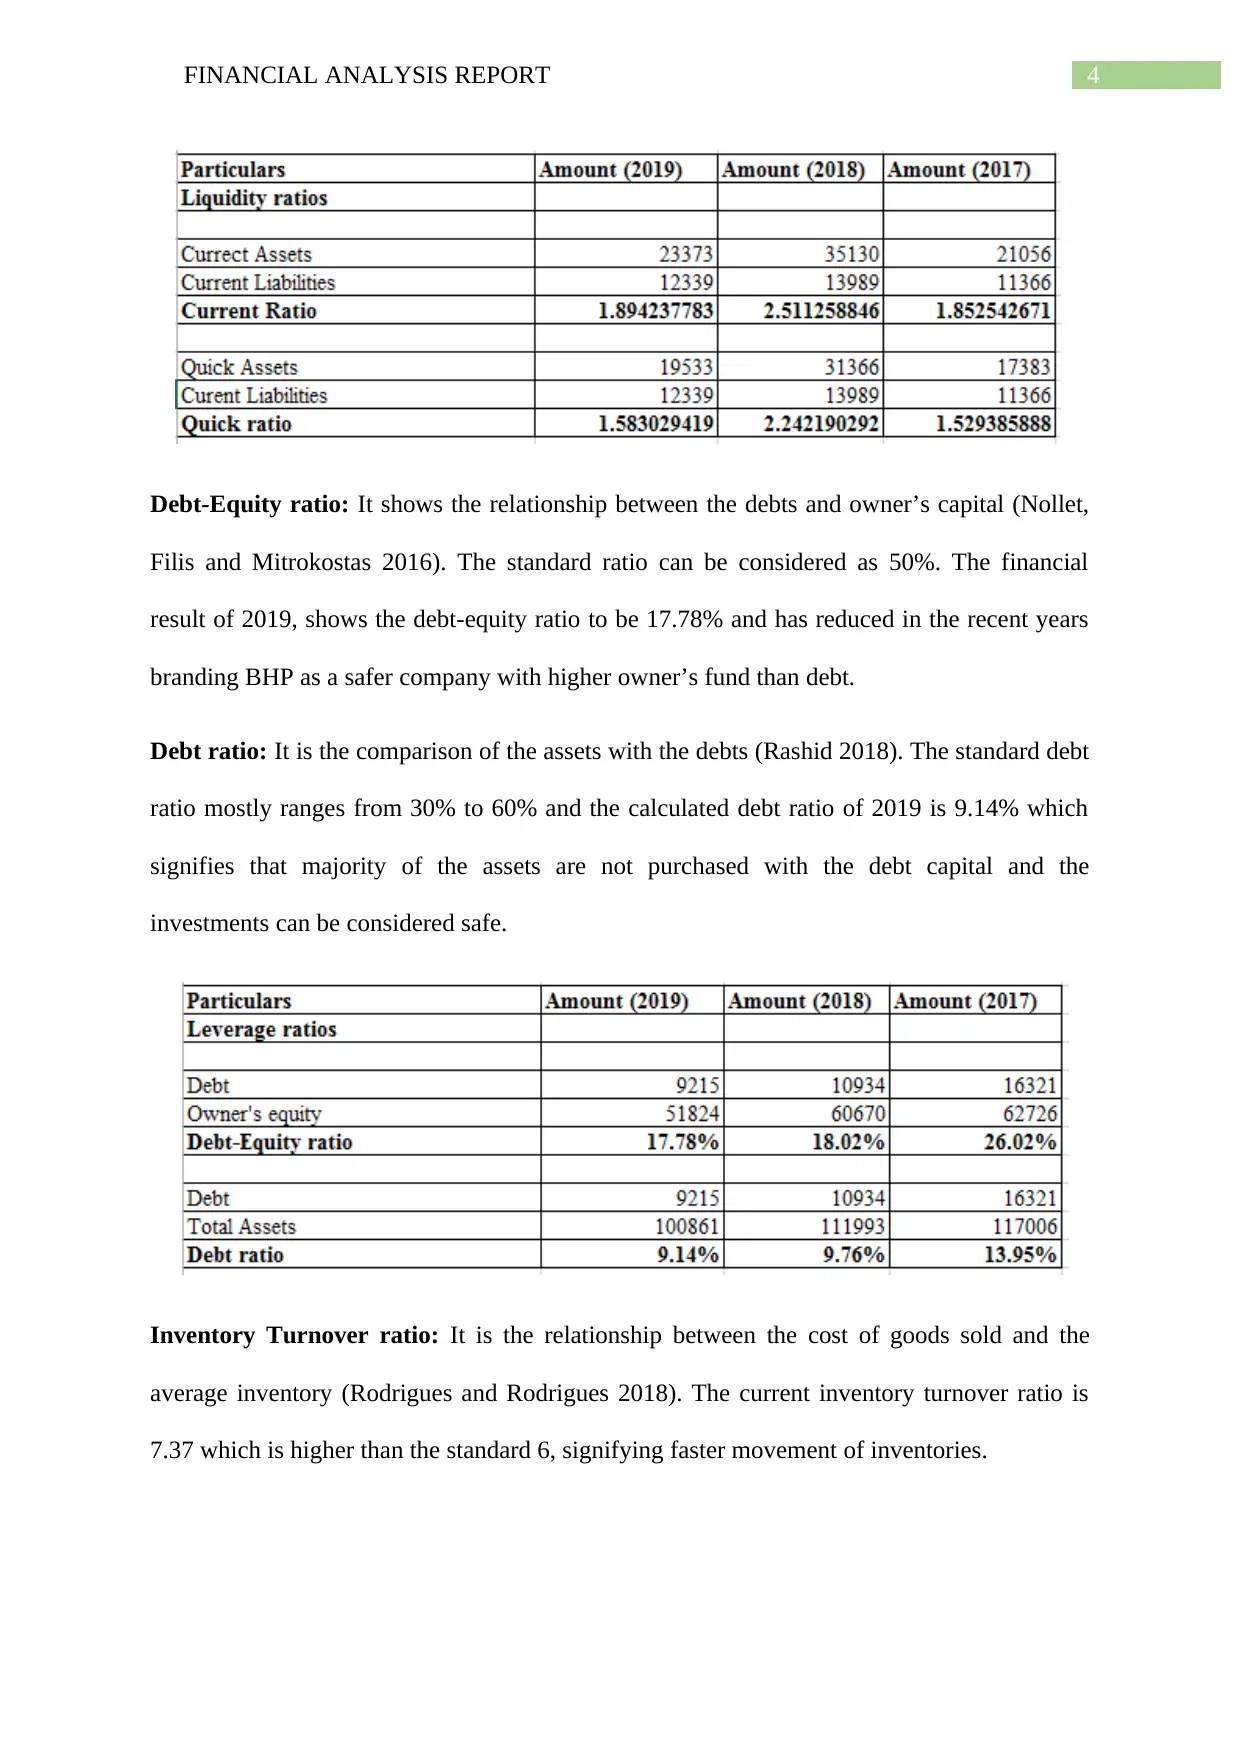
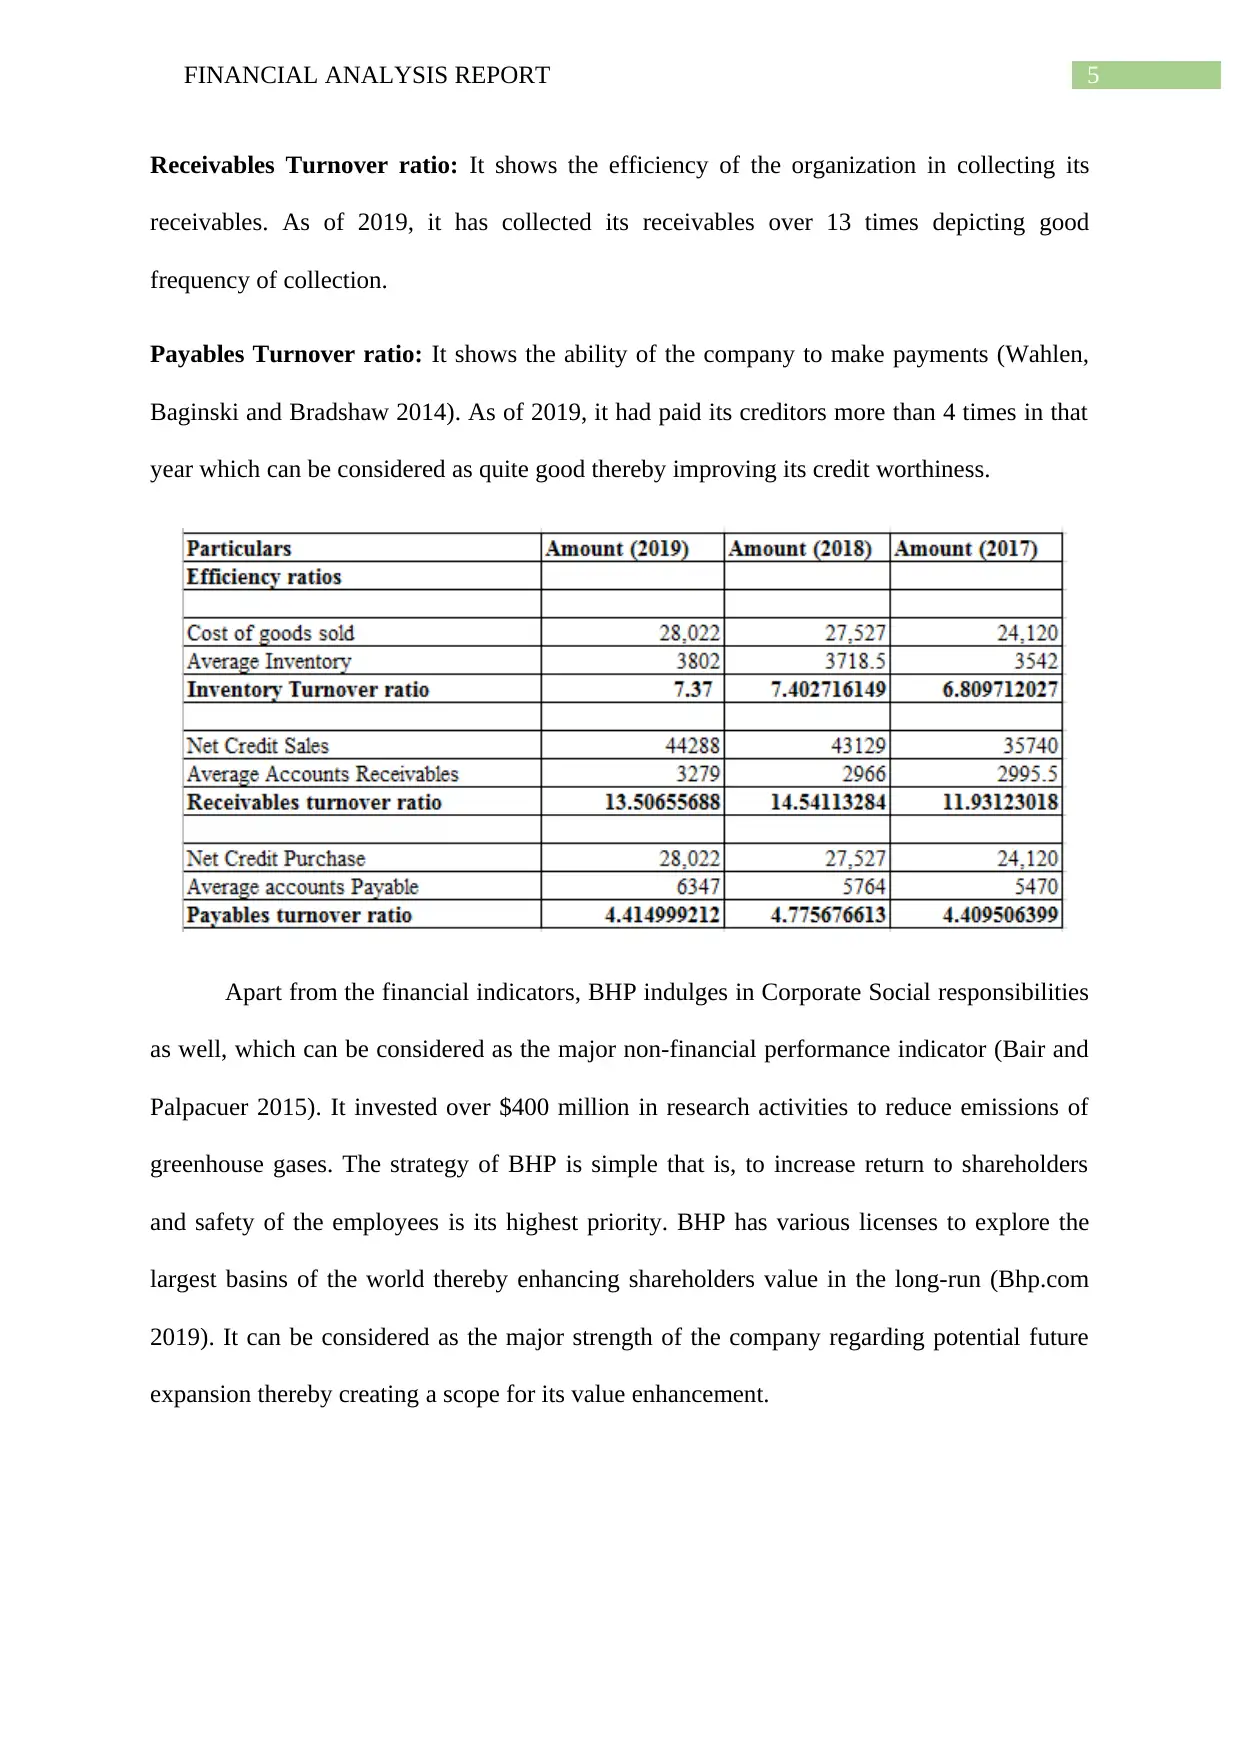
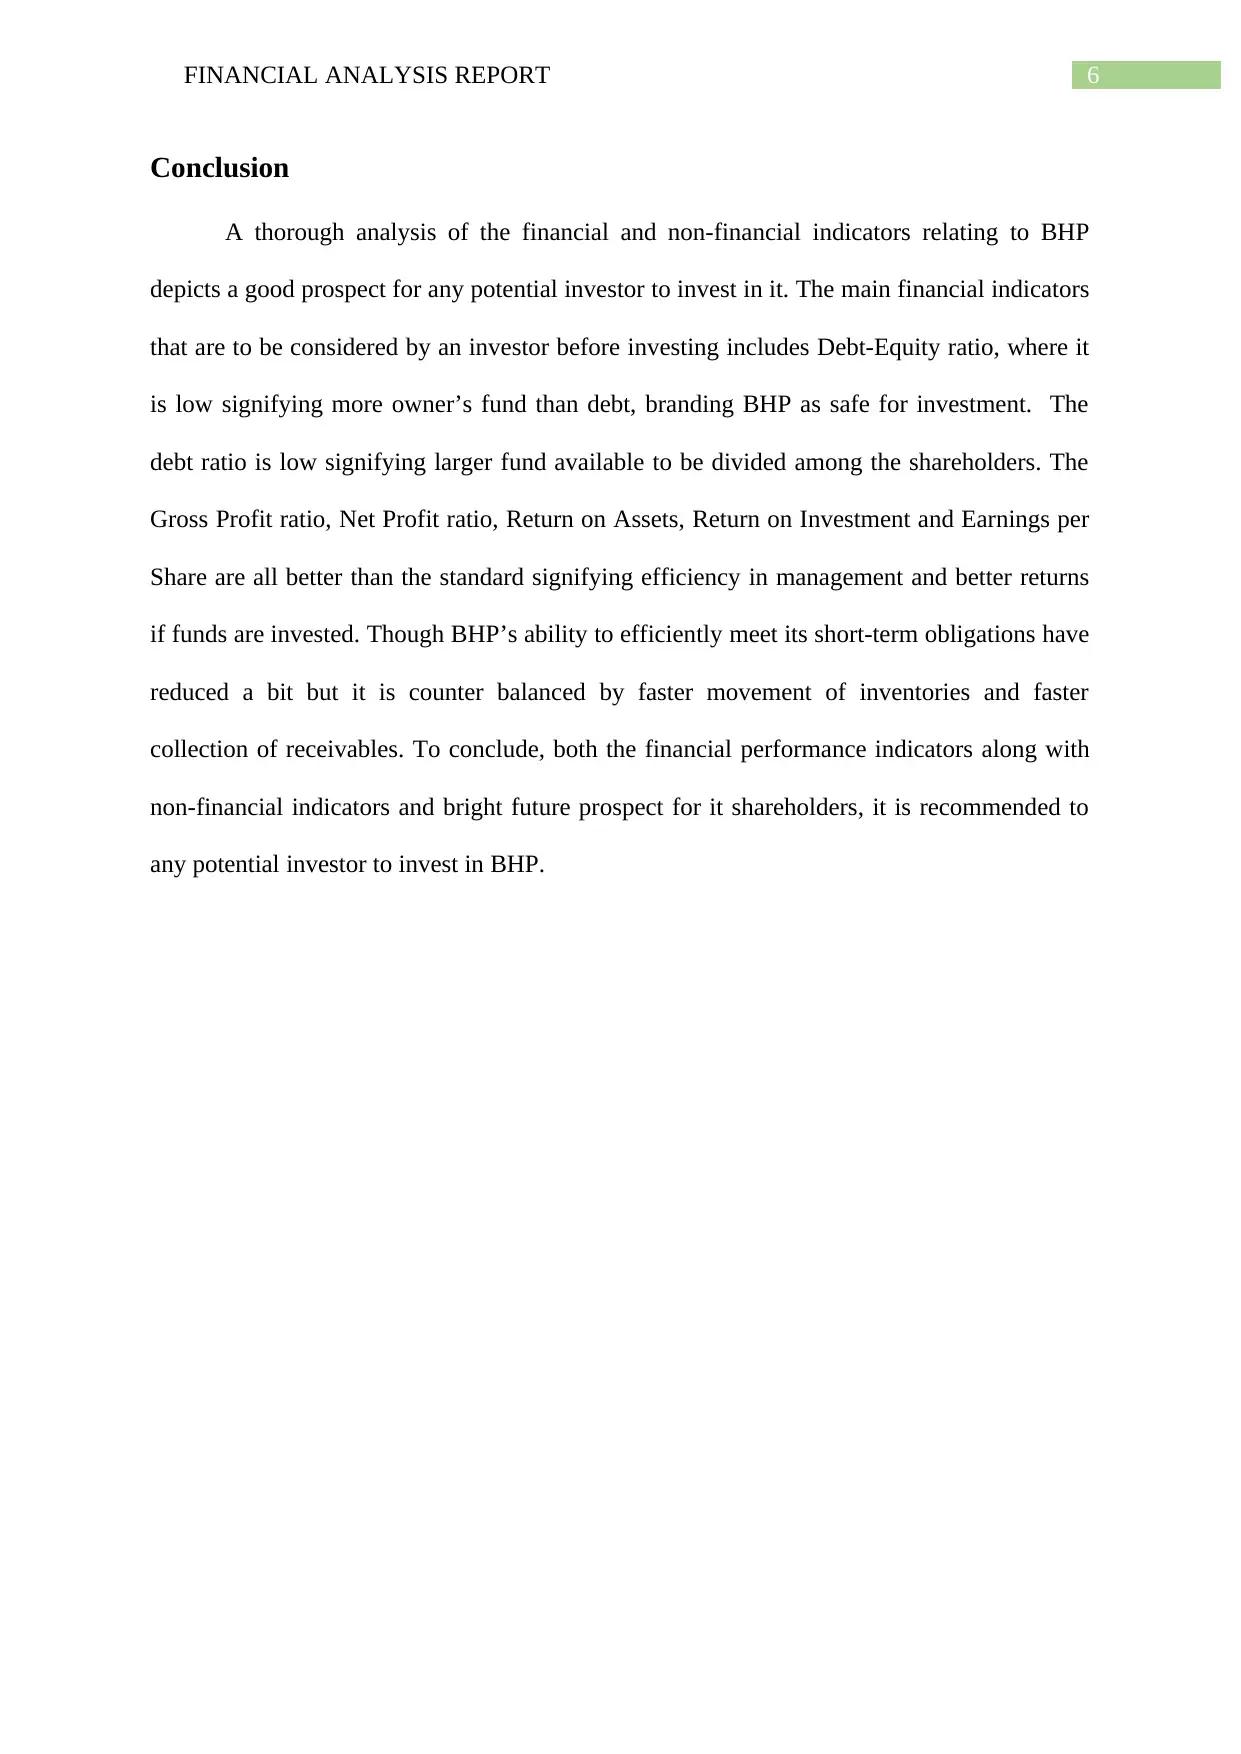
This financial analysis report examines the financial performance of BHP, an Anglo-Australian mining company. The report delves into key financial indicators, including gross profit ratio, net profit ratio, return on assets, return on investment, earnings per share, current ratio, quick ratio, debt-equity ratio, debt ratio, inventory turnover ratio, receivables turnover ratio, and payables turnover ratio. The analysis reveals insights into BHP's profitability, efficiency, solvency, and ability to meet short-term obligations. The report highlights positive trends in profitability and efficient management, while also addressing areas like short-term liabilities. Corporate social responsibility initiatives are also acknowledged. Based on the analysis, the report concludes with a recommendation for potential investors to consider investing in BHP, emphasizing the company's strong financial and non-financial performance and future prospects.
Document Page
Running head: FINANCIAL ANALYSIS REPORT
FINANCIAL ANALYSIS REPORT
Name of the student
Name of the University
Author Note
tabler-icon-diamond-filled.svg

Paraphrase This Document

Need a fresh take? Get an instant paraphrase of this document with our AI Paraphraser
Document Page
1FINANCIAL ANALYSIS REPORT
Executive summary
BHP is an Anglo-Australian mining company that deals with metals and petroleum as well. It
has it headquarter situated in Melbourne, Victoria and has dual-listing. Based on market
capitalization, it is the world’s biggest mining firm and third biggest company from Australia
by revenue. The formation of BHP dates way back in 2001, resulting out of a merger between
BHP and Anglo-Dutch Billiton Plc. BHP primarily deals in mining activities relating to coal,
petroleum, iron ore and copper and has operations spread in Australia, Trinidad and Tobago,
Algeria, U.S and the U.K (Bhp.com 2019). The Financial analysis report aims at
interpretation of the financial statements of BHP and thereby making available such
information to the external investors in order to assist them in taking prudent investment
decisions.
Analysis and Interpretation
The key financial indicators and their implications are as follows:
Gross Profit ratio: It is a profitability ratio which is a key indicator of efficiency in
manufacturing. It is the aggregate gain in profit without deduction of the fixed costs of
operations (Evans and Mathur 2014). It is calculated by dividing the Gross Profit by Net
Sales. The Gross Profit Ratio of BHP in 2019 is 36.73% and showed a slight increase from
the previous two years indicating a better management of cost of sales as compared to last
two years.
Net Profit ratio: It is the financial indicator of the all-inclusive profitability of the company
depicting the effectiveness and efficiency of the management in managing the expenses
(Hawaldar, Lokesh and Biso 2016). It is the ratio of Net Profit to Net Sales calculated by
dividing Net Profit by Net Sales. The financial analysis shows that the Net Profit ratio has
Document Page
2FINANCIAL ANALYSIS REPORT
increased in the recent year as compared to the previous year’s depicting efficiency in
management.
Return on Assets: Return on Assets shows the efficacy of the organization in utilizing its
assets. A higher return on assets shows efficacy of management and vice-versa. The analysis
shows a 9.11% ROA and any increase in ROA above 5% are considered good. The ROA in
2019 is better than the previous two years depicting the increase in efficiency of
management.
Return on Investment: It shows the relationship between the Net Income and the Owner’s
Equity depicting the efficient utilization of available equity investment (Islam 2014). On an
average, 10% to 14% ROI is needed by an organization so that future investments could be
funded with ease. In 2019, the ROI is 17.72% which can be considered as a good return and it
also showed a considerable increase in comparison with the previous years.
Earnings per share: It is the organization’s profit divided to each shareholders. It is
calculated by dividing the Net income by the number of shares outstanding. The earnings per
share in 2019 is positive and have considerably increased as compared to the last years
depicting a rise in net income.
Document Page
3FINANCIAL ANALYSIS REPORT
Current ratio: It signifies the capability of the company to pay-off its short-term obligations
(Myšková and Hájek 2017). The financial results of 2019 shows that the current ratio is 1.89
which has decreased than last year’s value of 2.51 and is less than the standard 2:1 signifying
increase in short-term liabilities than short-term assets available to meet the liabilities.
Quick ratio: It can be considered as more precise measurement of the capability of the firm
to pay-off its short-term obligations where a standard ratio is considered as 1:1. Here the
calculated quick ratio is more than 1:1 for 2019 signifying the company’s high cash holding
or improper collection of receivables.
tabler-icon-diamond-filled.svg

Paraphrase This Document

Need a fresh take? Get an instant paraphrase of this document with our AI Paraphraser
Document Page
4FINANCIAL ANALYSIS REPORT
Debt-Equity ratio: It shows the relationship between the debts and owner’s capital (Nollet,
Filis and Mitrokostas 2016). The standard ratio can be considered as 50%. The financial
result of 2019, shows the debt-equity ratio to be 17.78% and has reduced in the recent years
branding BHP as a safer company with higher owner’s fund than debt.
Debt ratio: It is the comparison of the assets with the debts (Rashid 2018). The standard debt
ratio mostly ranges from 30% to 60% and the calculated debt ratio of 2019 is 9.14% which
signifies that majority of the assets are not purchased with the debt capital and the
investments can be considered safe.
Inventory Turnover ratio: It is the relationship between the cost of goods sold and the
average inventory (Rodrigues and Rodrigues 2018). The current inventory turnover ratio is
7.37 which is higher than the standard 6, signifying faster movement of inventories.
Document Page
5FINANCIAL ANALYSIS REPORT
Receivables Turnover ratio: It shows the efficiency of the organization in collecting its
receivables. As of 2019, it has collected its receivables over 13 times depicting good
frequency of collection.
Payables Turnover ratio: It shows the ability of the company to make payments (Wahlen,
Baginski and Bradshaw 2014). As of 2019, it had paid its creditors more than 4 times in that
year which can be considered as quite good thereby improving its credit worthiness.
Apart from the financial indicators, BHP indulges in Corporate Social responsibilities
as well, which can be considered as the major non-financial performance indicator (Bair and
Palpacuer 2015). It invested over $400 million in research activities to reduce emissions of
greenhouse gases. The strategy of BHP is simple that is, to increase return to shareholders
and safety of the employees is its highest priority. BHP has various licenses to explore the
largest basins of the world thereby enhancing shareholders value in the long-run (Bhp.com
2019). It can be considered as the major strength of the company regarding potential future
expansion thereby creating a scope for its value enhancement.
Document Page
6FINANCIAL ANALYSIS REPORT
Conclusion
A thorough analysis of the financial and non-financial indicators relating to BHP
depicts a good prospect for any potential investor to invest in it. The main financial indicators
that are to be considered by an investor before investing includes Debt-Equity ratio, where it
is low signifying more owner’s fund than debt, branding BHP as safe for investment. The
debt ratio is low signifying larger fund available to be divided among the shareholders. The
Gross Profit ratio, Net Profit ratio, Return on Assets, Return on Investment and Earnings per
Share are all better than the standard signifying efficiency in management and better returns
if funds are invested. Though BHP’s ability to efficiently meet its short-term obligations have
reduced a bit but it is counter balanced by faster movement of inventories and faster
collection of receivables. To conclude, both the financial performance indicators along with
non-financial indicators and bright future prospect for it shareholders, it is recommended to
any potential investor to invest in BHP.
tabler-icon-diamond-filled.svg

Paraphrase This Document

Need a fresh take? Get an instant paraphrase of this document with our AI Paraphraser
Document Page
7FINANCIAL ANALYSIS REPORT
References
Bair, J. and Palpacuer, F., 2015. CSR beyond the corporation: contested governance in global
value chains. Global Networks, 15(s1), pp.S1-S19.
Bhp.com (2019). Annual Report 2019. [ebook] BHP. Available at:
https://www.bhp.com/-/media/documents/investors/annual-reports/2019/
bhpannualreport2019.pdf [Accessed 9 Feb. 2020].
Evans, J.R. and Mathur, A., 2014. Retailing and the period leading up to the Great Recession:
a model and a 25-year financial ratio analysis of US retailing. The International Review of
Retail, Distribution and Consumer Research, 24(1), pp.30-58.
Hawaldar, I.T., Lokesh, L. and Biso, S.S., 2016. An empirical analysis of financial
performance of retail and wholesale Islamic banks in Bahrain. American Scientific Research
Journal for Engineering, Technology, and Sciences (ASRJETS), 20(1), pp.137-147.
Islam, M.A., 2014. An analysis of the financial performance of national bank limited using
financial ratio. Journal of Behavioural Economics, Finance, Entrepreneurship, Accounting
and Transport, 2(5), pp.121-129.
Myšková, R. and Hájek, P., 2017. Comprehensive assessment of firm financial performance
using financial ratios and linguistic analysis of annual reports. Journal of International
Studies, volume 10, issue: 4.
Nollet, J., Filis, G. and Mitrokostas, E., 2016. Corporate social responsibility and financial
performance: A non-linear and disaggregated approach. Economic Modelling, 52, pp.400-
407.
Rashid, C.A., 2018. Efficiency of Financial Ratios Analysis for Evaluating Companies’
Liquidity. International Journal of Social Sciences & Educational Studies, 4(4), pp.110-123.
Document Page
8FINANCIAL ANALYSIS REPORT
Rodrigues, L. and Rodrigues, L., 2018. Economic-financial performance of the Brazilian
sugarcane energy industry: An empirical evaluation using financial ratio, cluster and
discriminant analysis. Biomass and bioenergy, 108, pp.289-296.
Wahlen, J.M., Baginski, S.P. and Bradshaw, M., 2014. Financial reporting, financial
statement analysis and valuation. Nelson Education.
chevron_up_icon
1 out of 9
circle_padding
hide_on_mobile
zoom_out_icon
[object Object]