8006FMGT - BHP Group Financial Report: Ratio, CCC & Funding
VerifiedAdded on 2022/10/18
|14
|2892
|10
Report
AI Summary
This report provides a financial analysis of BHP Group, focusing on capital structure and profitability ratios over five years. The analysis reveals a deterioration in capital structure ratios due to increased debt and a decline in profitability ratios reflecting weaker business performance. Compared to competitor RIO TINTO, BHP's financial ratios appear weaker. The cash conversion cycle (CCC) improved from 9.32 days to -18.59 days, driven by increased payable days, generally viewed positively. Furthermore, the report explores debt and equity funding options, favoring low-cost debt financing based on BHP's current capital structure, and analyzes the impact of rumors on bond prices and ordinary share value using the Gordon Growth Model.

Running Head: Finance Management
8006FMGT – Finance Management
NAME
STUDENT ID
TITLE OF REPORT
8006FMGT – Finance Management
NAME
STUDENT ID
TITLE OF REPORT
Paraphrase This Document
Need a fresh take? Get an instant paraphrase of this document with our AI Paraphraser
Finance Management
Executive summary
This report performed the financial analysis of BHP Group. The ratio analysis is done using
the capital structure and profitability ratios for the last five years. All the major capital
structure ratios have deteriorated as the debt portion of the balance sheet has increased
over this period. Also the profitability ratios have deteriorated as the company’s business
performance went down. In comparison to its competitor RIO TINTO, the financial ratios of
BHP were weaker. The report also performed the calculation of the cash conversion cycle of
BHP and it found that the CCC has declined from 9.32 days to -18.59 days due to the
increase in days of payables. This is generally taken as a positive for the firm. The document
also performed analysis of debt and equity funding and it found that the low cost debt
financing is preferable for BHP depending upon the current capital structure.
Page 2
Finance Management
Table of Contents
Executive summary............................................................................................................... 2
1. Introduction................................................................................................................... 4
2. Financial Ratio Analysis.................................................................................................5
2.1 Capital Structure Ratios Analysis............................................................................ 6
2.2 Profitability Ratios Analysis.................................................................................... 6
2.3 Areas for improvement for BHP and appropriate actions......................................7
2.4 BHP comparison with RIO TINTO............................................................................7
3. Cash conversion cycle of BHP........................................................................................9
4. Analysis of debt and equity funding............................................................................ 10
4.1 Price of the bond before and after the rumour and the expected change in the
price of the bond............................................................................................................. 10
4.2 Value of the ordinary share..................................................................................11
4.3 Relationship between the coupon interest rate and yield to maturity and the
market value of a bond...................................................................................................11
4.4 Funding decision between equity and debt on the basis of BHP’s current capital
structure......................................................................................................................... 12
5. Conclusion................................................................................................................... 13
References.......................................................................................................................... 14
Page 3
⊘ This is a preview!⊘
Do you want full access?
Subscribe today to unlock all pages.
Trusted by 1+ million students worldwide
Finance Management
1. Introduction
The report performs the financial analysis of BHP, a global resources company based in
Australia. To perform the ratio analysis it uses profitability and capital structure ratios like
net profit margin, return on assets, return on equity, debt to equity ratio, debt ratio, equity
ratio and debt coverage ratio. Trend analysis of these ratios is used to determine the
deterioration or strengthening of BHP’s business. These ratios are also compared with its
competitor RIO TINTO. Then the cash conversion cycle of BHP is analysed over last five years
to check if there is any change in it. Then the report analyses the different kind of funding
available to the firm. The price of the bond is measured before and after the change in YTM
due to the rumour. The value of ordinary share is also determined using Gordon growth
model. Then the current capital structure of BHP is analysed to decide between the debt
and equity funding.
Page 4
Paraphrase This Document
Need a fresh take? Get an instant paraphrase of this document with our AI Paraphraser
Finance Management
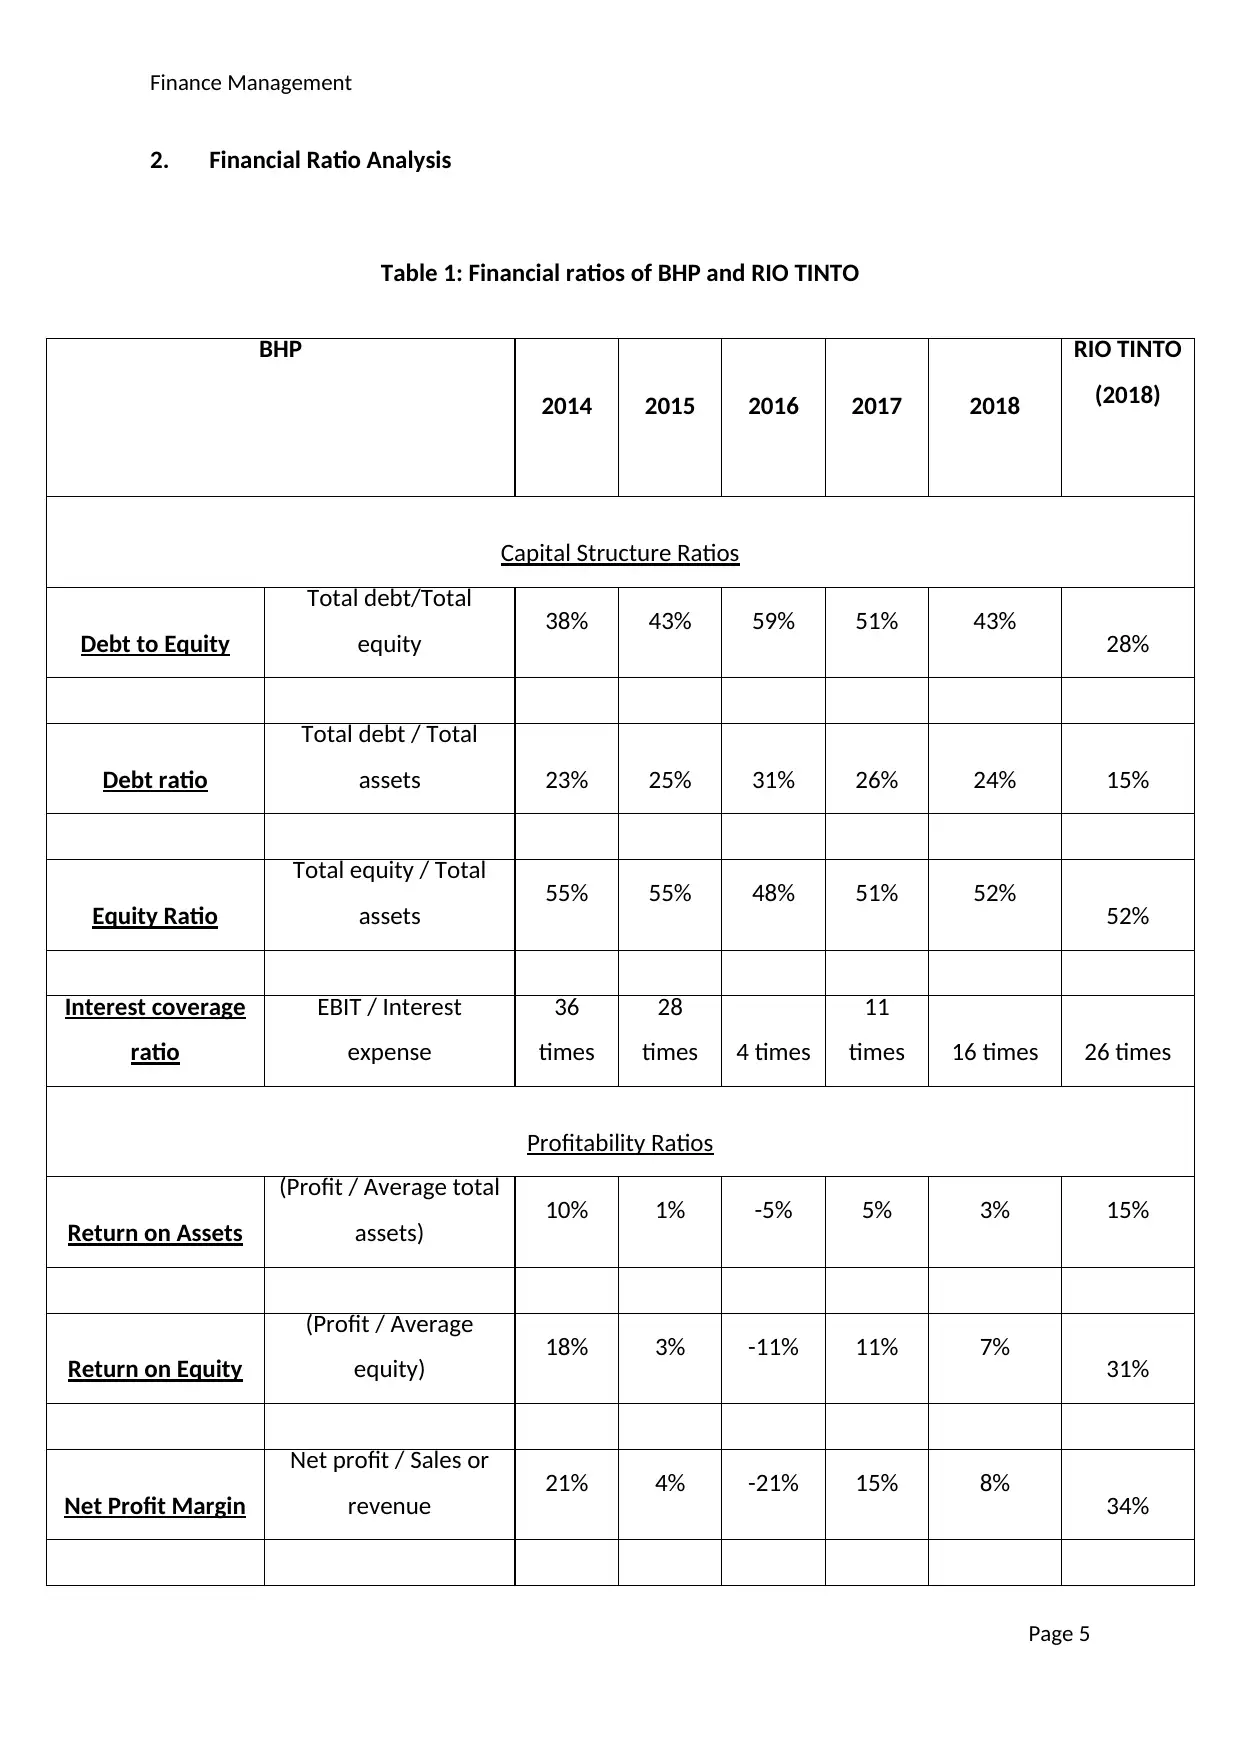
2. Financial Ratio Analysis
Table 1: Financial ratios of BHP and RIO TINTO
Page 5
BHP
2014 2015 2016 2017 2018
RIO TINTO
(2018)
Capital Structure Ratios
Debt to Equity
Total debt/Total
equity 38% 43% 59% 51% 43% 28%
Debt ratio
Total debt / Total
assets 23% 25% 31% 26% 24% 15%
Equity Ratio
Total equity / Total
assets 55% 55% 48% 51% 52% 52%
Interest coverage
ratio
EBIT / Interest
expense
36
times
28
times 4 times
11
times 16 times 26 times
Profitability Ratios
Return on Assets
(Profit / Average total
assets) 10% 1% -5% 5% 3% 15%
Return on Equity
(Profit / Average
equity) 18% 3% -11% 11% 7% 31%
Net Profit Margin
Net profit / Sales or
revenue 21% 4% -21% 15% 8% 34%
Finance Management
Source: Morningstar, (n.d.).
2.1 Capital Structure Ratios Analysis
The trend analysis of various capital structure ratios shows that BHP condition has
deteriorated a little in terms of capital structure. Debt to equity ratio tells about the overall
capital structure of the firm that is debt in proportion to the equity (Atrill and McLaney,
2019). BHP's debt to equity ratio has increased from 38% in 2014 to 43% in 2018. BHP
maybe using debt for making the capital investments for its business expansion as it is a
cheap source of funds but the raising value of debt in the capital structure can put
additional pressure on the firm's performance particularly in bad times. Debt ratio increased
in this time period but this increase was little as the asset base of the firm has also been
expanding. The equity ratio of BHP has decreased from 55% in 2014 to 52% in 2018 as the
firm might have been using debt financing for its capital investments. This decreases the
firm's ownership of these assets and can create financial problems. The interest coverage
ratio of BHP has declined drastically from 36 times in 2014 to 16 times in 2018. This ratio
measures the ability of the firm to meet its interest obligations using its operating income.
The declining interest coverage ratio can create major issues for BHP as it may find it
difficult to pay interest obligations from its core business operations, which can make the
company insolvent.
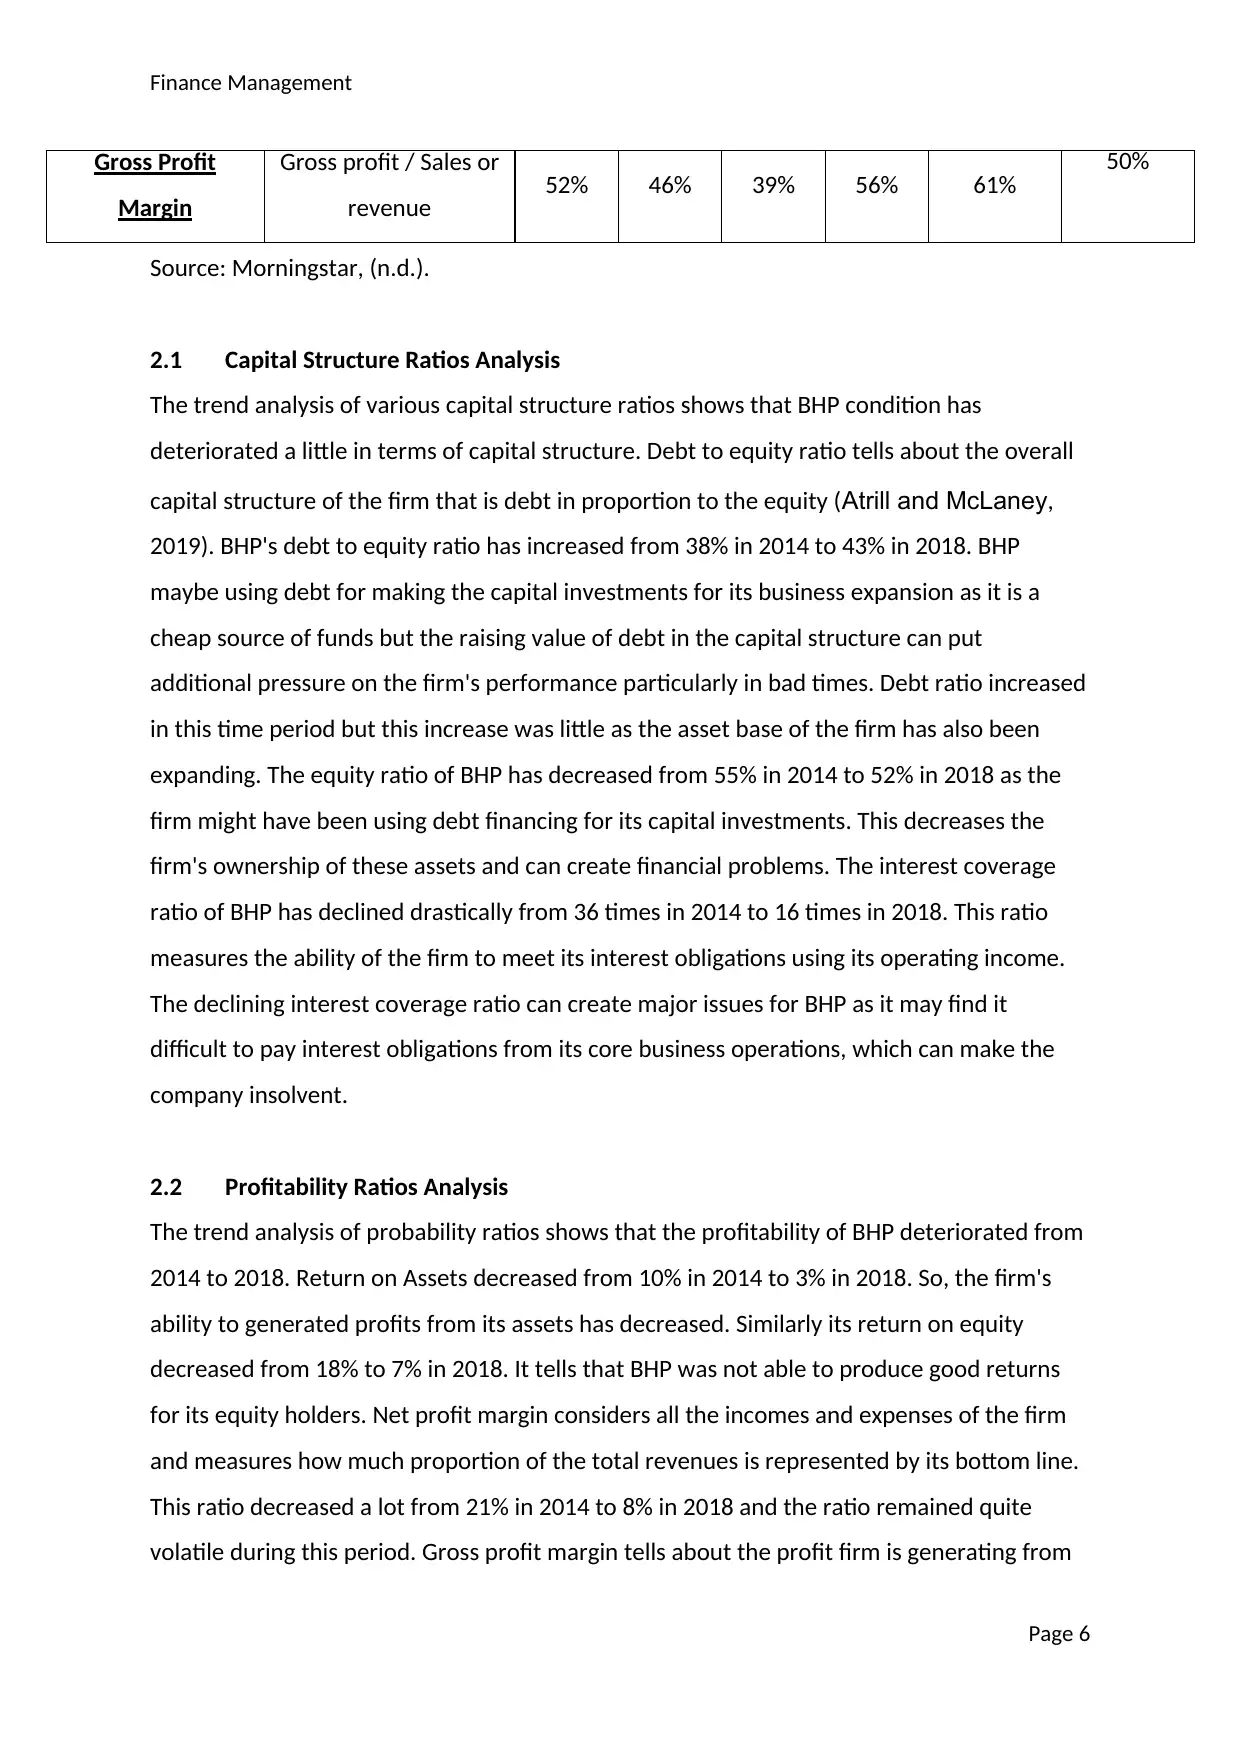
2.2 Profitability Ratios Analysis
The trend analysis of probability ratios shows that the profitability of BHP deteriorated from
2014 to 2018. Return on Assets decreased from 10% in 2014 to 3% in 2018. So, the firm's
ability to generated profits from its assets has decreased. Similarly its return on equity
decreased from 18% to 7% in 2018. It tells that BHP was not able to produce good returns
for its equity holders. Net profit margin considers all the incomes and expenses of the firm
and measures how much proportion of the total revenues is represented by its bottom line.
This ratio decreased a lot from 21% in 2014 to 8% in 2018 and the ratio remained quite
volatile during this period. Gross profit margin tells about the profit firm is generating from
Page 6
Gross Profit
Margin
Gross profit / Sales or
revenue 52% 46% 39% 56% 61% 50%
Source: Morningstar, (n.d.).
2.1 Capital Structure Ratios Analysis
The trend analysis of various capital structure ratios shows that BHP condition has
deteriorated a little in terms of capital structure. Debt to equity ratio tells about the overall
capital structure of the firm that is debt in proportion to the equity (Atrill and McLaney,
2019). BHP's debt to equity ratio has increased from 38% in 2014 to 43% in 2018. BHP
maybe using debt for making the capital investments for its business expansion as it is a
cheap source of funds but the raising value of debt in the capital structure can put
additional pressure on the firm's performance particularly in bad times. Debt ratio increased
in this time period but this increase was little as the asset base of the firm has also been
expanding. The equity ratio of BHP has decreased from 55% in 2014 to 52% in 2018 as the
firm might have been using debt financing for its capital investments. This decreases the
firm's ownership of these assets and can create financial problems. The interest coverage
ratio of BHP has declined drastically from 36 times in 2014 to 16 times in 2018. This ratio
measures the ability of the firm to meet its interest obligations using its operating income.
The declining interest coverage ratio can create major issues for BHP as it may find it
difficult to pay interest obligations from its core business operations, which can make the
company insolvent.
2.2 Profitability Ratios Analysis
The trend analysis of probability ratios shows that the profitability of BHP deteriorated from
2014 to 2018. Return on Assets decreased from 10% in 2014 to 3% in 2018. So, the firm's
ability to generated profits from its assets has decreased. Similarly its return on equity
decreased from 18% to 7% in 2018. It tells that BHP was not able to produce good returns
for its equity holders. Net profit margin considers all the incomes and expenses of the firm
and measures how much proportion of the total revenues is represented by its bottom line.
This ratio decreased a lot from 21% in 2014 to 8% in 2018 and the ratio remained quite
volatile during this period. Gross profit margin tells about the profit firm is generating from
Page 6
Gross Profit
Margin
Gross profit / Sales or
revenue 52% 46% 39% 56% 61% 50%
⊘ This is a preview!⊘
Do you want full access?
Subscribe today to unlock all pages.
Trusted by 1+ million students worldwide
Finance Management
its core business operations. It only considers the direct costs related to the revenues so it is
not affected by the other operating and non-operating activities. This ratio actually
improved over this period which shows that the firm's core operations have been
improving. It can be noticed from the overall trend analysis of profitability ratios that the
firm's core operations have improved but the net profits deteriorated. This can be because
of some short term non-operating costs arising because of losses on discontinued
operations.
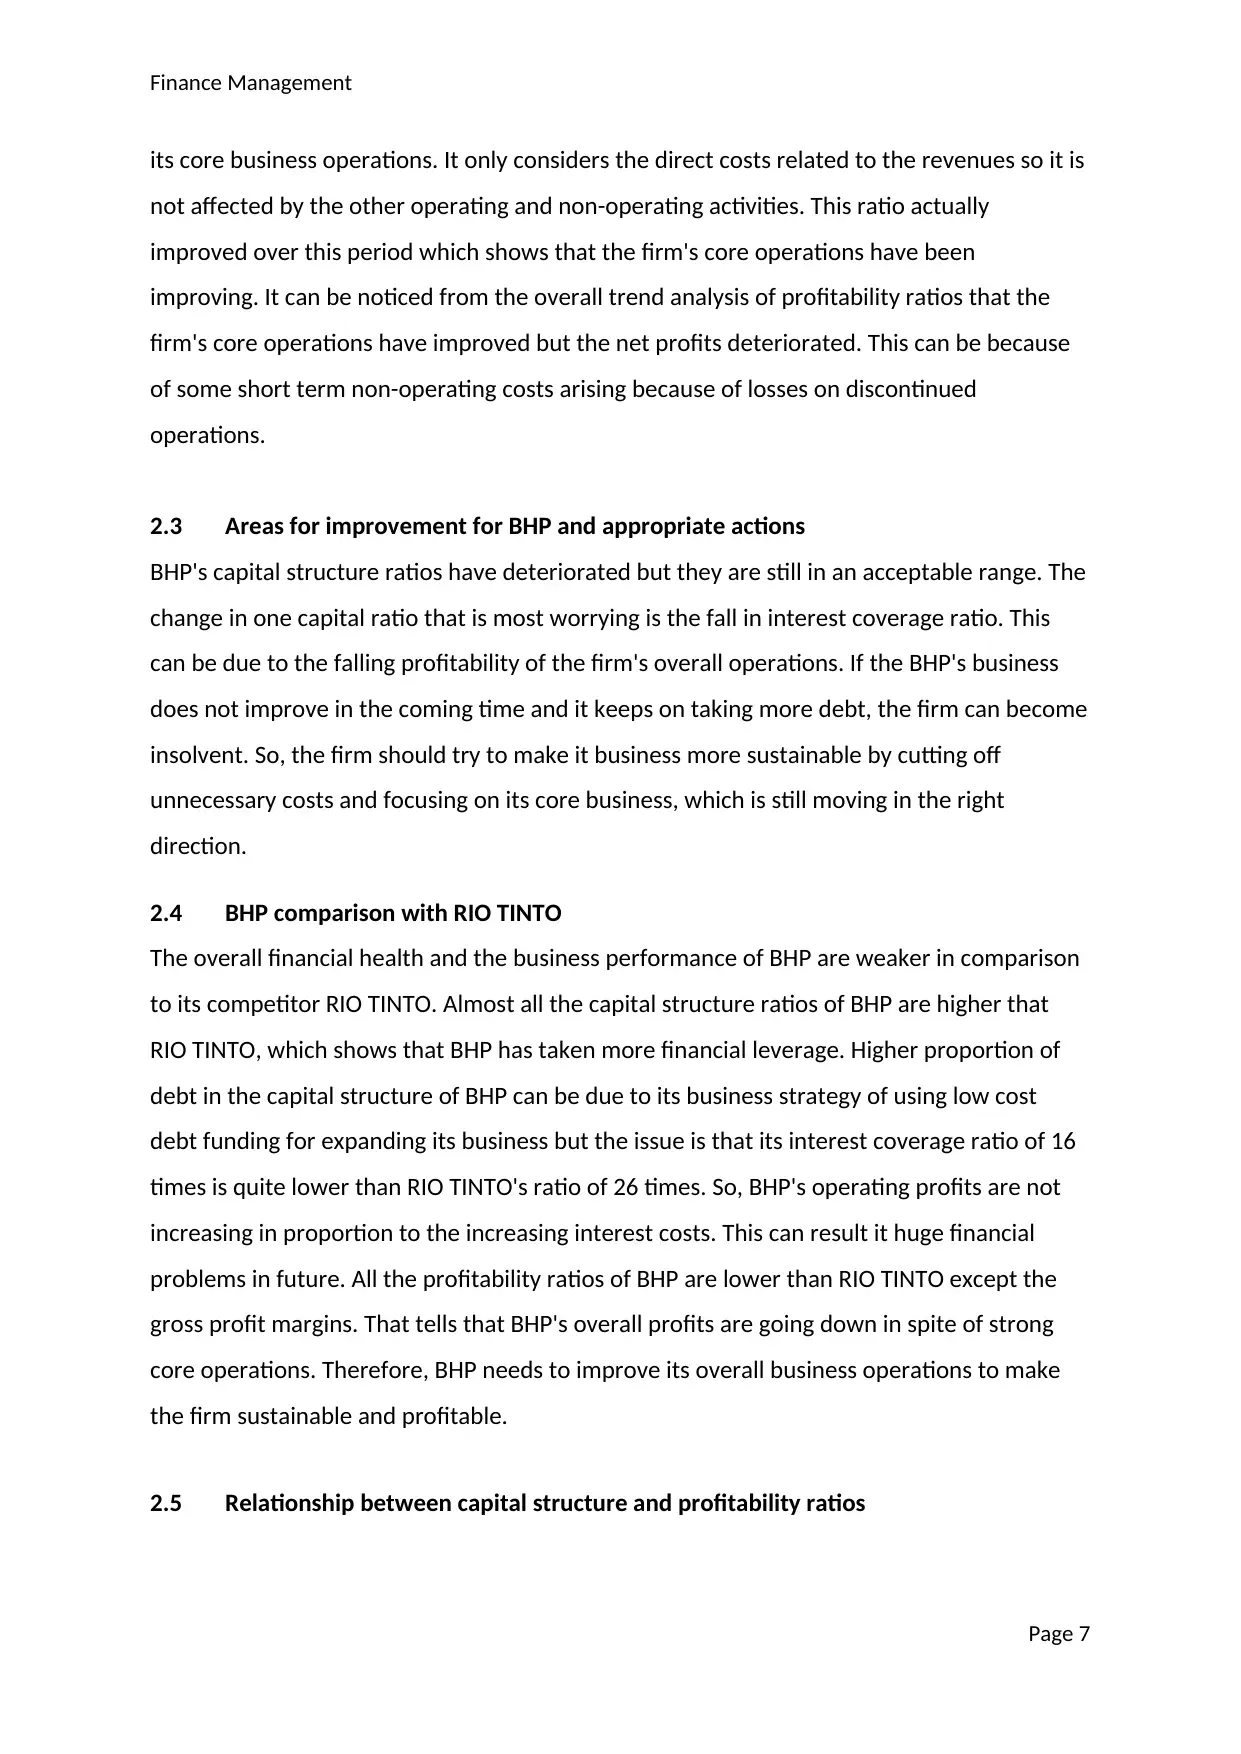
2.3 Areas for improvement for BHP and appropriate actions
BHP's capital structure ratios have deteriorated but they are still in an acceptable range. The
change in one capital ratio that is most worrying is the fall in interest coverage ratio. This
can be due to the falling profitability of the firm's overall operations. If the BHP's business
does not improve in the coming time and it keeps on taking more debt, the firm can become
insolvent. So, the firm should try to make it business more sustainable by cutting off
unnecessary costs and focusing on its core business, which is still moving in the right
direction.
2.4 BHP comparison with RIO TINTO
The overall financial health and the business performance of BHP are weaker in comparison
to its competitor RIO TINTO. Almost all the capital structure ratios of BHP are higher that
RIO TINTO, which shows that BHP has taken more financial leverage. Higher proportion of
debt in the capital structure of BHP can be due to its business strategy of using low cost
debt funding for expanding its business but the issue is that its interest coverage ratio of 16
times is quite lower than RIO TINTO's ratio of 26 times. So, BHP's operating profits are not
increasing in proportion to the increasing interest costs. This can result it huge financial
problems in future. All the profitability ratios of BHP are lower than RIO TINTO except the
gross profit margins. That tells that BHP's overall profits are going down in spite of strong
core operations. Therefore, BHP needs to improve its overall business operations to make
the firm sustainable and profitable.
2.5 Relationship between capital structure and profitability ratios
Page 7
its core business operations. It only considers the direct costs related to the revenues so it is
not affected by the other operating and non-operating activities. This ratio actually
improved over this period which shows that the firm's core operations have been
improving. It can be noticed from the overall trend analysis of profitability ratios that the
firm's core operations have improved but the net profits deteriorated. This can be because
of some short term non-operating costs arising because of losses on discontinued
operations.
2.3 Areas for improvement for BHP and appropriate actions
BHP's capital structure ratios have deteriorated but they are still in an acceptable range. The
change in one capital ratio that is most worrying is the fall in interest coverage ratio. This
can be due to the falling profitability of the firm's overall operations. If the BHP's business
does not improve in the coming time and it keeps on taking more debt, the firm can become
insolvent. So, the firm should try to make it business more sustainable by cutting off
unnecessary costs and focusing on its core business, which is still moving in the right
direction.
2.4 BHP comparison with RIO TINTO
The overall financial health and the business performance of BHP are weaker in comparison
to its competitor RIO TINTO. Almost all the capital structure ratios of BHP are higher that
RIO TINTO, which shows that BHP has taken more financial leverage. Higher proportion of
debt in the capital structure of BHP can be due to its business strategy of using low cost
debt funding for expanding its business but the issue is that its interest coverage ratio of 16
times is quite lower than RIO TINTO's ratio of 26 times. So, BHP's operating profits are not
increasing in proportion to the increasing interest costs. This can result it huge financial
problems in future. All the profitability ratios of BHP are lower than RIO TINTO except the
gross profit margins. That tells that BHP's overall profits are going down in spite of strong
core operations. Therefore, BHP needs to improve its overall business operations to make
the firm sustainable and profitable.
2.5 Relationship between capital structure and profitability ratios
Page 7
Paraphrase This Document
Need a fresh take? Get an instant paraphrase of this document with our AI Paraphraser
Finance Management
A negative relationship between the capital structure ratios and profitability ratios can be
identified from the trend analysis of these ratios. As the capital structure ratios increased
from 2014 to 2018 that means the proportion of debt increased during this period. This
provide the firm with the low cost debt capital for making capital investments but the firm
was not able to use these investments efficiently as the profitability ratios decreased. The
decrease in the profitability can also be due to the increase in fixed interest costs that
creates pressure on the firm. The financial risk of the firm increases with the increase in
debt because the firm needs to make fixed payments in spite of the business conditions. If
the return generated from these debt investments is not in line with the undertaken risk,
then the profitability of the firm will reduce.
3. Cash conversion cycle of BHP
Page 8
Finance Management
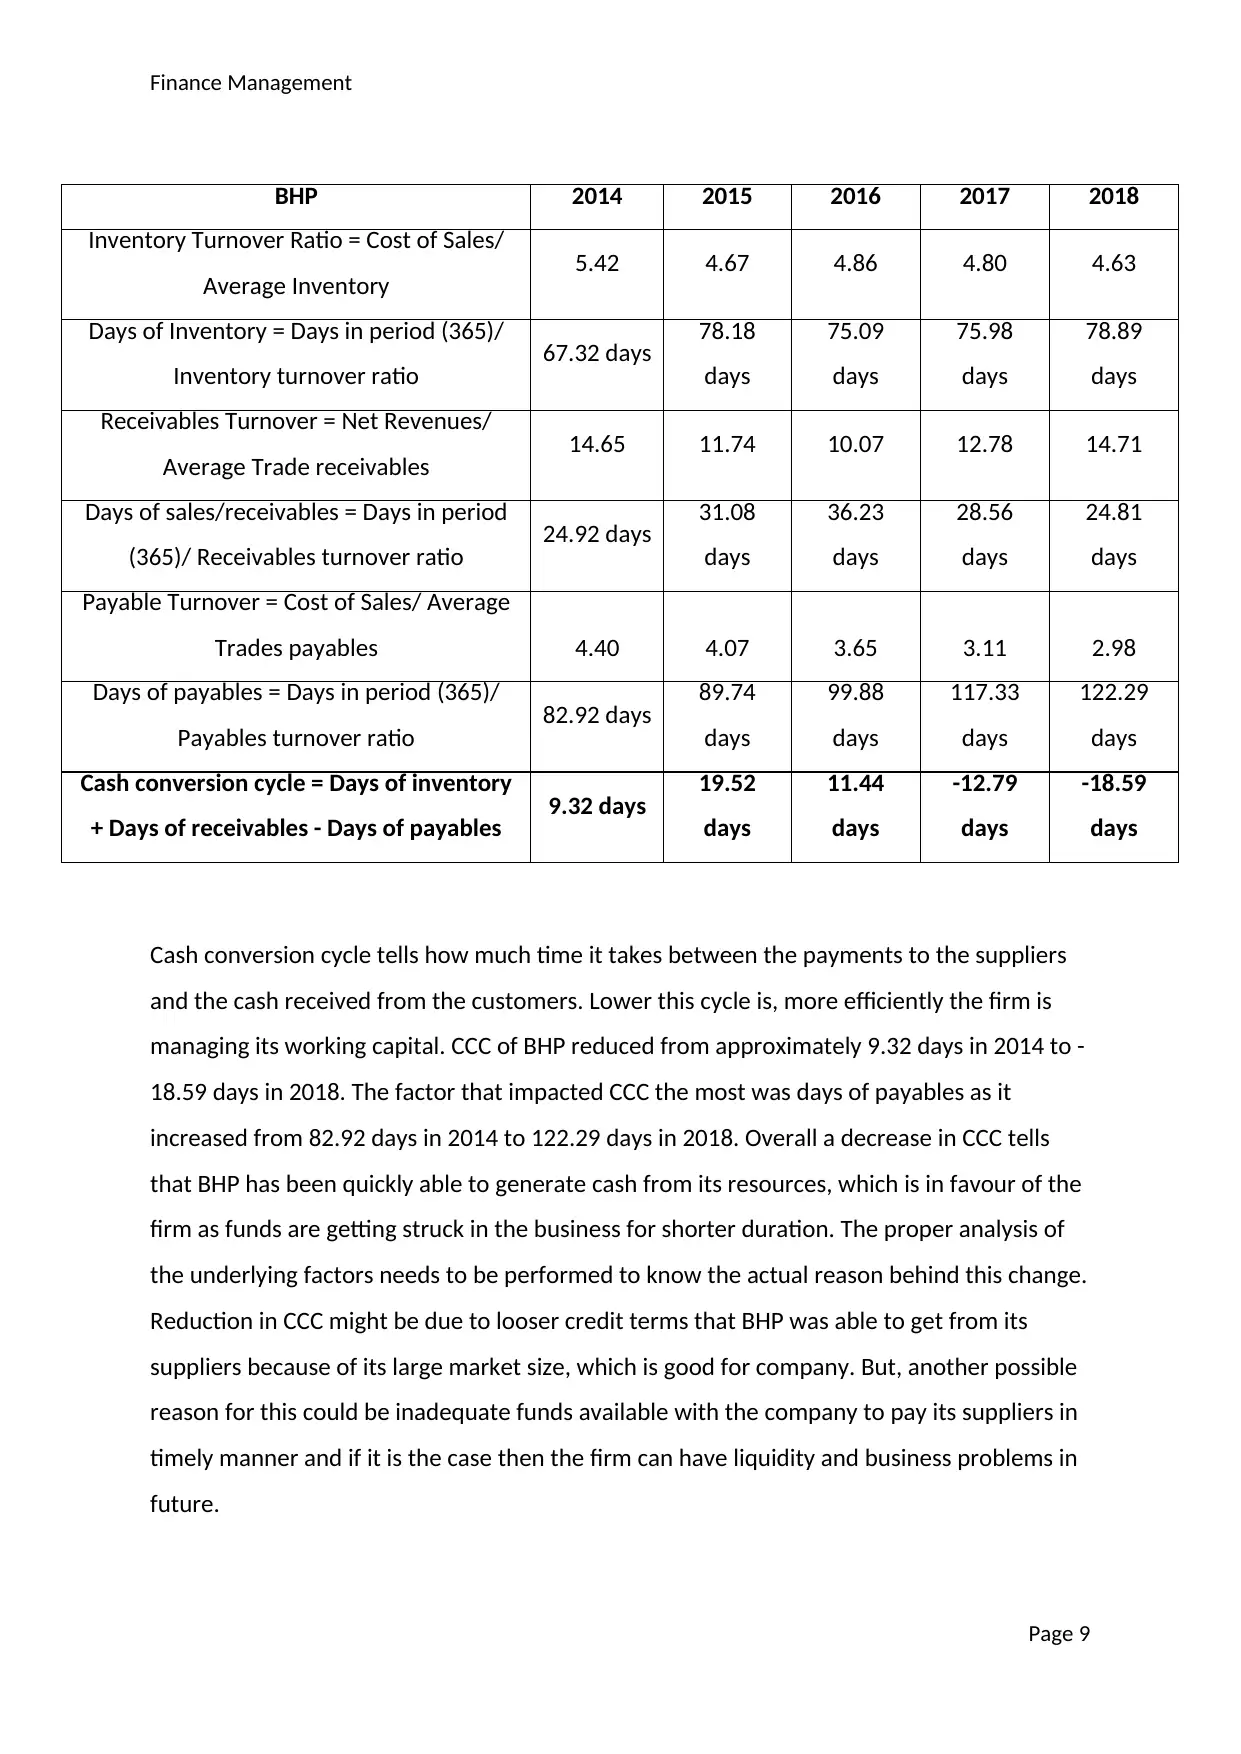
Cash conversion cycle tells how much time it takes between the payments to the suppliers
and the cash received from the customers. Lower this cycle is, more efficiently the firm is
managing its working capital. CCC of BHP reduced from approximately 9.32 days in 2014 to -
18.59 days in 2018. The factor that impacted CCC the most was days of payables as it
increased from 82.92 days in 2014 to 122.29 days in 2018. Overall a decrease in CCC tells
that BHP has been quickly able to generate cash from its resources, which is in favour of the
firm as funds are getting struck in the business for shorter duration. The proper analysis of
the underlying factors needs to be performed to know the actual reason behind this change.
Reduction in CCC might be due to looser credit terms that BHP was able to get from its
suppliers because of its large market size, which is good for company. But, another possible
reason for this could be inadequate funds available with the company to pay its suppliers in
timely manner and if it is the case then the firm can have liquidity and business problems in
future.
Page 9
BHP 2014 2015 2016 2017 2018
Inventory Turnover Ratio = Cost of Sales/
Average Inventory 5.42 4.67 4.86 4.80 4.63
Days of Inventory = Days in period (365)/
Inventory turnover ratio 67.32 days 78.18
days
75.09
days
75.98
days
78.89
days
Receivables Turnover = Net Revenues/
Average Trade receivables 14.65 11.74 10.07 12.78 14.71
Days of sales/receivables = Days in period
(365)/ Receivables turnover ratio 24.92 days 31.08
days
36.23
days
28.56
days
24.81
days
Payable Turnover = Cost of Sales/ Average
Trades payables 4.40 4.07 3.65 3.11 2.98
Days of payables = Days in period (365)/
Payables turnover ratio 82.92 days 89.74
days
99.88
days
117.33
days
122.29
days
Cash conversion cycle = Days of inventory
+ Days of receivables - Days of payables 9.32 days 19.52
days
11.44
days
-12.79
days
-18.59
days
⊘ This is a preview!⊘
Do you want full access?
Subscribe today to unlock all pages.
Trusted by 1+ million students worldwide
Finance Management
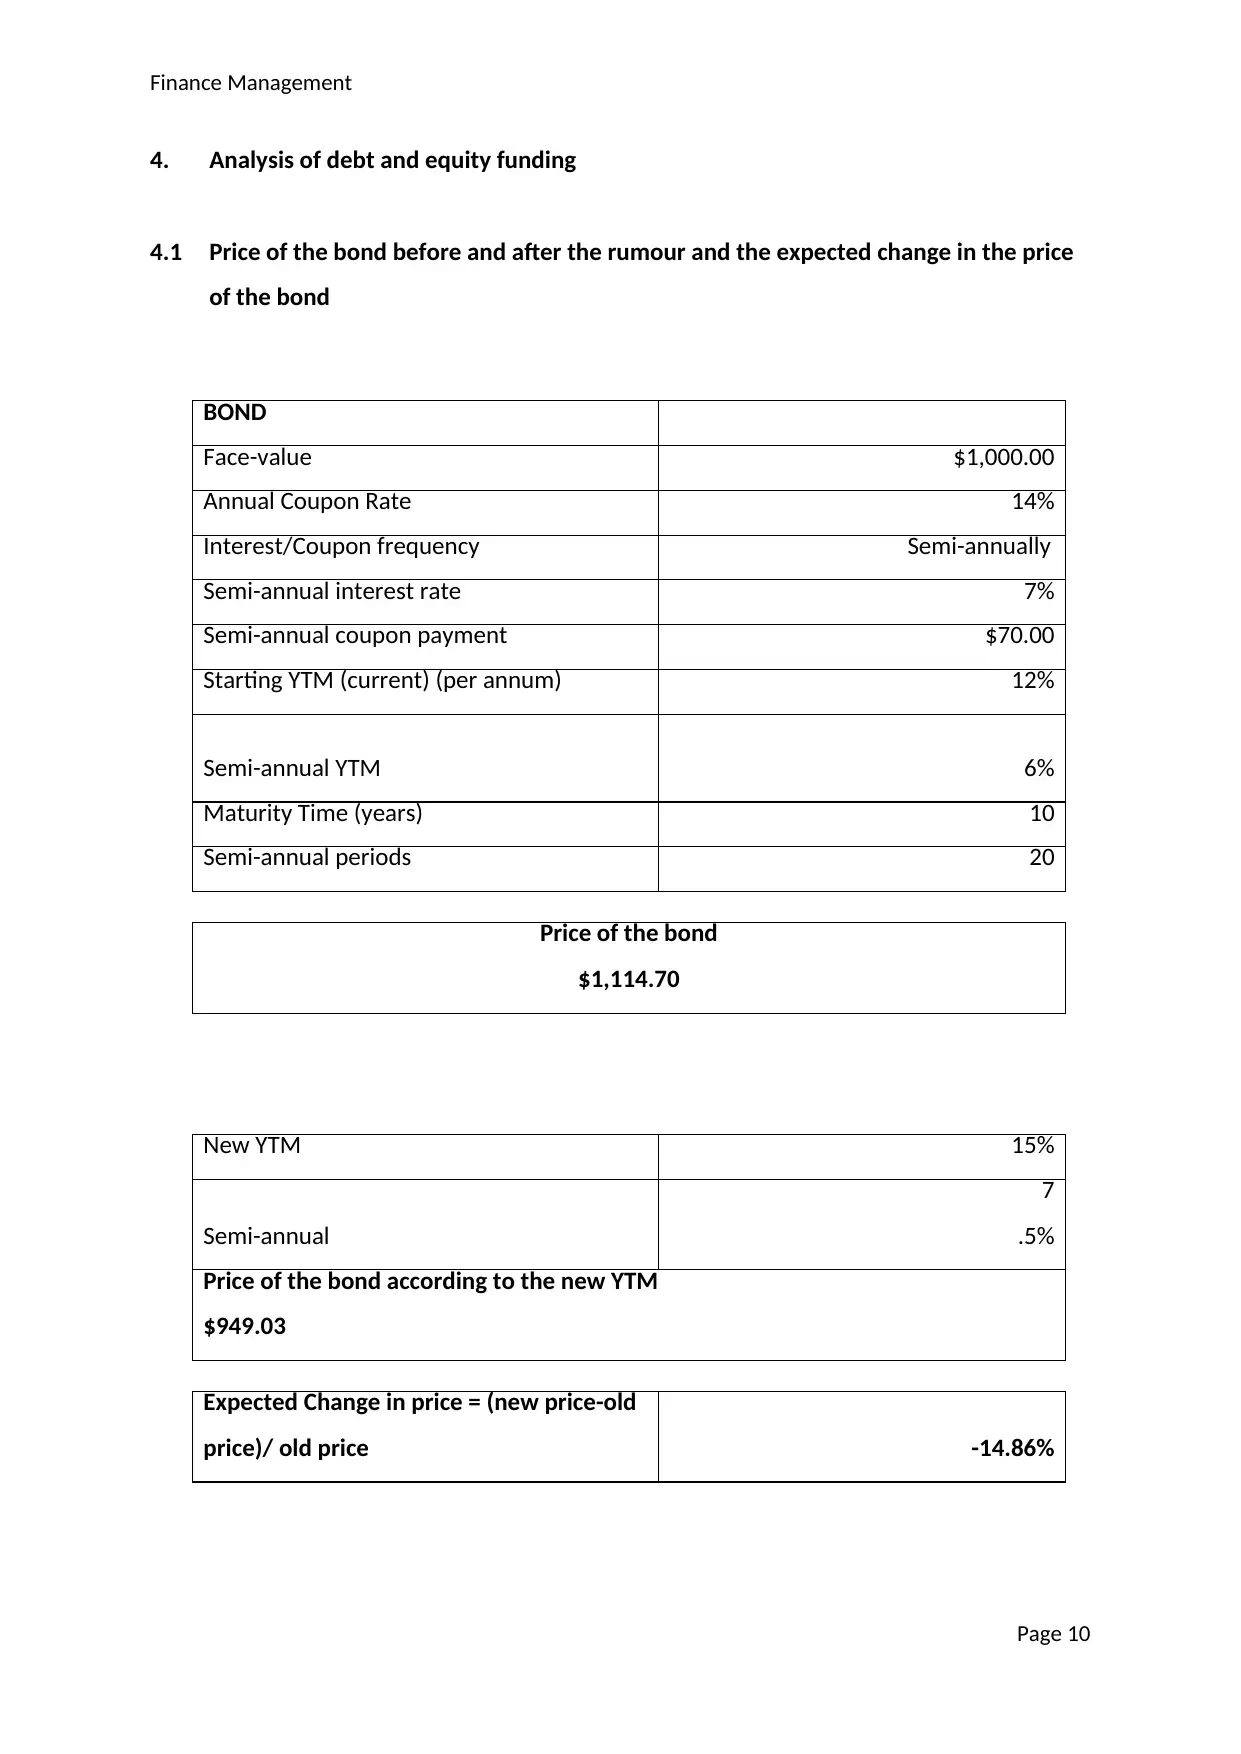
4. Analysis of debt and equity funding
4.1 Price of the bond before and after the rumour and the expected change in the price
of the bond
BOND
Face-value $1,000.00
Annual Coupon Rate 14%
Interest/Coupon frequency Semi-annually
Semi-annual interest rate 7%
Semi-annual coupon payment $70.00
Starting YTM (current) (per annum) 12%
Semi-annual YTM 6%
Maturity Time (years) 10
Semi-annual periods 20
Price of the bond
$1,114.70
New YTM 15%
Semi-annual
7
.5%
Price of the bond according to the new YTM
$949.03
Expected Change in price = (new price-old
price)/ old price -14.86%
Page 10
Paraphrase This Document
Need a fresh take? Get an instant paraphrase of this document with our AI Paraphraser
Finance Management
YTM increases after the rumour that the credit rating of the firm will decrease because the
future cash-flows will appear more risky in the present term. So, the investors now need
higher return for taking this increased risk. This will result in the decrease in the bond price
by 14.86% because the future payments from the bond will now be discounted at higher
rate.
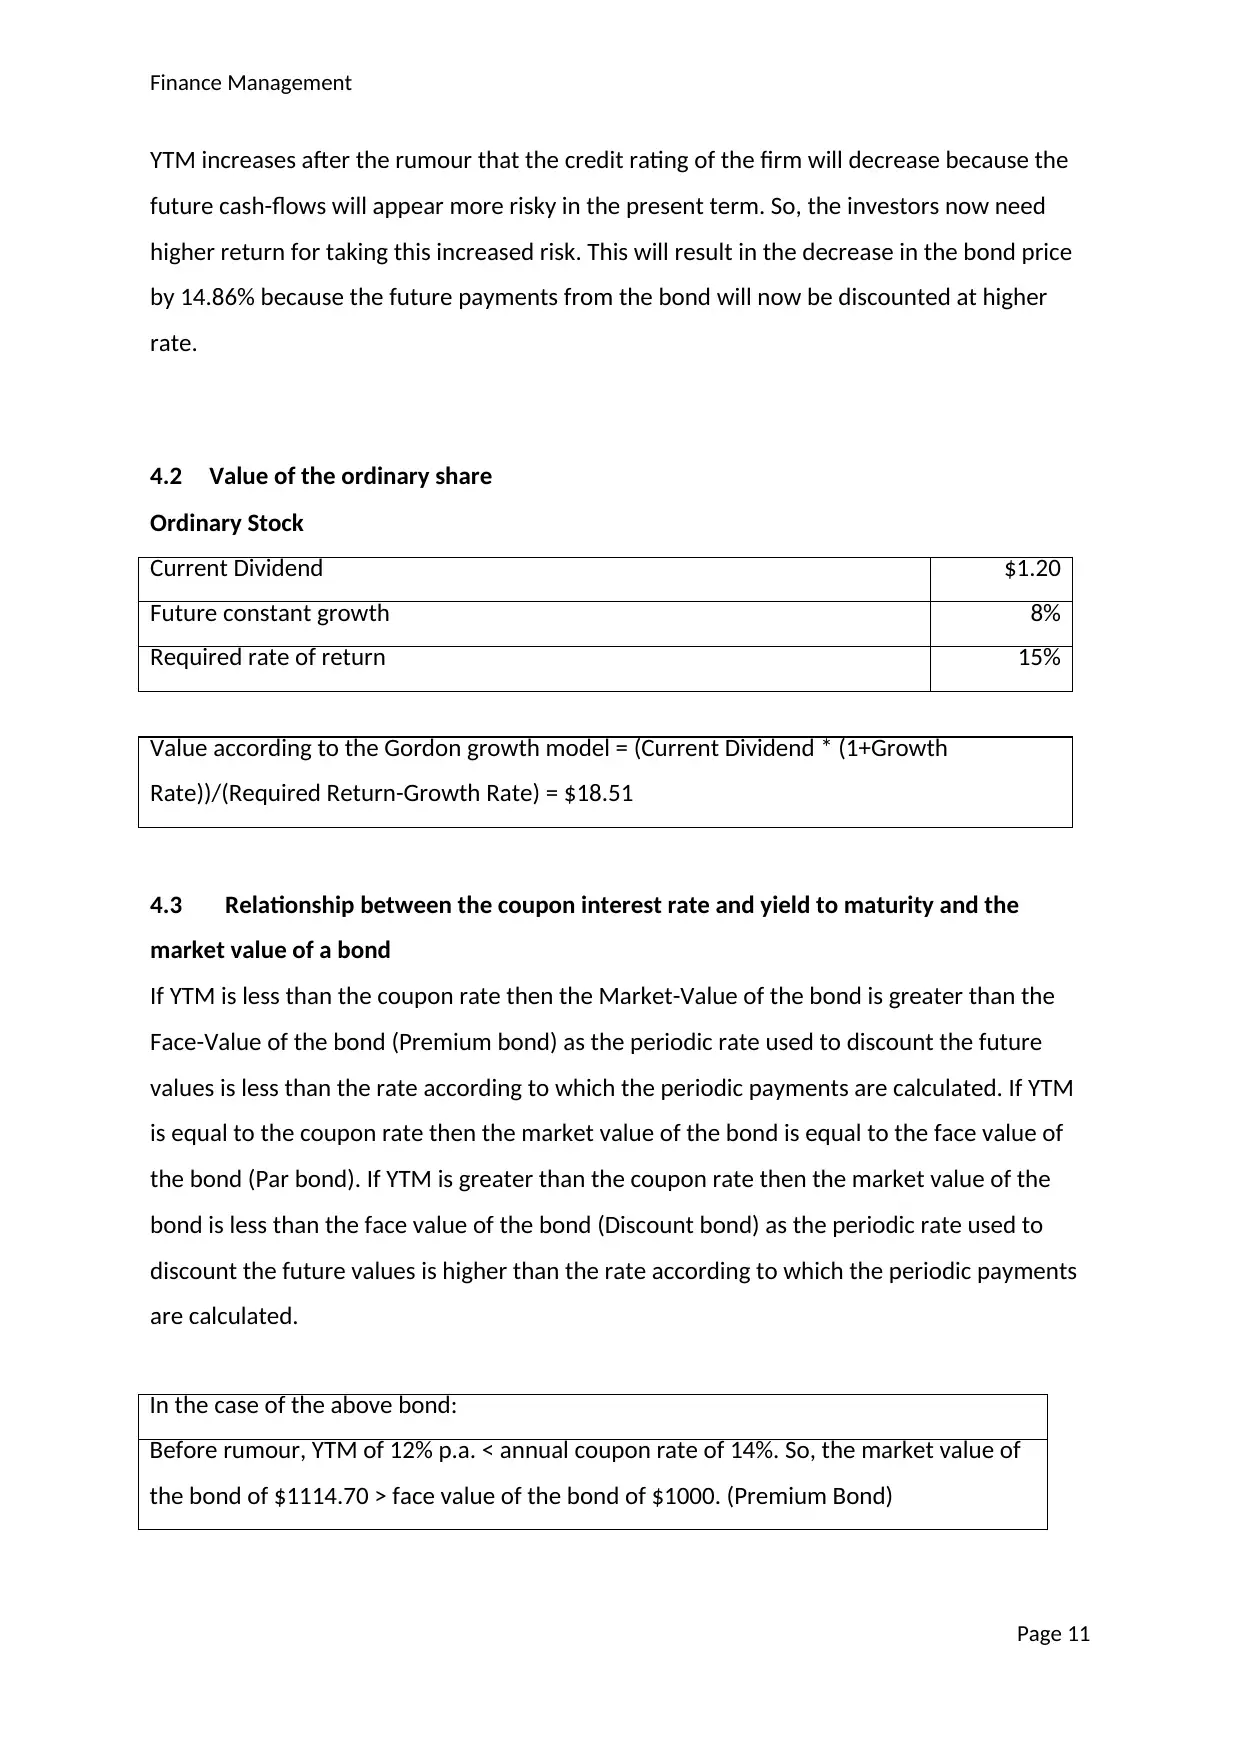
4.2 Value of the ordinary share
Ordinary Stock
Current Dividend $1.20
Future constant growth 8%
Required rate of return 15%
Value according to the Gordon growth model = (Current Dividend * (1+Growth
Rate))/(Required Return-Growth Rate) = $18.51
4.3 Relationship between the coupon interest rate and yield to maturity and the
market value of a bond
If YTM is less than the coupon rate then the Market-Value of the bond is greater than the
Face-Value of the bond (Premium bond) as the periodic rate used to discount the future
values is less than the rate according to which the periodic payments are calculated. If YTM
is equal to the coupon rate then the market value of the bond is equal to the face value of
the bond (Par bond). If YTM is greater than the coupon rate then the market value of the
bond is less than the face value of the bond (Discount bond) as the periodic rate used to
discount the future values is higher than the rate according to which the periodic payments
are calculated.
Page 11
In the case of the above bond:
Before rumour, YTM of 12% p.a. < annual coupon rate of 14%. So, the market value of
the bond of $1114.70 > face value of the bond of $1000. (Premium Bond)
YTM increases after the rumour that the credit rating of the firm will decrease because the
future cash-flows will appear more risky in the present term. So, the investors now need
higher return for taking this increased risk. This will result in the decrease in the bond price
by 14.86% because the future payments from the bond will now be discounted at higher
rate.
4.2 Value of the ordinary share
Ordinary Stock
Current Dividend $1.20
Future constant growth 8%
Required rate of return 15%
Value according to the Gordon growth model = (Current Dividend * (1+Growth
Rate))/(Required Return-Growth Rate) = $18.51
4.3 Relationship between the coupon interest rate and yield to maturity and the
market value of a bond
If YTM is less than the coupon rate then the Market-Value of the bond is greater than the
Face-Value of the bond (Premium bond) as the periodic rate used to discount the future
values is less than the rate according to which the periodic payments are calculated. If YTM
is equal to the coupon rate then the market value of the bond is equal to the face value of
the bond (Par bond). If YTM is greater than the coupon rate then the market value of the
bond is less than the face value of the bond (Discount bond) as the periodic rate used to
discount the future values is higher than the rate according to which the periodic payments
are calculated.
Page 11
In the case of the above bond:
Before rumour, YTM of 12% p.a. < annual coupon rate of 14%. So, the market value of
the bond of $1114.70 > face value of the bond of $1000. (Premium Bond)
Finance Management
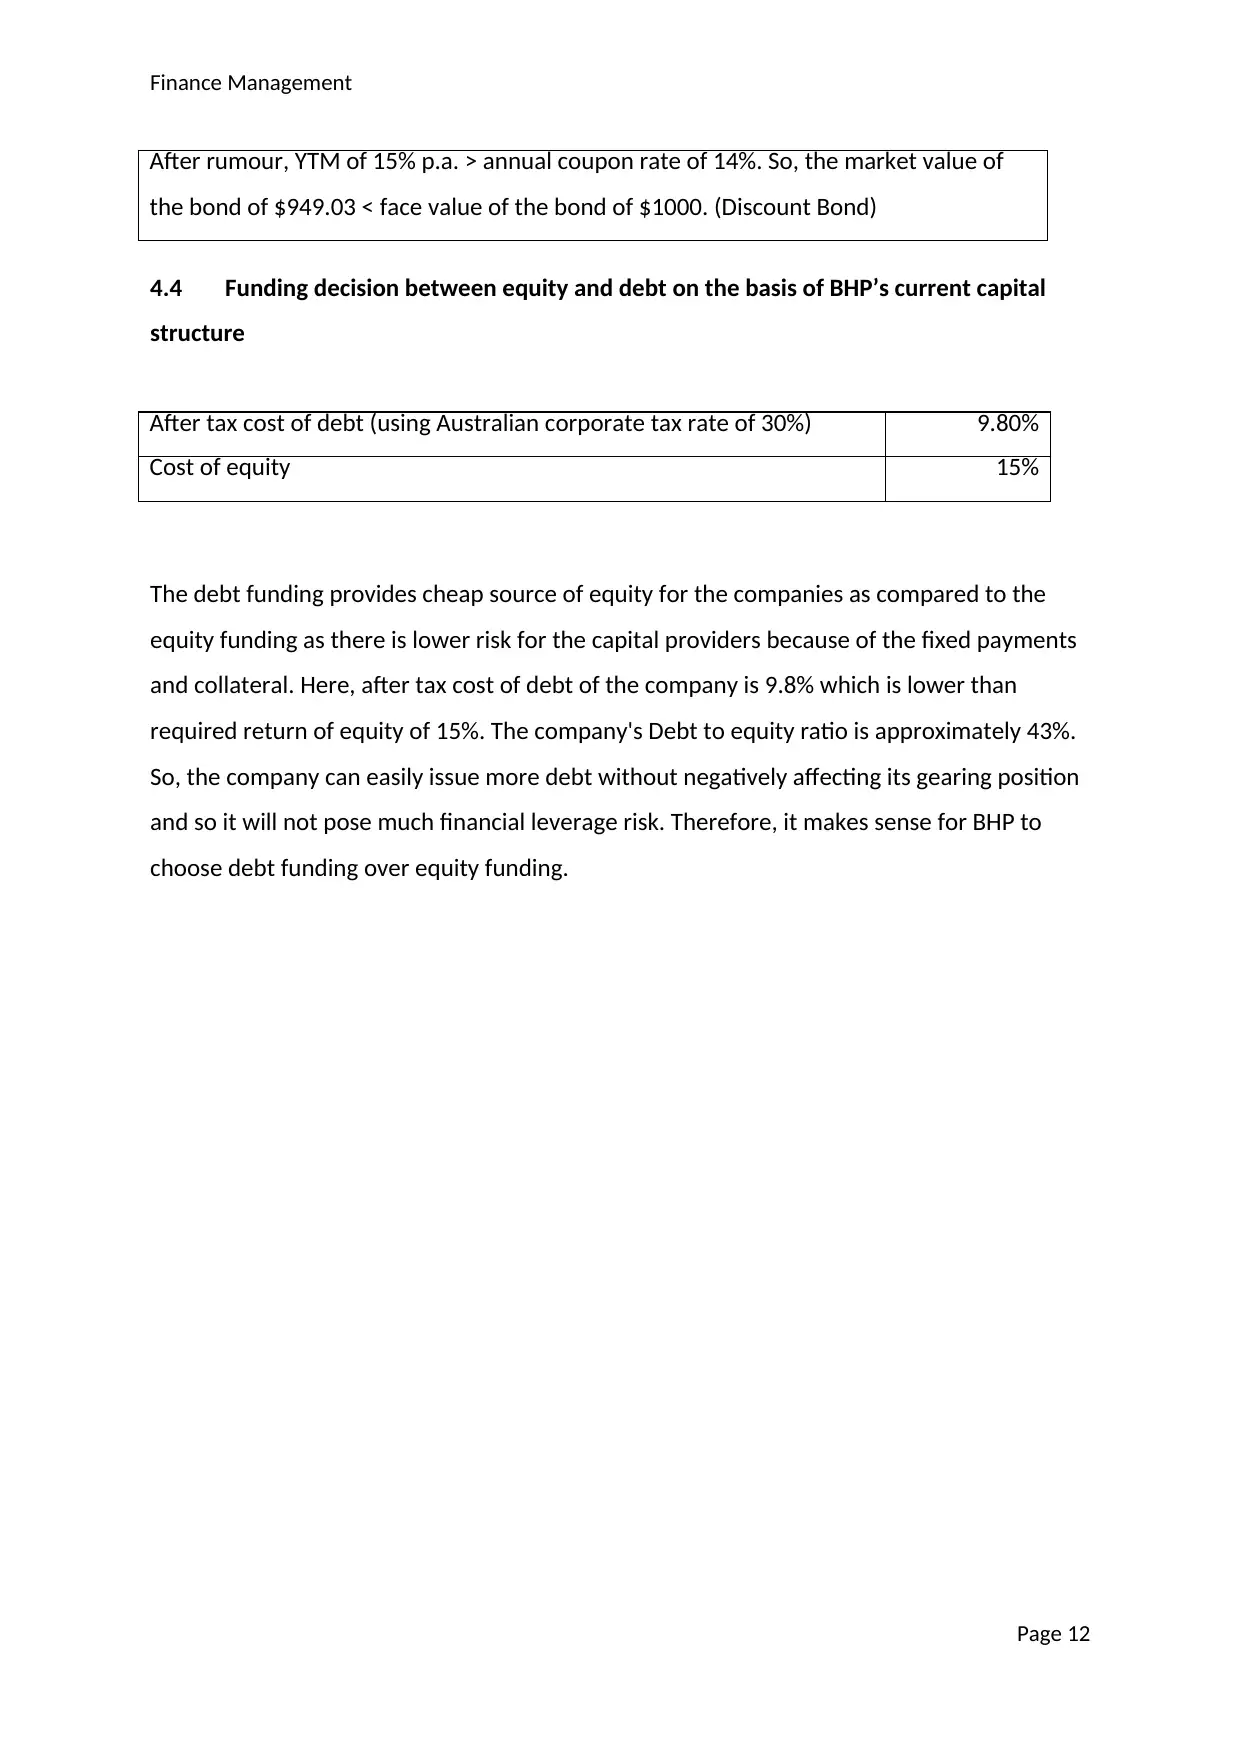
4.4 Funding decision between equity and debt on the basis of BHP’s current capital
structure
The debt funding provides cheap source of equity for the companies as compared to the
equity funding as there is lower risk for the capital providers because of the fixed payments
and collateral. Here, after tax cost of debt of the company is 9.8% which is lower than
required return of equity of 15%. The company's Debt to equity ratio is approximately 43%.
So, the company can easily issue more debt without negatively affecting its gearing position
and so it will not pose much financial leverage risk. Therefore, it makes sense for BHP to
choose debt funding over equity funding.
Page 12
After rumour, YTM of 15% p.a. > annual coupon rate of 14%. So, the market value of
the bond of $949.03 < face value of the bond of $1000. (Discount Bond)
After tax cost of debt (using Australian corporate tax rate of 30%) 9.80%
Cost of equity 15%
⊘ This is a preview!⊘
Do you want full access?
Subscribe today to unlock all pages.
Trusted by 1+ million students worldwide
1 out of 14
Related Documents


Your All-in-One AI-Powered Toolkit for Academic Success.
+13062052269
info@desklib.com
Available 24*7 on WhatsApp / Email
![[object Object]](/_next/static/media/star-bottom.7253800d.svg)
Unlock your academic potential
Copyright © 2020–2026 A2Z Services. All Rights Reserved. Developed and managed by ZUCOL.