BHP Group Valuation: Financial Instruments and Market Analysis Report
VerifiedAdded on 2023/03/17
|13
|3567
|27
Project
AI Summary
This project presents a comprehensive financial analysis and valuation of BHP Group Ltd., a global resources company. It examines the company's industry, operational efficiency, and market factors influencing its share price. The analysis includes current and historical share prices, a comparative analysis with industry peers, and the main drivers behind BHP's stock performance over the past three years. The project utilizes Exponential Moving Average (EMA) to predict future share prices and employs the Discounted Cash Flow (DCF) model and Valuation Composite One (VCI) to determine the intrinsic value of BHP's stock. The report concludes with an assessment of whether BHP is overvalued, undervalued, or fairly valued based on the valuation techniques used. The project also discusses the application of technical analysis and market efficiency concepts in the valuation process.

Surname 1
Name
Introduction to financial instrument and markets
Date
Name
Introduction to financial instrument and markets
Date
Paraphrase This Document
Need a fresh take? Get an instant paraphrase of this document with our AI Paraphraser
Surname 2
Part A: BHP Group valuation
Industry and company analysis for BHP Group Ltd.
BHP Group Ltd is a resources company operating globally. The company operates in the
mining industry with most of its businesses in Australia and the United States. BHP Group
Ltd operates four business segments in the mining industry namely Petroleum, Coal, Iron Ore
and Copper. The Petroleum segment explores, develops and produce oil and gas. The Copper
segment mine minerals such as copper, gold, silver, uranium, lead, molybdenum and zinc.
The Iron Ore segment mines Iron ore. The coal segment focuses on mining thermal coal and
metallurgical coal. BHP Group Ltd uses its global logistics distribution chain of pipeline and
freight transportation to reach the global market.1
The Mining and Energy industry is highly influenced by different factors which affect share
prices and profitability level of different players in the market. Price fluctuations and
economic depressions affect BHP Group Ltd as well. The main factor that affects the share
prices for companies that operate in the resources industry is investors marketing, operational
efficiency and market rates. First, Current market price impacts share prices for mining
companies. The production cost for established mining companies tends to be fixed and
cannot be influenced easily by changes in the market. Therefore, an increase in the market
price directly increases the net profit. Studies have shown that a 20% increase in the market
price of gold translates to a 40% share price for a mining company.2
Second, operational efficiency influence profitability and stock price. It takes a mining
company between five and ten years to establish a process which requires substantial capital
expenditure. Mining companies shut down without effective cost management plan in place.
On the other hand, efficient production contributes to increased profitability and ultimately
the share price increase as well. Third, the ability to apply marketing strategies helps mining
companies to attract new investors. A high number of investors leads to adequate financing of
a company which in return increases profitability and share price.3
BHP Group Ltd.’s share price has increased by 22% over the last year leading to a payment
of $3.1 dividend per share. The increase of share price has been contributed by a good
1 P. Andrew, (2017). Financial Ratio Analysis: The Guide for Investors, Managers, and Small Business.
London: Independently Published.
2 A. Damodaran, (2002). Investment Valuation: Tools and Techniques for Determining the Value of Any Asset.
New York: John Wiley & Sons.
3 C. H. Browne, (2016). The Little Book of Value Investing (Vol. 5). New York: John Wiley & Sons.
Surname 3
reputation in the market, an increase in the amount of Iron Ore, and the ease to attract
investors. The company is also a company leader in the resources industry.4
The current price of ordinary common shares of BHP Group Ltd (ASX: BHP)
a) Current share price for BHP Group common stock
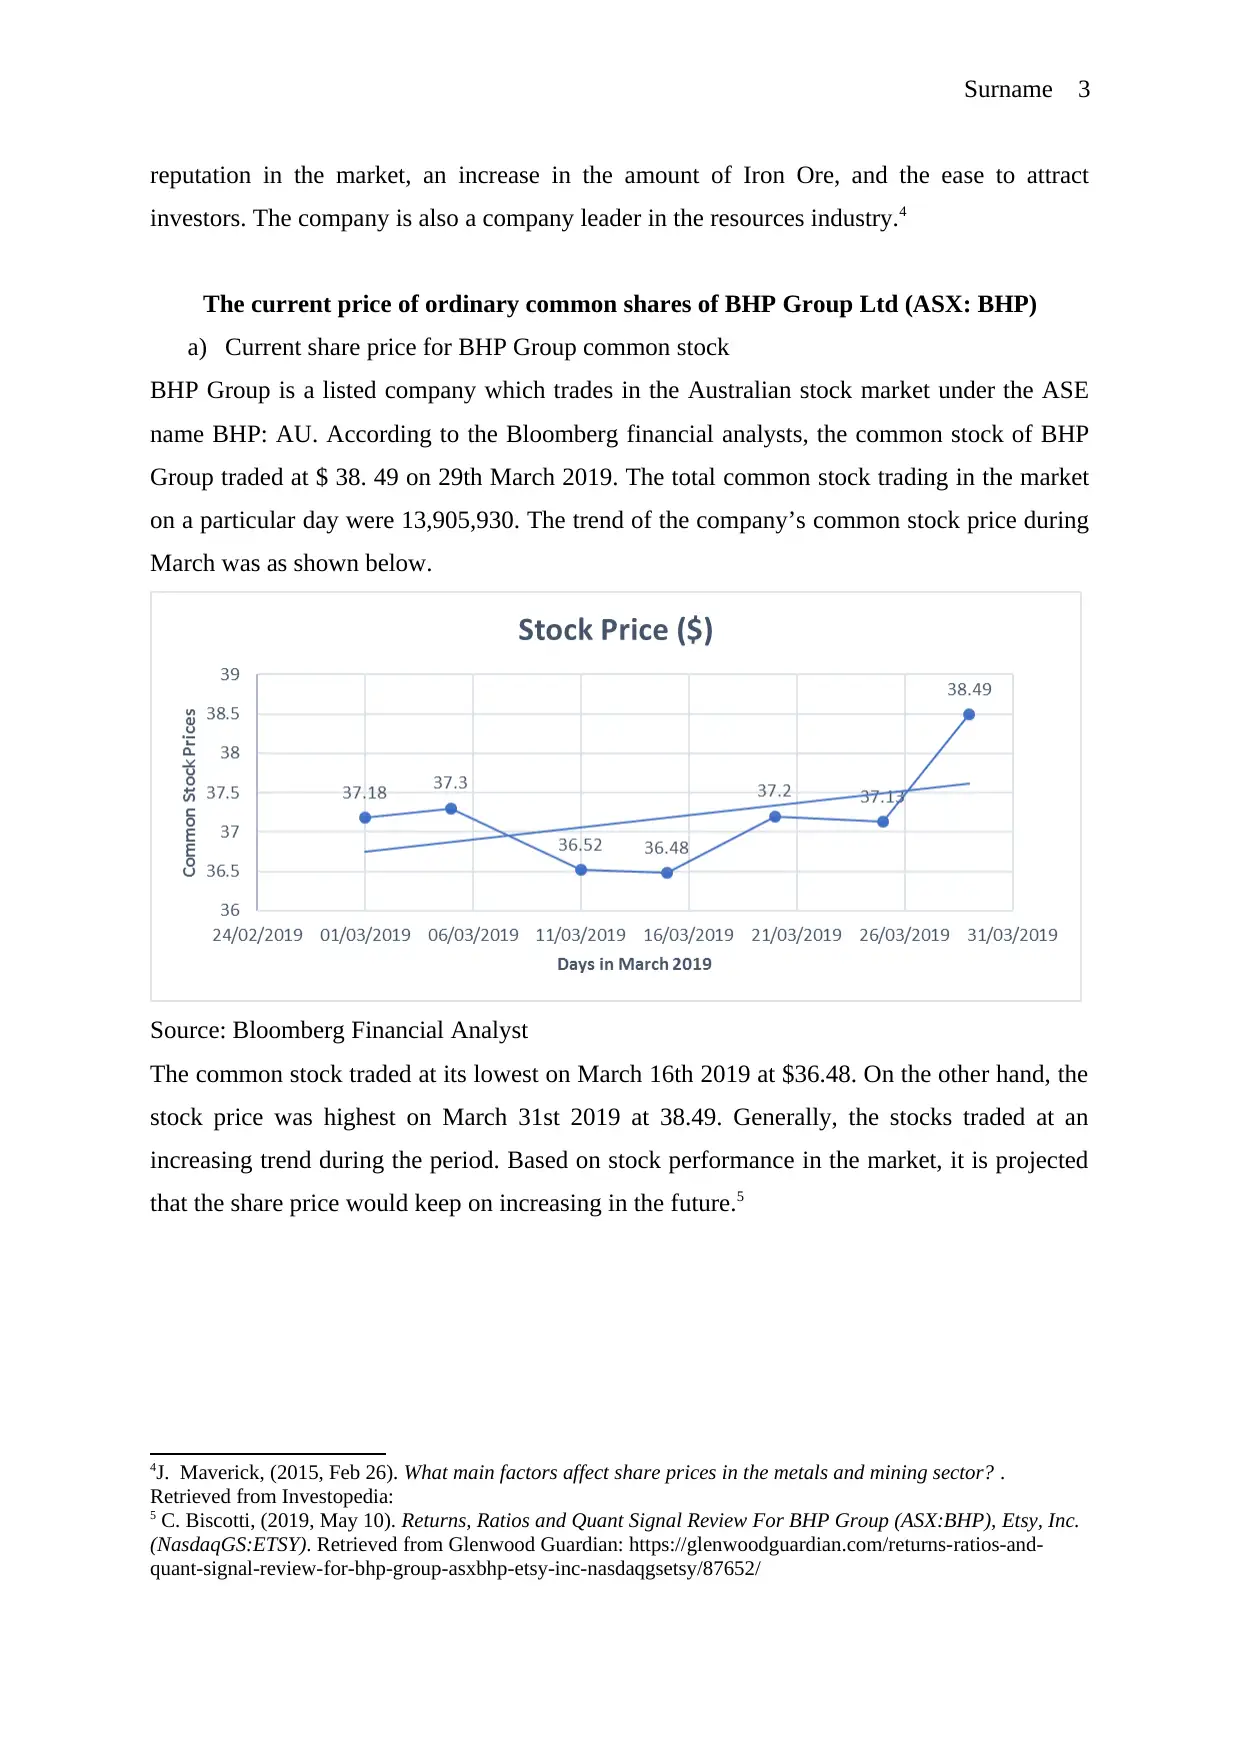
BHP Group is a listed company which trades in the Australian stock market under the ASE
name BHP: AU. According to the Bloomberg financial analysts, the common stock of BHP
Group traded at $ 38. 49 on 29th March 2019. The total common stock trading in the market
on a particular day were 13,905,930. The trend of the company’s common stock price during
March was as shown below.
Source: Bloomberg Financial Analyst
The common stock traded at its lowest on March 16th 2019 at $36.48. On the other hand, the
stock price was highest on March 31st 2019 at 38.49. Generally, the stocks traded at an
increasing trend during the period. Based on stock performance in the market, it is projected
that the share price would keep on increasing in the future.5
4J. Maverick, (2015, Feb 26). What main factors affect share prices in the metals and mining sector? .
Retrieved from Investopedia:
5 C. Biscotti, (2019, May 10). Returns, Ratios and Quant Signal Review For BHP Group (ASX:BHP), Etsy, Inc.
(NasdaqGS:ETSY). Retrieved from Glenwood Guardian: https://glenwoodguardian.com/returns-ratios-and-
quant-signal-review-for-bhp-group-asxbhp-etsy-inc-nasdaqgsetsy/87652/
reputation in the market, an increase in the amount of Iron Ore, and the ease to attract
investors. The company is also a company leader in the resources industry.4
The current price of ordinary common shares of BHP Group Ltd (ASX: BHP)
a) Current share price for BHP Group common stock
BHP Group is a listed company which trades in the Australian stock market under the ASE
name BHP: AU. According to the Bloomberg financial analysts, the common stock of BHP
Group traded at $ 38. 49 on 29th March 2019. The total common stock trading in the market
on a particular day were 13,905,930. The trend of the company’s common stock price during
March was as shown below.
Source: Bloomberg Financial Analyst
The common stock traded at its lowest on March 16th 2019 at $36.48. On the other hand, the
stock price was highest on March 31st 2019 at 38.49. Generally, the stocks traded at an
increasing trend during the period. Based on stock performance in the market, it is projected
that the share price would keep on increasing in the future.5
4J. Maverick, (2015, Feb 26). What main factors affect share prices in the metals and mining sector? .
Retrieved from Investopedia:
5 C. Biscotti, (2019, May 10). Returns, Ratios and Quant Signal Review For BHP Group (ASX:BHP), Etsy, Inc.
(NasdaqGS:ETSY). Retrieved from Glenwood Guardian: https://glenwoodguardian.com/returns-ratios-and-
quant-signal-review-for-bhp-group-asxbhp-etsy-inc-nasdaqgsetsy/87652/
⊘ This is a preview!⊘
Do you want full access?
Subscribe today to unlock all pages.
Trusted by 1+ million students worldwide
Surname 4
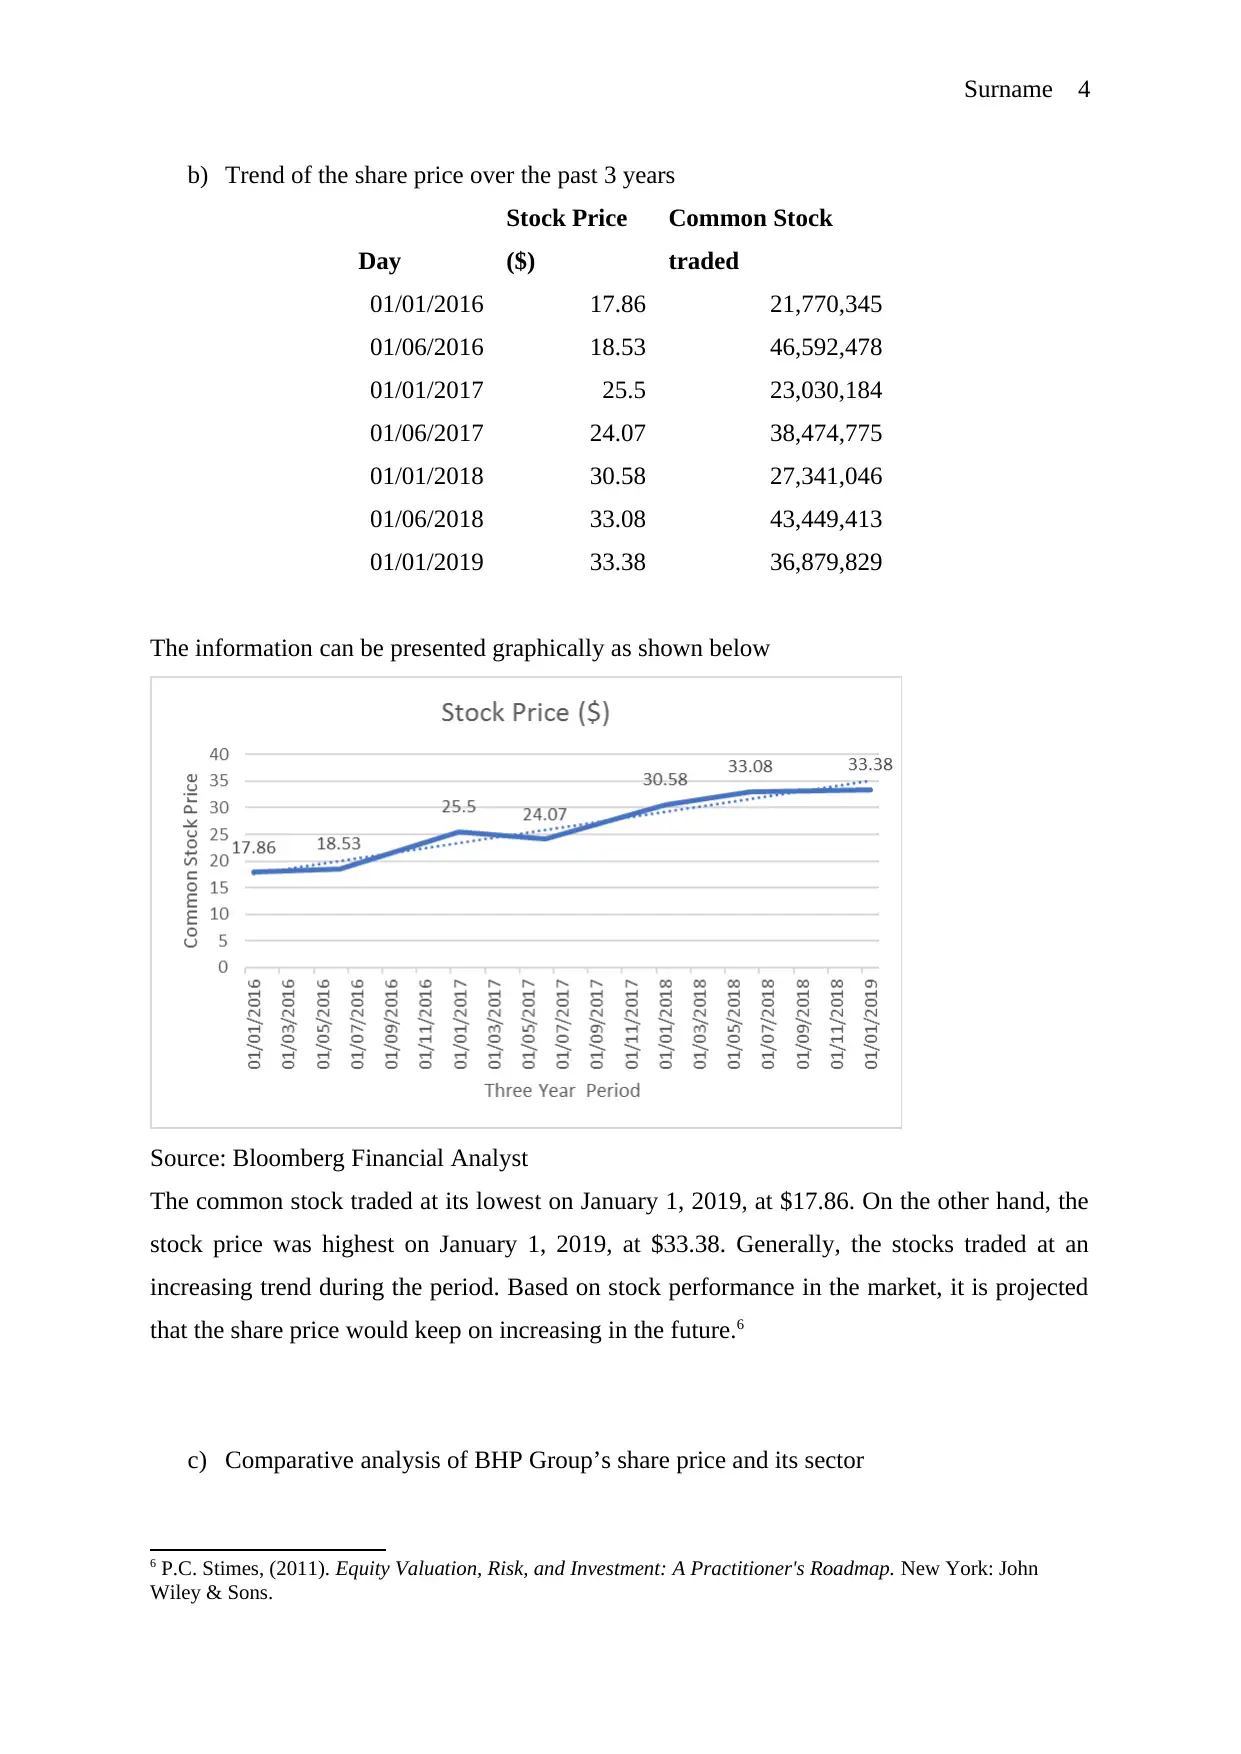
b) Trend of the share price over the past 3 years
Day
Stock Price
($)
Common Stock
traded
01/01/2016 17.86 21,770,345
01/06/2016 18.53 46,592,478
01/01/2017 25.5 23,030,184
01/06/2017 24.07 38,474,775
01/01/2018 30.58 27,341,046
01/06/2018 33.08 43,449,413
01/01/2019 33.38 36,879,829
The information can be presented graphically as shown below
Source: Bloomberg Financial Analyst
The common stock traded at its lowest on January 1, 2019, at $17.86. On the other hand, the
stock price was highest on January 1, 2019, at $33.38. Generally, the stocks traded at an
increasing trend during the period. Based on stock performance in the market, it is projected
that the share price would keep on increasing in the future.6
c) Comparative analysis of BHP Group’s share price and its sector
6 P.C. Stimes, (2011). Equity Valuation, Risk, and Investment: A Practitioner's Roadmap. New York: John
Wiley & Sons.
Paraphrase This Document
Need a fresh take? Get an instant paraphrase of this document with our AI Paraphraser
Surname 5
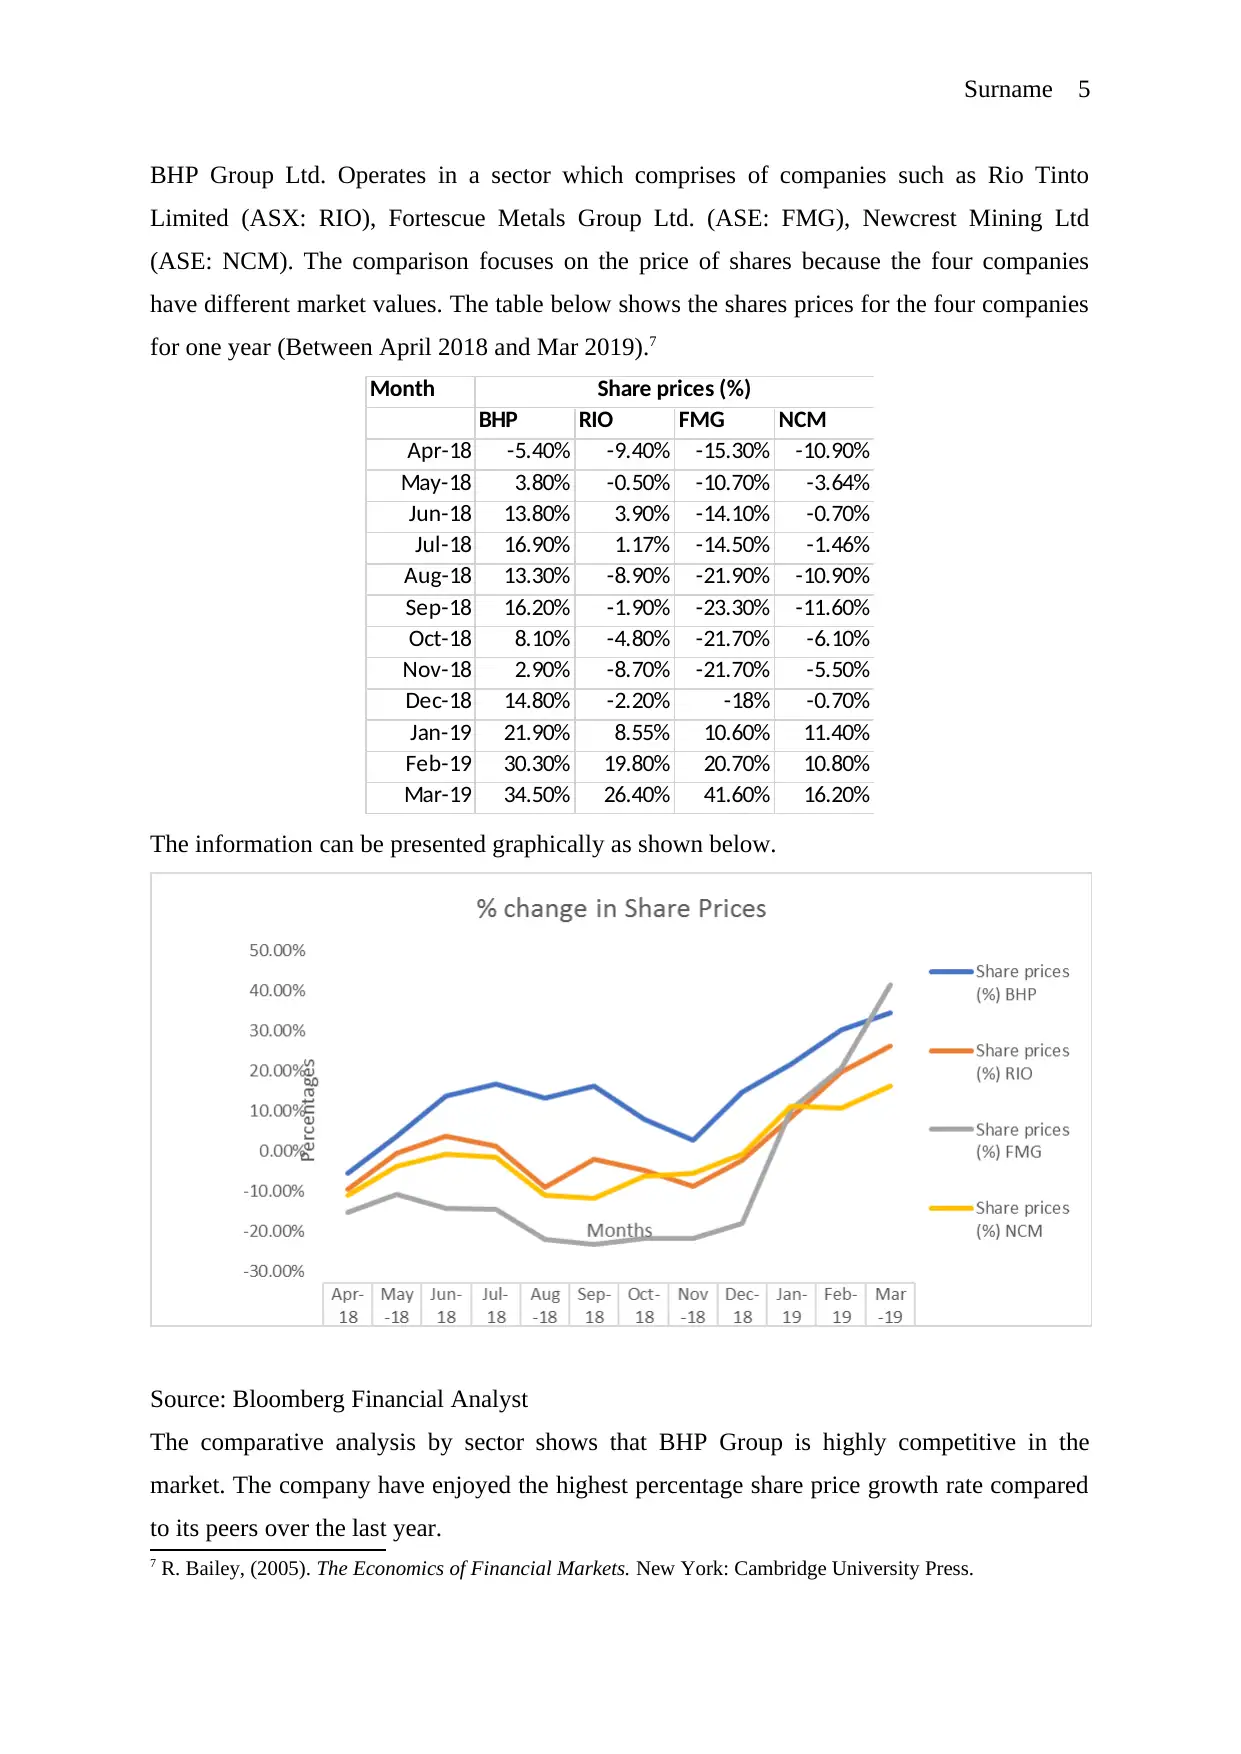
BHP Group Ltd. Operates in a sector which comprises of companies such as Rio Tinto
Limited (ASX: RIO), Fortescue Metals Group Ltd. (ASE: FMG), Newcrest Mining Ltd
(ASE: NCM). The comparison focuses on the price of shares because the four companies
have different market values. The table below shows the shares prices for the four companies
for one year (Between April 2018 and Mar 2019).7
Month
BHP RIO FMG NCM
Apr-18 -5.40% -9.40% -15.30% -10.90%
May-18 3.80% -0.50% -10.70% -3.64%
Jun-18 13.80% 3.90% -14.10% -0.70%
Jul-18 16.90% 1.17% -14.50% -1.46%
Aug-18 13.30% -8.90% -21.90% -10.90%
Sep-18 16.20% -1.90% -23.30% -11.60%
Oct-18 8.10% -4.80% -21.70% -6.10%
Nov-18 2.90% -8.70% -21.70% -5.50%
Dec-18 14.80% -2.20% -18% -0.70%
Jan-19 21.90% 8.55% 10.60% 11.40%
Feb-19 30.30% 19.80% 20.70% 10.80%
Mar-19 34.50% 26.40% 41.60% 16.20%
Share prices (%)
The information can be presented graphically as shown below.
Source: Bloomberg Financial Analyst
The comparative analysis by sector shows that BHP Group is highly competitive in the
market. The company have enjoyed the highest percentage share price growth rate compared
to its peers over the last year.
7 R. Bailey, (2005). The Economics of Financial Markets. New York: Cambridge University Press.
Surname 6
Main driver(s) BHP’s share price movement over the past 3 years and the projected future
trend
BHP Group Ltd.’s share price has increased by an average of 12% over the last year leading
to a payment of $3.1 dividend per share. Moreover, the company’s common stock has
remained competitive over the past three years. The increase of share price has been
contributed by a good reputation in the market, an increase in the price of Iron Ore, and the
ease to attract investors. The company is also a company leader in the resources industry.
Based on the decent share price growth for the company over the past three years, the growth
is expected to continue the future as well.8 Investors look for shares which are sold at cheaper
prices but have the potential to grow. The earning of BHO Group is projected to grow by
approximately 45% in the next five years. The projection presents an optimistic future for the
investors because fertile cash flows lead to growth I share price and dividends.9
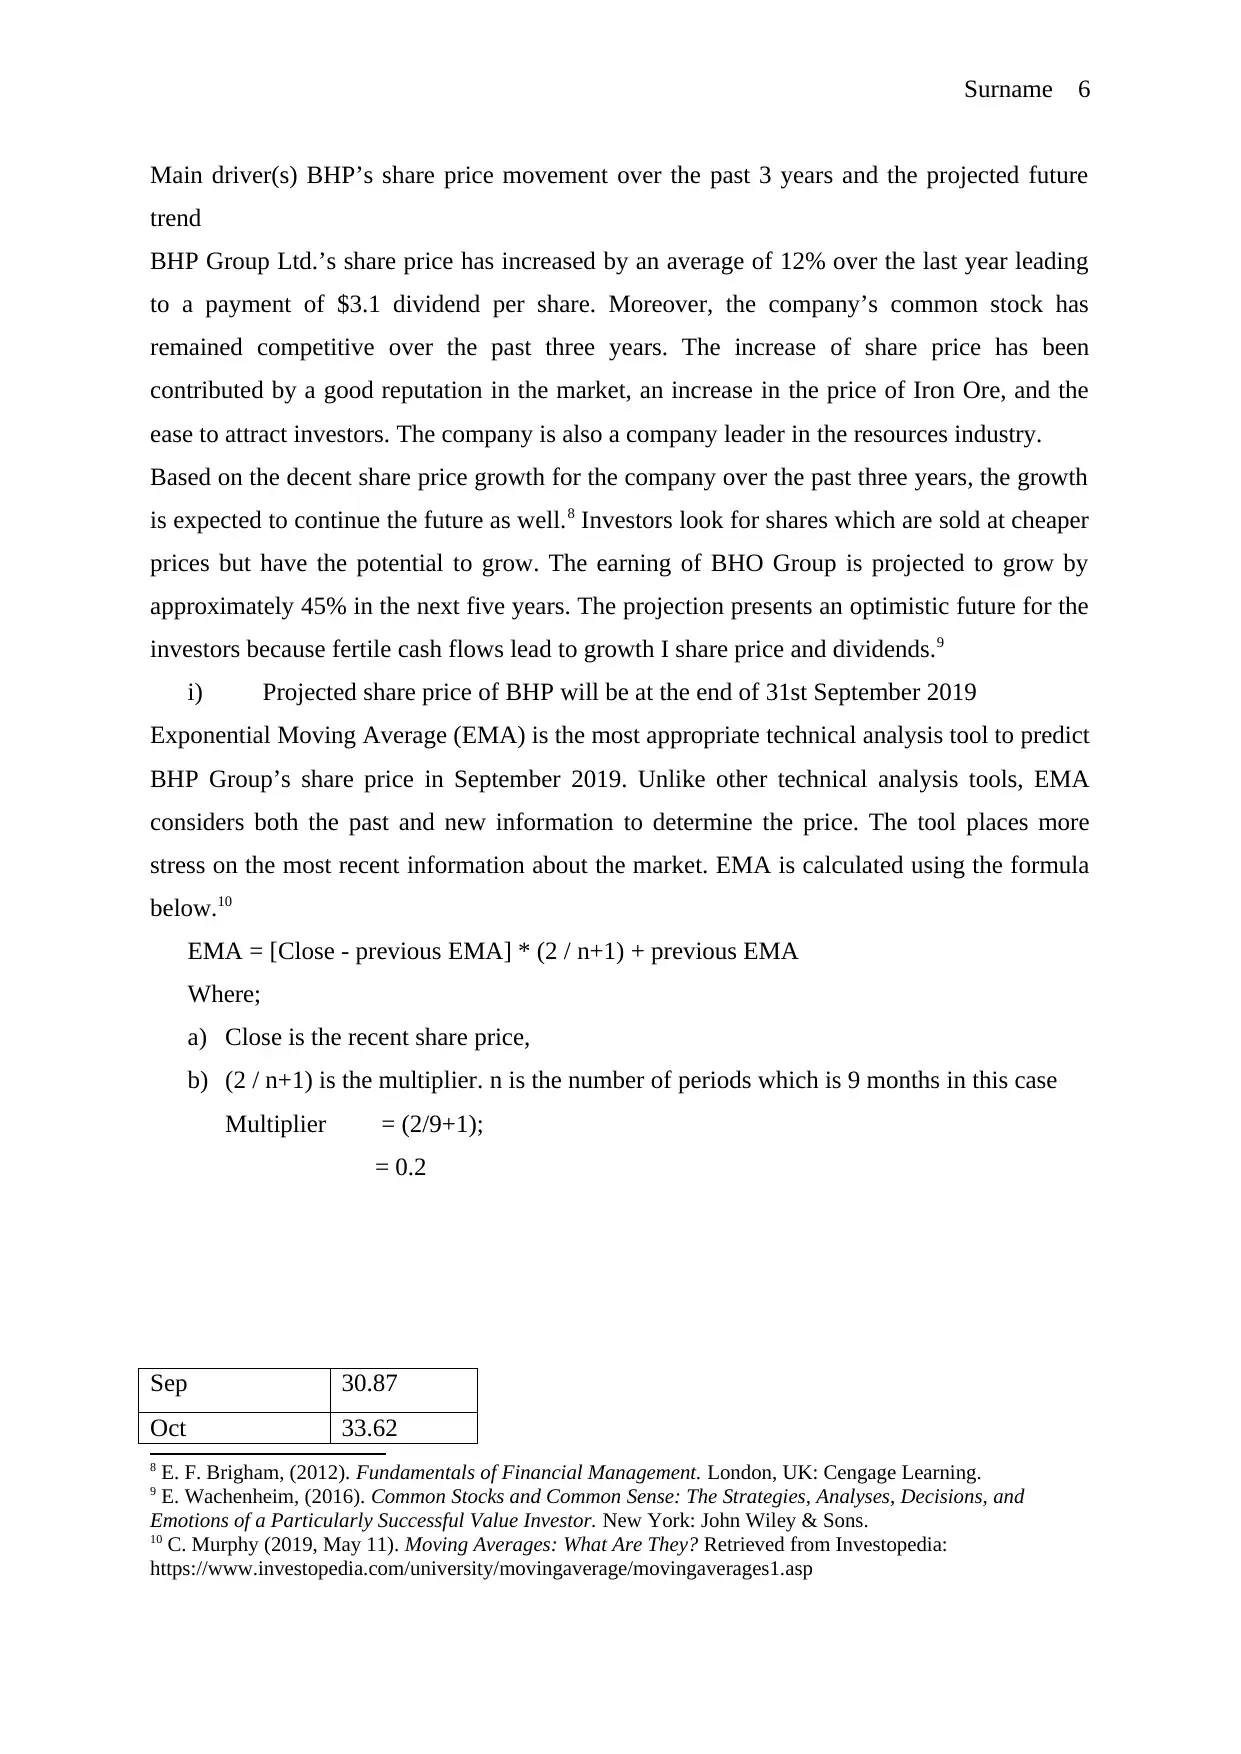
i) Projected share price of BHP will be at the end of 31st September 2019
Exponential Moving Average (EMA) is the most appropriate technical analysis tool to predict
BHP Group’s share price in September 2019. Unlike other technical analysis tools, EMA
considers both the past and new information to determine the price. The tool places more
stress on the most recent information about the market. EMA is calculated using the formula
below.10
EMA = [Close - previous EMA] * (2 / n+1) + previous EMA
Where;
a) Close is the recent share price,
b) (2 / n+1) is the multiplier. n is the number of periods which is 9 months in this case
Multiplier = (2/9+1);
= 0.2
Sep 30.87
Oct 33.62
8 E. F. Brigham, (2012). Fundamentals of Financial Management. London, UK: Cengage Learning.
9 E. Wachenheim, (2016). Common Stocks and Common Sense: The Strategies, Analyses, Decisions, and
Emotions of a Particularly Successful Value Investor. New York: John Wiley & Sons.
10 C. Murphy (2019, May 11). Moving Averages: What Are They? Retrieved from Investopedia:
https://www.investopedia.com/university/movingaverage/movingaverages1.asp
Main driver(s) BHP’s share price movement over the past 3 years and the projected future
trend
BHP Group Ltd.’s share price has increased by an average of 12% over the last year leading
to a payment of $3.1 dividend per share. Moreover, the company’s common stock has
remained competitive over the past three years. The increase of share price has been
contributed by a good reputation in the market, an increase in the price of Iron Ore, and the
ease to attract investors. The company is also a company leader in the resources industry.
Based on the decent share price growth for the company over the past three years, the growth
is expected to continue the future as well.8 Investors look for shares which are sold at cheaper
prices but have the potential to grow. The earning of BHO Group is projected to grow by
approximately 45% in the next five years. The projection presents an optimistic future for the
investors because fertile cash flows lead to growth I share price and dividends.9
i) Projected share price of BHP will be at the end of 31st September 2019
Exponential Moving Average (EMA) is the most appropriate technical analysis tool to predict
BHP Group’s share price in September 2019. Unlike other technical analysis tools, EMA
considers both the past and new information to determine the price. The tool places more
stress on the most recent information about the market. EMA is calculated using the formula
below.10
EMA = [Close - previous EMA] * (2 / n+1) + previous EMA
Where;
a) Close is the recent share price,
b) (2 / n+1) is the multiplier. n is the number of periods which is 9 months in this case
Multiplier = (2/9+1);
= 0.2
Sep 30.87
Oct 33.62
8 E. F. Brigham, (2012). Fundamentals of Financial Management. London, UK: Cengage Learning.
9 E. Wachenheim, (2016). Common Stocks and Common Sense: The Strategies, Analyses, Decisions, and
Emotions of a Particularly Successful Value Investor. New York: John Wiley & Sons.
10 C. Murphy (2019, May 11). Moving Averages: What Are They? Retrieved from Investopedia:
https://www.investopedia.com/university/movingaverage/movingaverages1.asp
⊘ This is a preview!⊘
Do you want full access?
Subscribe today to unlock all pages.
Trusted by 1+ million students worldwide
Surname 7
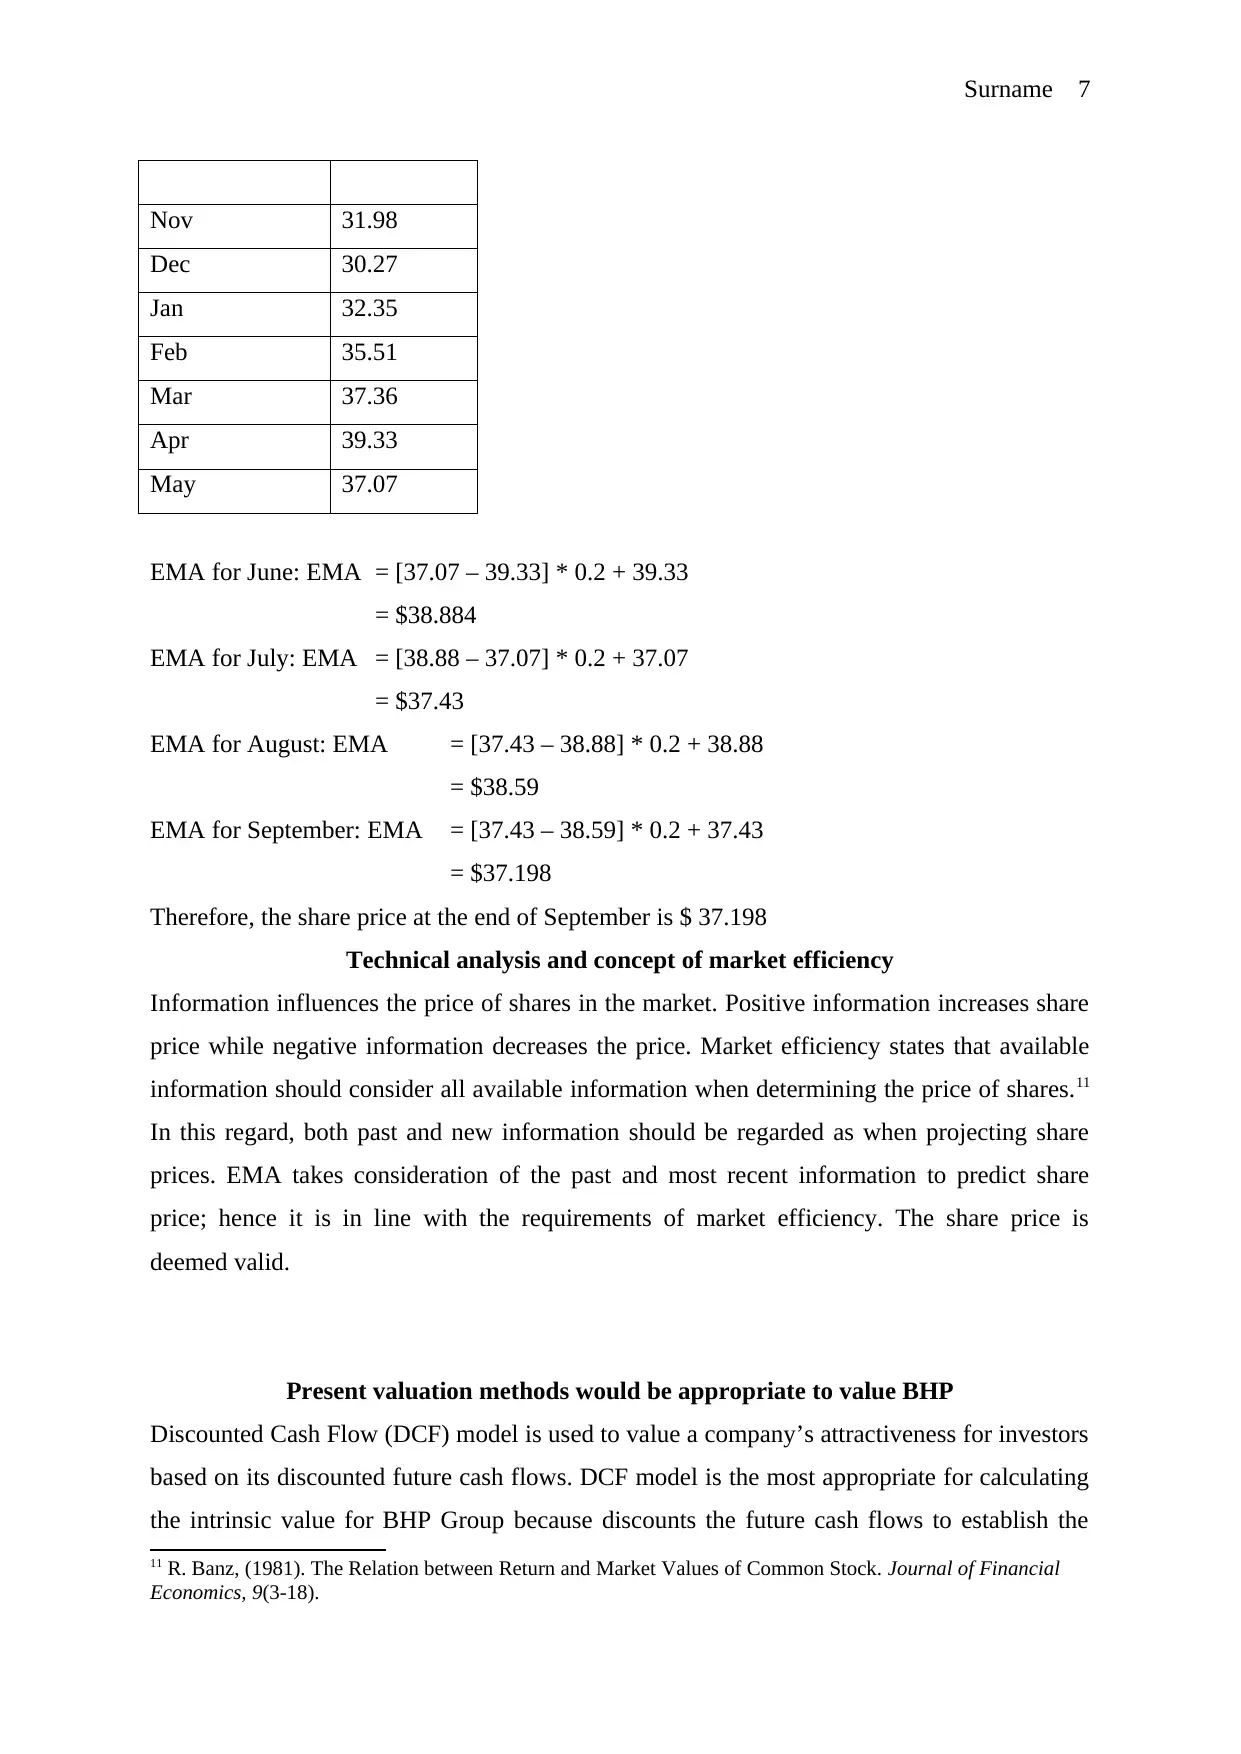
Nov 31.98
Dec 30.27
Jan 32.35
Feb 35.51
Mar 37.36
Apr 39.33
May 37.07
EMA for June: EMA = [37.07 – 39.33] * 0.2 + 39.33
= $38.884
EMA for July: EMA = [38.88 – 37.07] * 0.2 + 37.07
= $37.43
EMA for August: EMA = [37.43 – 38.88] * 0.2 + 38.88
= $38.59
EMA for September: EMA = [37.43 – 38.59] * 0.2 + 37.43
= $37.198
Therefore, the share price at the end of September is $ 37.198
Technical analysis and concept of market efficiency
Information influences the price of shares in the market. Positive information increases share
price while negative information decreases the price. Market efficiency states that available
information should consider all available information when determining the price of shares.11
In this regard, both past and new information should be regarded as when projecting share
prices. EMA takes consideration of the past and most recent information to predict share
price; hence it is in line with the requirements of market efficiency. The share price is
deemed valid.
Present valuation methods would be appropriate to value BHP
Discounted Cash Flow (DCF) model is used to value a company’s attractiveness for investors
based on its discounted future cash flows. DCF model is the most appropriate for calculating
the intrinsic value for BHP Group because discounts the future cash flows to establish the
11 R. Banz, (1981). The Relation between Return and Market Values of Common Stock. Journal of Financial
Economics, 9(3-18).
Paraphrase This Document
Need a fresh take? Get an instant paraphrase of this document with our AI Paraphraser
Surname 8
present value of the company. Investors then use the information to determine whether or not
the investment is worth their money. Moreover, the model will help the investors to evaluate
whether or not BHP is fairly valued.12
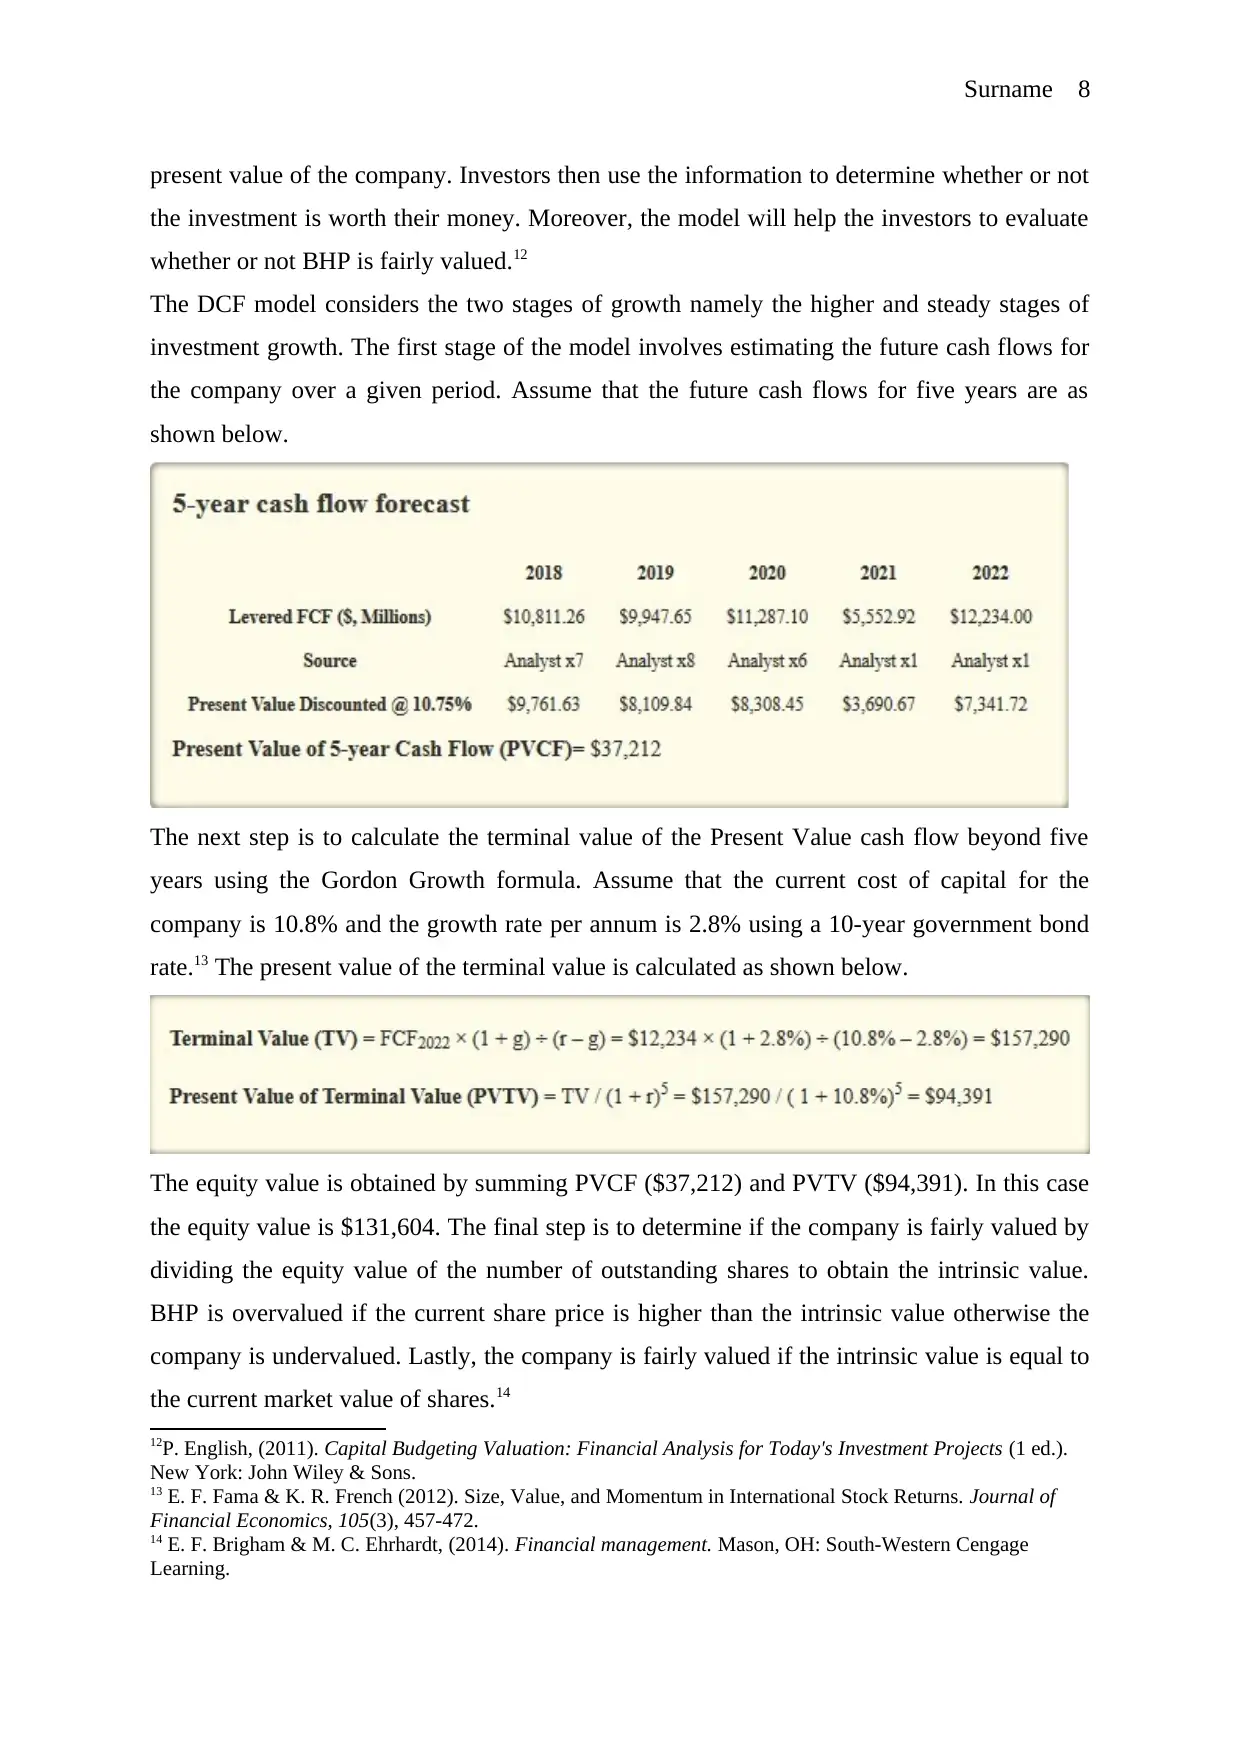
The DCF model considers the two stages of growth namely the higher and steady stages of
investment growth. The first stage of the model involves estimating the future cash flows for
the company over a given period. Assume that the future cash flows for five years are as
shown below.
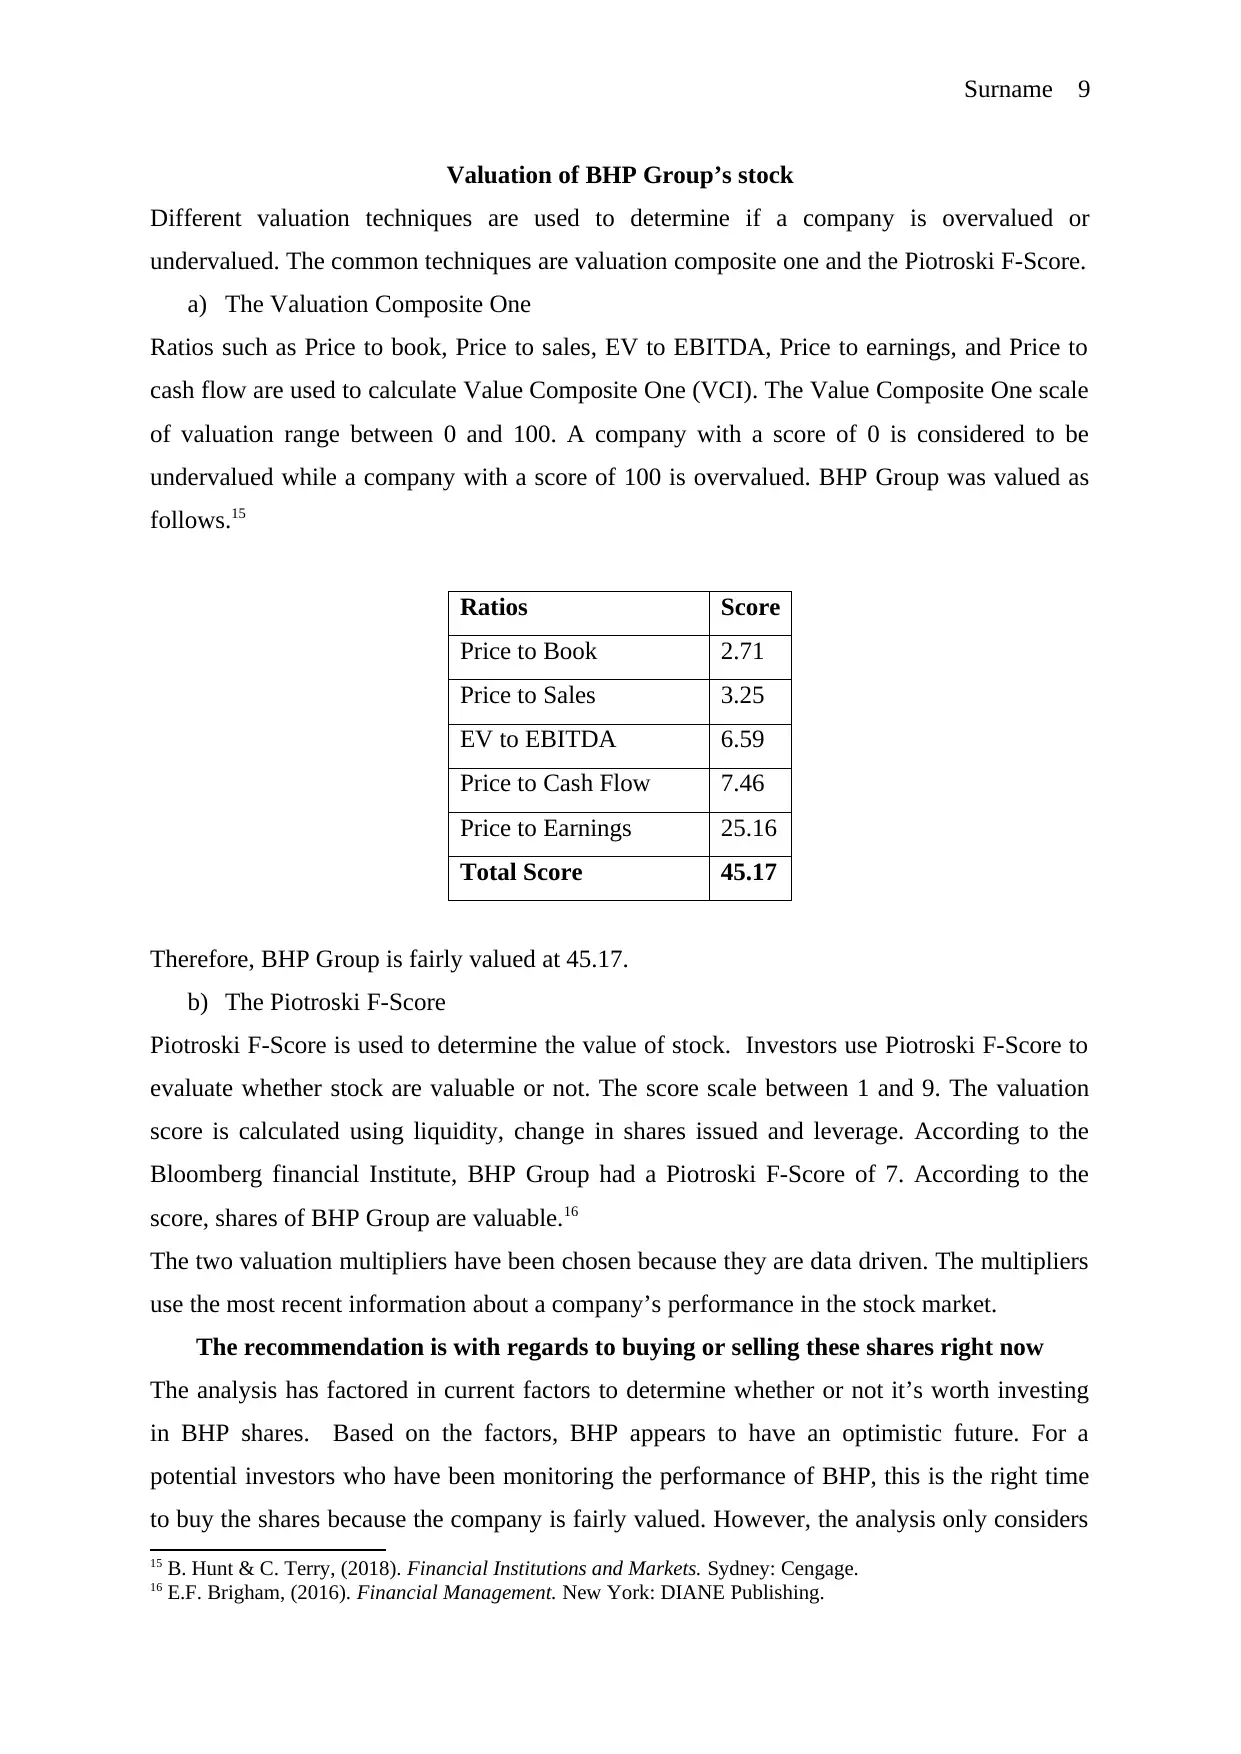
The next step is to calculate the terminal value of the Present Value cash flow beyond five
years using the Gordon Growth formula. Assume that the current cost of capital for the
company is 10.8% and the growth rate per annum is 2.8% using a 10-year government bond
rate.13 The present value of the terminal value is calculated as shown below.
The equity value is obtained by summing PVCF ($37,212) and PVTV ($94,391). In this case
the equity value is $131,604. The final step is to determine if the company is fairly valued by
dividing the equity value of the number of outstanding shares to obtain the intrinsic value.
BHP is overvalued if the current share price is higher than the intrinsic value otherwise the
company is undervalued. Lastly, the company is fairly valued if the intrinsic value is equal to
the current market value of shares.14
12P. English, (2011). Capital Budgeting Valuation: Financial Analysis for Today's Investment Projects (1 ed.).
New York: John Wiley & Sons.
13 E. F. Fama & K. R. French (2012). Size, Value, and Momentum in International Stock Returns. Journal of
Financial Economics, 105(3), 457-472.
14 E. F. Brigham & M. C. Ehrhardt, (2014). Financial management. Mason, OH: South-Western Cengage
Learning.
present value of the company. Investors then use the information to determine whether or not
the investment is worth their money. Moreover, the model will help the investors to evaluate
whether or not BHP is fairly valued.12
The DCF model considers the two stages of growth namely the higher and steady stages of
investment growth. The first stage of the model involves estimating the future cash flows for
the company over a given period. Assume that the future cash flows for five years are as
shown below.
The next step is to calculate the terminal value of the Present Value cash flow beyond five
years using the Gordon Growth formula. Assume that the current cost of capital for the
company is 10.8% and the growth rate per annum is 2.8% using a 10-year government bond
rate.13 The present value of the terminal value is calculated as shown below.
The equity value is obtained by summing PVCF ($37,212) and PVTV ($94,391). In this case
the equity value is $131,604. The final step is to determine if the company is fairly valued by
dividing the equity value of the number of outstanding shares to obtain the intrinsic value.
BHP is overvalued if the current share price is higher than the intrinsic value otherwise the
company is undervalued. Lastly, the company is fairly valued if the intrinsic value is equal to
the current market value of shares.14
12P. English, (2011). Capital Budgeting Valuation: Financial Analysis for Today's Investment Projects (1 ed.).
New York: John Wiley & Sons.
13 E. F. Fama & K. R. French (2012). Size, Value, and Momentum in International Stock Returns. Journal of
Financial Economics, 105(3), 457-472.
14 E. F. Brigham & M. C. Ehrhardt, (2014). Financial management. Mason, OH: South-Western Cengage
Learning.
Surname 9
Valuation of BHP Group’s stock
Different valuation techniques are used to determine if a company is overvalued or
undervalued. The common techniques are valuation composite one and the Piotroski F-Score.
a) The Valuation Composite One
Ratios such as Price to book, Price to sales, EV to EBITDA, Price to earnings, and Price to
cash flow are used to calculate Value Composite One (VCI). The Value Composite One scale
of valuation range between 0 and 100. A company with a score of 0 is considered to be
undervalued while a company with a score of 100 is overvalued. BHP Group was valued as
follows.15
Ratios Score
Price to Book 2.71
Price to Sales 3.25
EV to EBITDA 6.59
Price to Cash Flow 7.46
Price to Earnings 25.16
Total Score 45.17
Therefore, BHP Group is fairly valued at 45.17.
b) The Piotroski F-Score
Piotroski F-Score is used to determine the value of stock. Investors use Piotroski F-Score to
evaluate whether stock are valuable or not. The score scale between 1 and 9. The valuation
score is calculated using liquidity, change in shares issued and leverage. According to the
Bloomberg financial Institute, BHP Group had a Piotroski F-Score of 7. According to the
score, shares of BHP Group are valuable.16
The two valuation multipliers have been chosen because they are data driven. The multipliers
use the most recent information about a company’s performance in the stock market.
The recommendation is with regards to buying or selling these shares right now
The analysis has factored in current factors to determine whether or not it’s worth investing
in BHP shares. Based on the factors, BHP appears to have an optimistic future. For a
potential investors who have been monitoring the performance of BHP, this is the right time
to buy the shares because the company is fairly valued. However, the analysis only considers
15 B. Hunt & C. Terry, (2018). Financial Institutions and Markets. Sydney: Cengage.
16 E.F. Brigham, (2016). Financial Management. New York: DIANE Publishing.
⊘ This is a preview!⊘
Do you want full access?
Subscribe today to unlock all pages.
Trusted by 1+ million students worldwide
Surname 10
the performance of the stock market. A deeper analysis should be carried by analyzing the
financial health of the company based on the balance sheet items.17
Part B: Bloomberg Market Concepts (BMC)
17 Osburn. (2019, May 7). Bargain or Bust? What’s inside the Numbers For BHP Group (ASX:BHP). Retrieved
from Osburn Oracle: https://osburnoracle.com/bargain-or-bust-whats-inside-the-numbers-for-bhp-group-
asxbhp/86617/
Paraphrase This Document
Need a fresh take? Get an instant paraphrase of this document with our AI Paraphraser
Surname 11
Bloomberg Market Concepts in an e-learning course offered by the Bloomberg Institute to
students who aspire to become financial professionals. The concepts Bloomberg market
introduces students to the basic principle of the financial market. Likewise, the concepts also
equip the students with the ability to challenges in the financial market. The initial idea
behind the creation of the e-learning course was to assist professionals to acquire the desired
capabilities and skills.18
Bloomberg market concepts course is divided into four modules. The economic module is
relevant because it introduces learners on fundamental economic indicators and how they are
used to determine the financial health of an investment. The currencies module introduces
learners on the performance of currencies and how their fluctuations would impact
investment opportunities. Fixed Income module introduces learners on how the bond market
operates as well as how bonds influence interest rates, investments and financial health of
entities. Equities module helps learners to understand the operations in the equity market.19
BMC also incorporates real cases to help learners understand the functionality of the financial
market. Real life examples make the learning process memorable, relevant and easy to
understand. Moreover, the use of real-life scenarios helps participants to become well
equipped for interviews.
Bibliography
Andrew, P. (2017). Financial Ratio Analysis: The Guide for Investors, Managers, and Small
Business. London: Independently Published.
Bailey, R. (2005). The Economics of Financial Markets. New York: Cambridge University
Press.
18 WallStreetMojo. (2019, May 11). Bloomberg Market Concepts – BMC | Complete Beginner’s Guide.
Retrieved from WallStreetMojo: https://www.wallstreetmojo.com/bloomberg-market-concepts-bmc/
19 Ibid.,
Surname 12
Banz, R. (1981). The Relation between Return and Market Values of Common Stock.
Journal of Financial Economics, 9(3-18).
Biscotti, C. (2019, May 10). Returns, Ratios and Quant Signal Review For BHP Group
(ASX:BHP), Etsy, Inc. (NasdaqGS:ETSY). Retrieved from Glenwood Guardian:
https://glenwoodguardian.com/returns-ratios-and-quant-signal-review-for-bhp-group-
asxbhp-etsy-inc-nasdaqgsetsy/87652/
Brigham, E. F. (2012). Fundamentals of Financial Management. London, UK: Cengage
Learning.
Brigham, E. F. (2016). Financial Management. New York: DIANE Publishing.
Brigham, E. F., & Ehrhardt, M. C. (2014). Financial management. Mason, OH: South-
Western Cengage Learning.
Browne, C. H. (2016). The Little Book of Value Investing (Vol. 5). New York: John Wiley &
Sons.
Damodaran, A. (2002). Investment Valuation: Tools and Techniques for Determining the
Value of Any Asset. New York: John Wiley & Sons.
English, P. (2011). Capital Budgeting Valuation: Financial Analysis for Today's Investment
Projects (1 ed.). New York: John Wiley & Sons.
Fama, E. F., & French, K. R. (2012). Size, Value, and Momentum in International Stock
Returns. Journal of Financial Economics, 105(3), 457-472.
Hunt, B., & Terry, C. (2018). Financial Institutions and Markets. Sydney: Cengage.
Maverick, J. (2015, Feb 26). What main factors affect share prices in the metals and mining
sector? . Retrieved from Investopedia:
https://www.investopedia.com/ask/answers/022615/what-main-factors-affect-share-
prices-metals-and-mining-sector.asp
Murphy, C. (2019, May 11). Moving Averages: What Are They? Retrieved from
Investopedia:
https://www.investopedia.com/university/movingaverage/movingaverages1.asp
Osburn. (2019, May 7). Bargain or Bust? What’s inside the Numbers For BHP Group
(ASX:BHP). Retrieved from Osburn Oracle: https://osburnoracle.com/bargain-or-bust-
whats-inside-the-numbers-for-bhp-group-asxbhp/86617/
Simply Wall St. (2018, Feb 17). What Does BHP Billiton Limited’s (ASX:BHP) Share Price
Indicate? . Retrieved from Simply Wall Street Pty:
⊘ This is a preview!⊘
Do you want full access?
Subscribe today to unlock all pages.
Trusted by 1+ million students worldwide
1 out of 13
Related Documents


Your All-in-One AI-Powered Toolkit for Academic Success.
+13062052269
info@desklib.com
Available 24*7 on WhatsApp / Email
![[object Object]](/_next/static/media/star-bottom.7253800d.svg)
Unlock your academic potential
Copyright © 2020–2026 A2Z Services. All Rights Reserved. Developed and managed by ZUCOL.