Analyzing the Effect of BHP Billiton Income on Australian GDP
VerifiedAdded on 2023/06/04
|23
|5009
|230
Report
AI Summary
This research report investigates the influence of BHP Billiton's income on Australia's Gross Domestic Product (GDP). The study examines the company's annual revenue, dividend payments, and market capitalization to determine their impact on the Australian economy from 2003 to 2017. The report begins with an executive summary, problem statement, and research questions, followed by a literature review that explores the relationship between the mining industry, annual revenue, dividend payments, market capitalization, and GDP. The methodology section details the data collection process, which relies on secondary data from annual reports, financial websites, and the World Bank. Quantitative methods, including descriptive statistics, bivariate correlation, and regression analysis, are employed to analyze the data and draw conclusions. The findings reveal the growth path of BHP Billiton and the relationship between its annual revenue and Australia's GDP, along with the moderating influence of dividend payments and market capitalization. The report concludes by addressing the research aims and objectives, acknowledging limitations, and offering recommendations for future research. The report provides valuable insights into the economic impact of a major mining company on a national economy.
Running Head: EFFECT OF BHP BILLITON INCOME ON AUSTRALIAN GDP
Effect of Bhp Billiton Income on Australian GDP
Name of the Student
Name of the University
Author note
Course ID
Effect of Bhp Billiton Income on Australian GDP
Name of the Student
Name of the University
Author note
Course ID
Paraphrase This Document
Need a fresh take? Get an instant paraphrase of this document with our AI Paraphraser
1EFFECT OF BHP BILLITON INCOME ON AUSTRALIAN GDP
Executive Summary
The research paper intends to find out the impact of BHP Billiton’s income on Australia's GDP.
The complete research is based upon three research questions. The first research question
concerns with the overtime growth of the company. The second research question tries to find
significant influence of company's annual revenue on GDP of Australia. The third research
question is about the moderating influence of two other variables on GDP other than annual
revenue. The two other variables of concern are dividend payment and market capitalization.
Past literature was conducted focusing on influence of mining industry on GDP of Australia.
Studies concluded that mining sector in Australia has considerable impact on Australian
economy. During the period of mining boom the sector accounted a significant portion of GDP
and provides huge employment to the people. Annual revenue of a company affects GDP in
various ways. Different channel through which earnings of a firm influence GDP include
household and public sector expenditure, investment and net export. Dividend payment is part of
the profit paid to the company's shareholder. Market capitalization reflects total value of the
company’s outstanding share.
Time series data are collected on net profit, annual revenue, dividend payment, market
capitalization and GDP of Australia for a period from 2003 to 2017. After collecting the data,
quantitative method is used to analyze the data and draw conclusion.
Table of Contents
2EFFECT OF BHP BILLITON INCOME ON AUSTRALIAN GDP
1.Introduction...................................................................................................................................3
1.1 Problem Statement............................................................................................................3
1.2 Research aim and research question.................................................................................4
2. Literature review..........................................................................................................................4
2.1 Mining industry and GDP of Australia..................................................................................4
2.2 Annual revenue and GDP......................................................................................................5
2.3 Dividend payment and market capitalization........................................................................6
2.4 Hypothesis.............................................................................................................................7
3. Methodology................................................................................................................................7
3.1 Data collection.......................................................................................................................7
3.2 Data Analysis.........................................................................................................................8
4. Finding and Analysis...................................................................................................................8
4.1 Descriptive Statistics.............................................................................................................8
4.2 Bivariate Correlation...........................................................................................................11
4.3 Regression Analysis.............................................................................................................11
5. Discussion..................................................................................................................................14
5.1 Growth of BHP Billiton.......................................................................................................14
5.2 Hypothesis 1: Annual Revenue of BHP Billiton is significantly related to GDP of Australia
...................................................................................................................................................15
5.3 Hypothesis 2: There is a significant moderating influence of dividend payment and market
capitalization on GDP of Australia............................................................................................15
6. Conclusion.................................................................................................................................16
6.1 Addressing research aim and research objective.................................................................16
6.2 Limitation............................................................................................................................17
6.3 Recommendation.................................................................................................................17
References......................................................................................................................................18
⊘ This is a preview!⊘
Do you want full access?
Subscribe today to unlock all pages.
Trusted by 1+ million students worldwide
3EFFECT OF BHP BILLITON INCOME ON AUSTRALIAN GDP
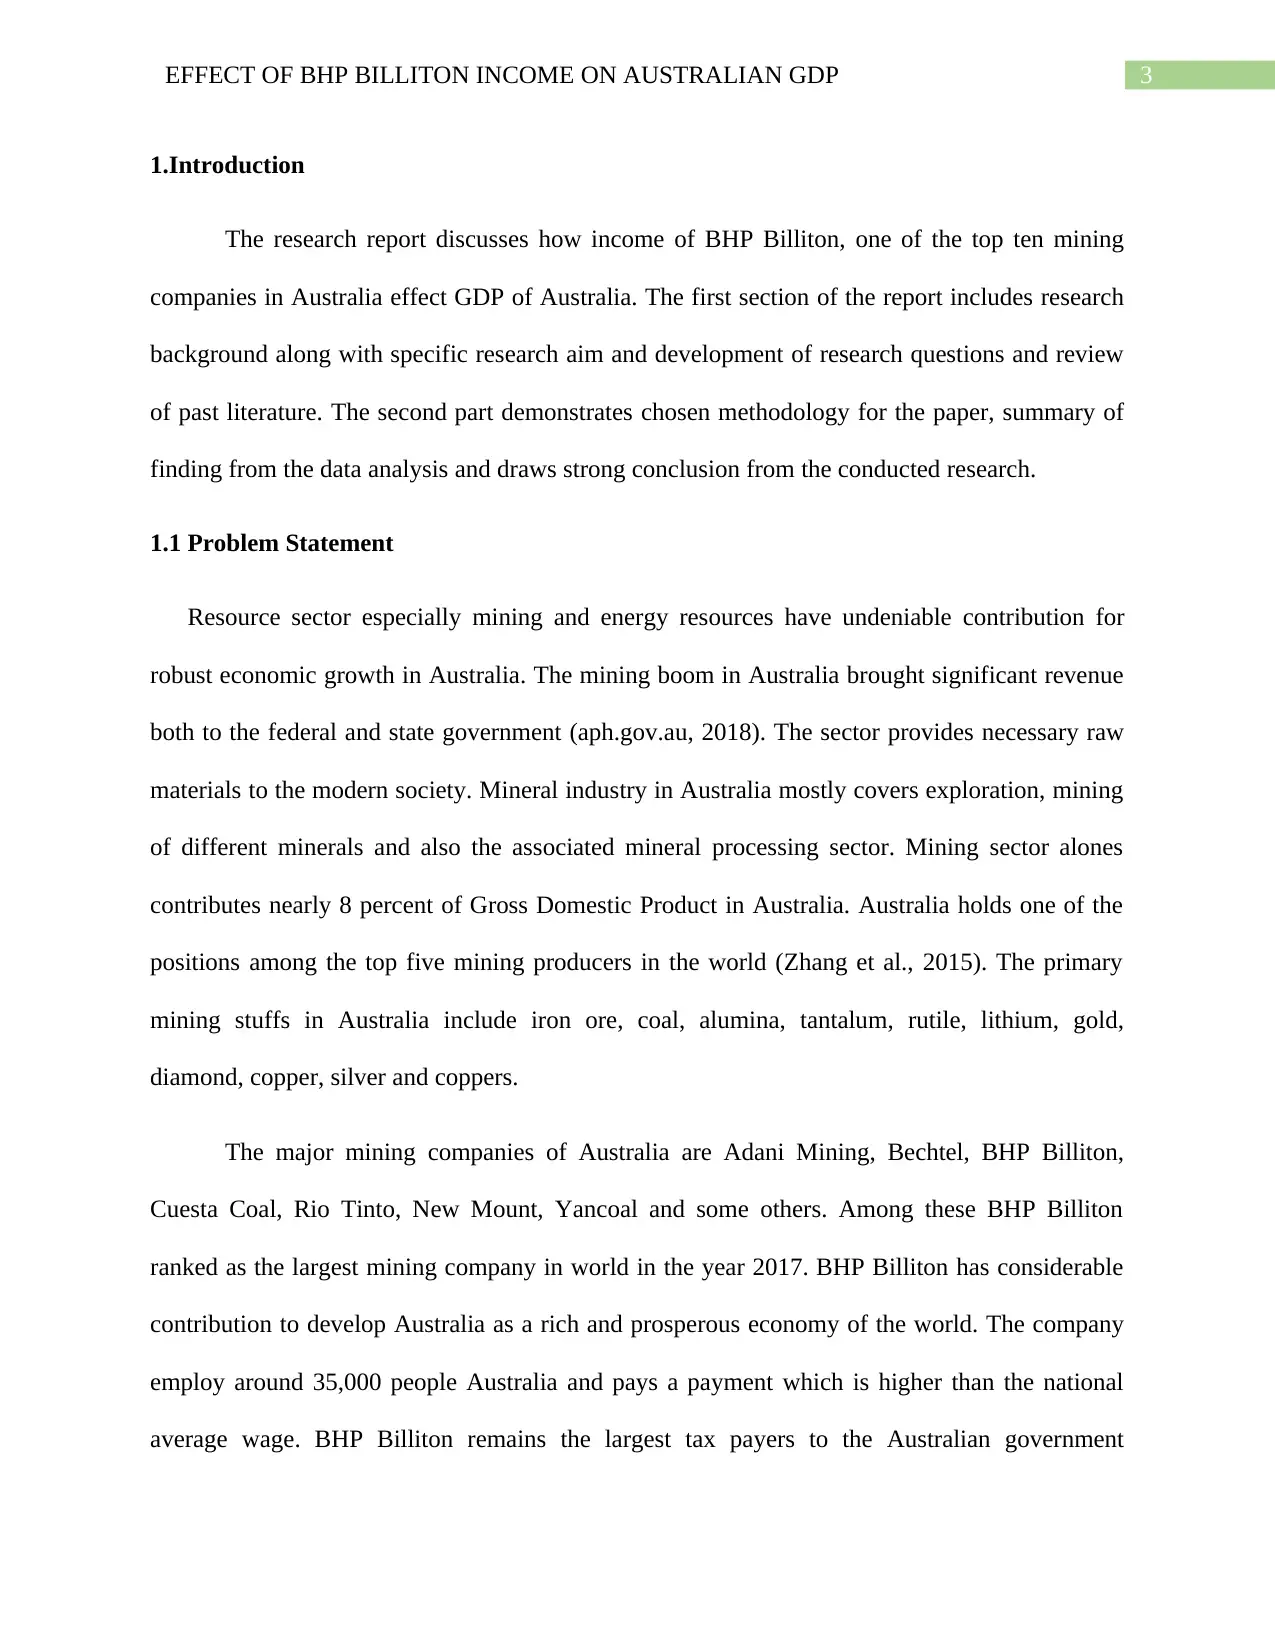
1.Introduction
The research report discusses how income of BHP Billiton, one of the top ten mining
companies in Australia effect GDP of Australia. The first section of the report includes research
background along with specific research aim and development of research questions and review
of past literature. The second part demonstrates chosen methodology for the paper, summary of
finding from the data analysis and draws strong conclusion from the conducted research.
1.1 Problem Statement
Resource sector especially mining and energy resources have undeniable contribution for
robust economic growth in Australia. The mining boom in Australia brought significant revenue
both to the federal and state government (aph.gov.au, 2018). The sector provides necessary raw
materials to the modern society. Mineral industry in Australia mostly covers exploration, mining
of different minerals and also the associated mineral processing sector. Mining sector alones
contributes nearly 8 percent of Gross Domestic Product in Australia. Australia holds one of the
positions among the top five mining producers in the world (Zhang et al., 2015). The primary
mining stuffs in Australia include iron ore, coal, alumina, tantalum, rutile, lithium, gold,
diamond, copper, silver and coppers.
The major mining companies of Australia are Adani Mining, Bechtel, BHP Billiton,
Cuesta Coal, Rio Tinto, New Mount, Yancoal and some others. Among these BHP Billiton
ranked as the largest mining company in world in the year 2017. BHP Billiton has considerable
contribution to develop Australia as a rich and prosperous economy of the world. The company
employ around 35,000 people Australia and pays a payment which is higher than the national
average wage. BHP Billiton remains the largest tax payers to the Australian government
Paraphrase This Document
Need a fresh take? Get an instant paraphrase of this document with our AI Paraphraser
4EFFECT OF BHP BILLITON INCOME ON AUSTRALIAN GDP
(bhp.com, 2018). Realizing the vast contribution of mining industry and in particular of BHP
Billiton, the present paper attempts to find the influence of BHP Billiton income on GDP of
Australia. Income effect of the company is modeled in terms of annual revenue earned by the
company. Besides annual revenue dividend payment and market capitalization are taken as
control variables and the moderating impact of these two components on GDP is evaluated.
Impact of these variables on Australian GDP are examined using time series data for last fifteen
years.
1.2 Research aim and research question
The current research paper aims to find out how income of BHP Billiton influences GDP of
Australia over time. The particular research questions that the paper addresses are as follows
What is the trend growth path of BHP Billiton?
How annual revenue of BHP Billiton alone influences Australian GDP?
How annual revenue along with dividend payment and market capitalization influence
GDP of Australia?
2. Literature review
2.1 Mining industry and GDP of Australia
Mining includes exploration and processing of different mineral deposits of a nation. In
Australia, many of the mineral resources are unevenly distributed across different regions.
Western Australia for example is rich in iron ore and gas, New South Wales and Queensland are
rich coal and coal seam gas (Bjornland & Thorsrud, 2016) Australian mining industry
experienced a considerable structural shift during the since early 2000s. The growth in mining
industry source from a high price of resources resulted from a combination of high resource
5EFFECT OF BHP BILLITON INCOME ON AUSTRALIAN GDP
demand in from advanced economies and inelastic response from the supply side (Syed et al.,
2015). The higher resource prices created substantial opportunities for miming companies. The
investment and associated employment in mining sectors grew rapidly since 2011. Capital
investment in the sector as a share of Australian total rise significantly (Zhang, A. and Moffat,
2015). The long expansionary phase in mining sector is known as the period of mining boom.
The mining boom had considerable influence on employment and GDP of Australia. The mining
boom was larger in comparison to any other commodity boom in Australia. Since then mining
accounts a significant share in GDP of Australia. In terms of valued added, contribution of
mining in Australian GDP during 2011-2012 was 10 percent (Deephouse, Newburry &
Soleimani, 2016). The gross fixed capital formation estimated in prices of 2011-12 accounted 4
percent of GDP at this time. This was the highest contribution by a single industry in an
economy. Capital expenditure in mining was recorded 53 percent of private capital expenditure
valued nearly $82 billion. The gross value added produced by mining in Australia is
approximately $140 billion in 2012. Of this mining sector alone contributed approximately 90
percent (Howarth. Quaglia & Liebe, 2017) Rest of the value added was generated by exploration
and mining support services.
2.2 Annual revenue and GDP
Revenue of big companies contribute a significant portion of GDP of a nation. There are
several channels through which earnings of a company influence national income. A
considerable portion of firms’ income is contributed from household and public sector
consumption (Li, Zhang & Xiao, 2017) An increase in company’s earning thus represents an
increase in consumption expenditure from both household and government which constitute an
important part of GDP. Revenue of a firm also represents a sales and production of investment
⊘ This is a preview!⊘
Do you want full access?
Subscribe today to unlock all pages.
Trusted by 1+ million students worldwide
6EFFECT OF BHP BILLITON INCOME ON AUSTRALIAN GDP
goods. In the phase of globalization and growing operation of multinational corporations,
revenue of a company also depends on the income generated abroad (Zhao, 2016) This adds to
another channel in to the GDP contribution. Sales of firms good abroad is included in the net
export term of GDP. Taxes paid by the companies add to government expenditure. As tax
revenue increases, government can spend more on the economy which in turn increases GDP of
a nation (Qian et al., 2018).
2.3 Dividend payment and market capitalization
In addition to revenue two other significant factors in balance sheet of a company are
divided payment and market capitalization. Dividend payment indicates payments that a
company makes to the shareholders of the company as a part of its profit share (Bradbury, 2016)
In times when a company makes positive profit it is capable of reinvesting the profit the to
expand its business and pay dividend to the shareholders. A dividend is paid as a certain amount
per share. The shareholders receive dividends as a proportion of their shareholding. Dividends
are considered as a source of income (Gregory, 2012) This by influencing income of
shareholders might influence GDP of a nation. There exists a commonality between GDP of a
nation and earnings in the stock market.
The market capitalization indicates total market value of outstanding shares of a
company. This is commonly known as market cap. The market cap of a company is computed by
multiplying unit price per share with the number of outstanding shares. In financial market,
market capitalization is used to identify size of a company. It is a better measure of modeling
size of the company as opposed to figures of total assets or total sales (Bagatska & Piuro, 2017)
The market size of a company is important in making economic and financial decision. Higher
Paraphrase This Document
Need a fresh take? Get an instant paraphrase of this document with our AI Paraphraser

7EFFECT OF BHP BILLITON INCOME ON AUSTRALIAN GDP
market cap indicates a strong position of the company in the stock market. This is turn
contributes to revenue and profit earnings of the company.
market cap indicates a strong position of the company in the stock market. This is turn
contributes to revenue and profit earnings of the company.
8EFFECT OF BHP BILLITON INCOME ON AUSTRALIAN GDP
2.4 Hypothesis
Depending on the past literature and research questions of the current research, the
following two hypotheses are framed.
Hypothesis 1
Null Hypothesis (H01): There exists no significant relation between revenue of BHP Billiton and
GDP of Australia.
Alternative Hypothesis (HA1): A statistically significant relation exists between revenue of BHP
Billiton and GDP of Australia
Hypothesis 2
Null Hypothesis (H02): Dividend payment and Market capitalization of BHP billion do not have
significant moderating influence on GDP of Australia.
Alternative Hypothesis (HA2): Dividend payment and Market capitalization of BHP billion have
a statistically significant moderating influence on GDP of Australia.
3. Methodology
3.1 Data collection
The objective of his research paper is to determine how income of BHP Billiton is related
to that of GDP of Australia. Income of the company is estimated using the annual revenue. Other
related variables that are taken into consideration include net profit, dividend payment and
market capitalization. The research is based on secondary data sources. The company data such
as net profit revenue, dividend and market capitalization are collected from annual reports and
⊘ This is a preview!⊘
Do you want full access?
Subscribe today to unlock all pages.
Trusted by 1+ million students worldwide
9EFFECT OF BHP BILLITON INCOME ON AUSTRALIAN GDP
official website of BHP Billiton and other financial websites. Data on Australian GDP is
collected from work bank website.
3.2 Data Analysis
A time series quantitative data has been collected from the annual reports, financial
websites and company’s website. The collected data is then analyzed using quantitative method.
The quantitative method stresses objective based measures using numerical, statistical or
mathematical analysis of collected data (Brannen, 2017) It is particularly useful in determining
relationship between one variable to other. In order to find out trend growth of the company,
overtime trend in profit is analyzed. Two separate regressions are conducted. One is bivariate
regression taking GDP as dependent and annual revenue as independent variable (Fox, 2015).
Other is multiple linear regression where GDP is the dependent variable and annual revenue,
dividend payment and market capitalization are considered as independent variables. The
descriptive statistics and correlation analysis are conducted to find the overall trend and nature of
relationship among the variables (Darlington & Hayes, 2016).
4. Finding and Analysis
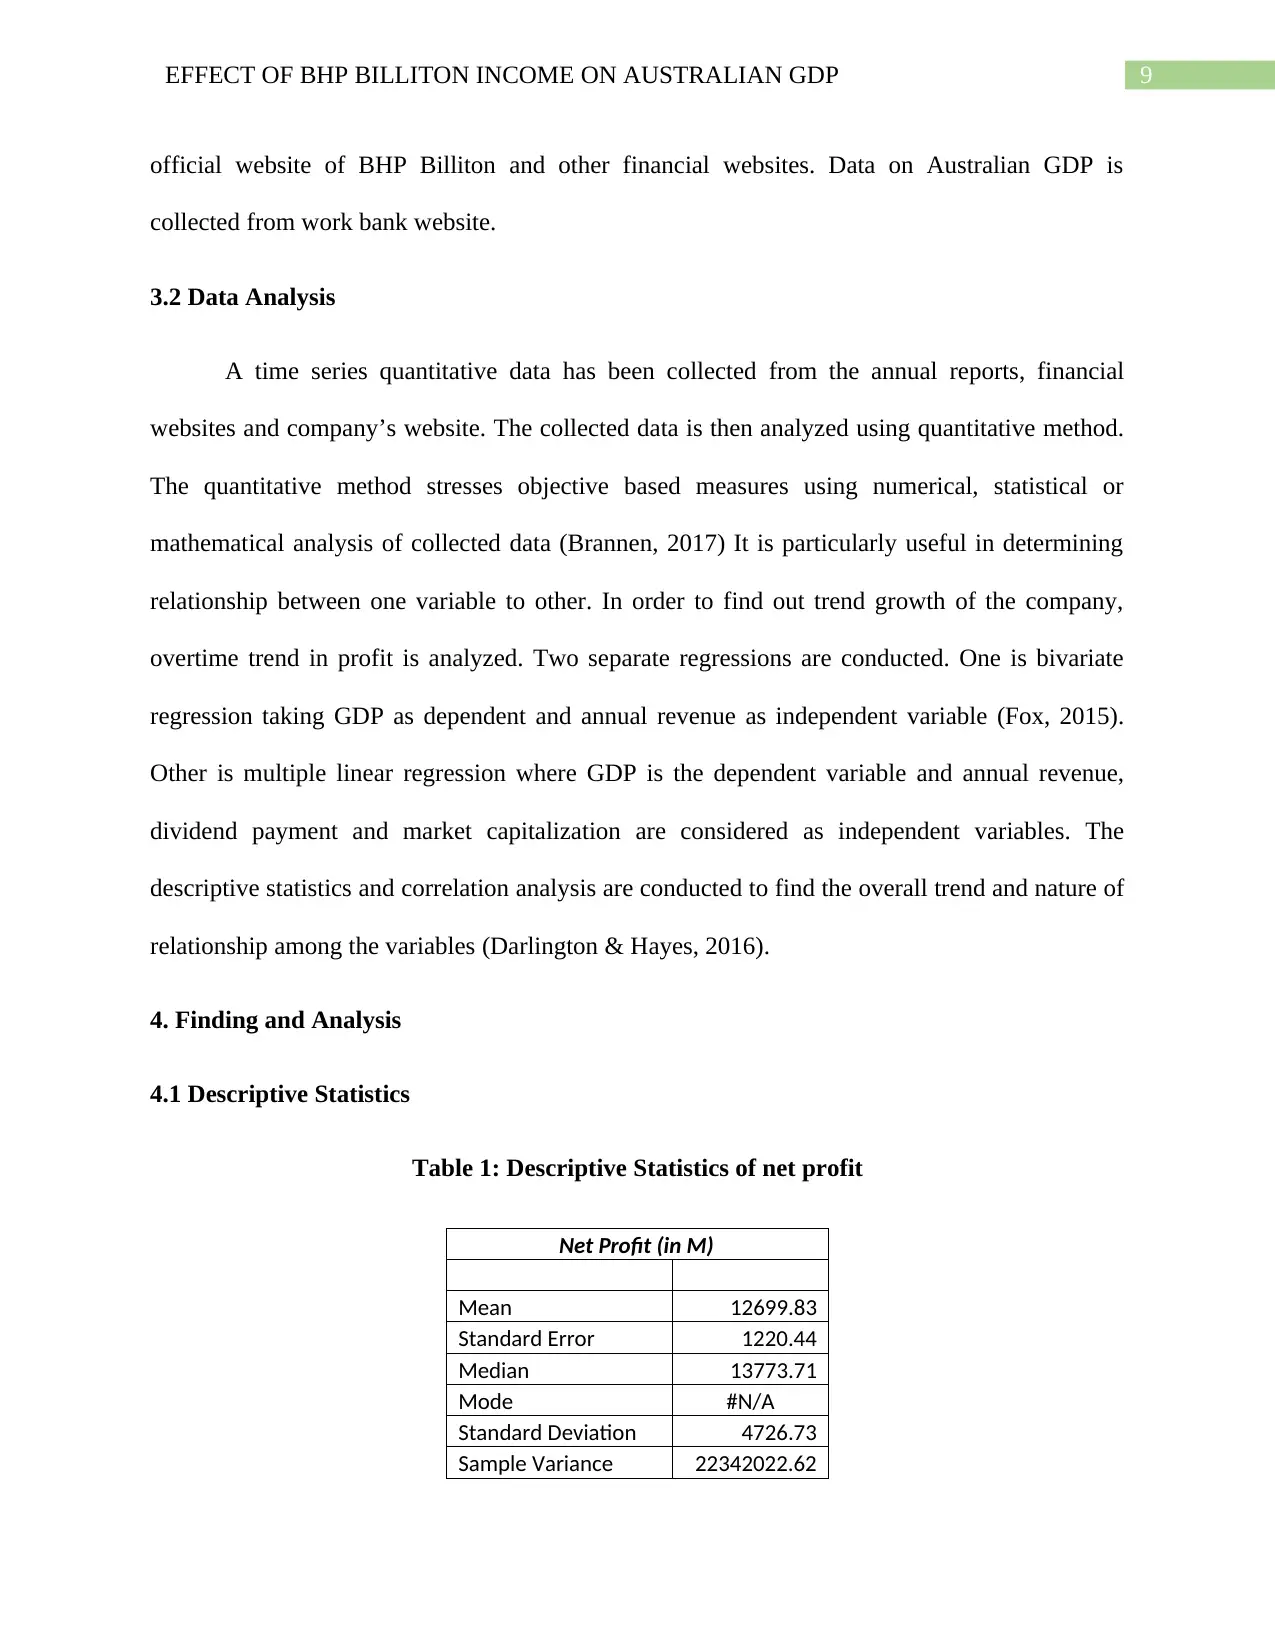
4.1 Descriptive Statistics
Table 1: Descriptive Statistics of net profit
Net Profit (in M)
Mean 12699.83
Standard Error 1220.44
Median 13773.71
Mode #N/A
Standard Deviation 4726.73
Sample Variance 22342022.62
official website of BHP Billiton and other financial websites. Data on Australian GDP is
collected from work bank website.
3.2 Data Analysis
A time series quantitative data has been collected from the annual reports, financial
websites and company’s website. The collected data is then analyzed using quantitative method.
The quantitative method stresses objective based measures using numerical, statistical or
mathematical analysis of collected data (Brannen, 2017) It is particularly useful in determining
relationship between one variable to other. In order to find out trend growth of the company,
overtime trend in profit is analyzed. Two separate regressions are conducted. One is bivariate
regression taking GDP as dependent and annual revenue as independent variable (Fox, 2015).
Other is multiple linear regression where GDP is the dependent variable and annual revenue,
dividend payment and market capitalization are considered as independent variables. The
descriptive statistics and correlation analysis are conducted to find the overall trend and nature of
relationship among the variables (Darlington & Hayes, 2016).
4. Finding and Analysis
4.1 Descriptive Statistics
Table 1: Descriptive Statistics of net profit
Net Profit (in M)
Mean 12699.83
Standard Error 1220.44
Median 13773.71
Mode #N/A
Standard Deviation 4726.73
Sample Variance 22342022.62
Paraphrase This Document
Need a fresh take? Get an instant paraphrase of this document with our AI Paraphraser
10EFFECT OF BHP BILLITON INCOME ON AUSTRALIAN GDP
Kurtosis 0.14
Skewness -0.65
Range 17593.98
Minimum 2875.34
Maximum 20469.32
Sum 190497.42
Count 15
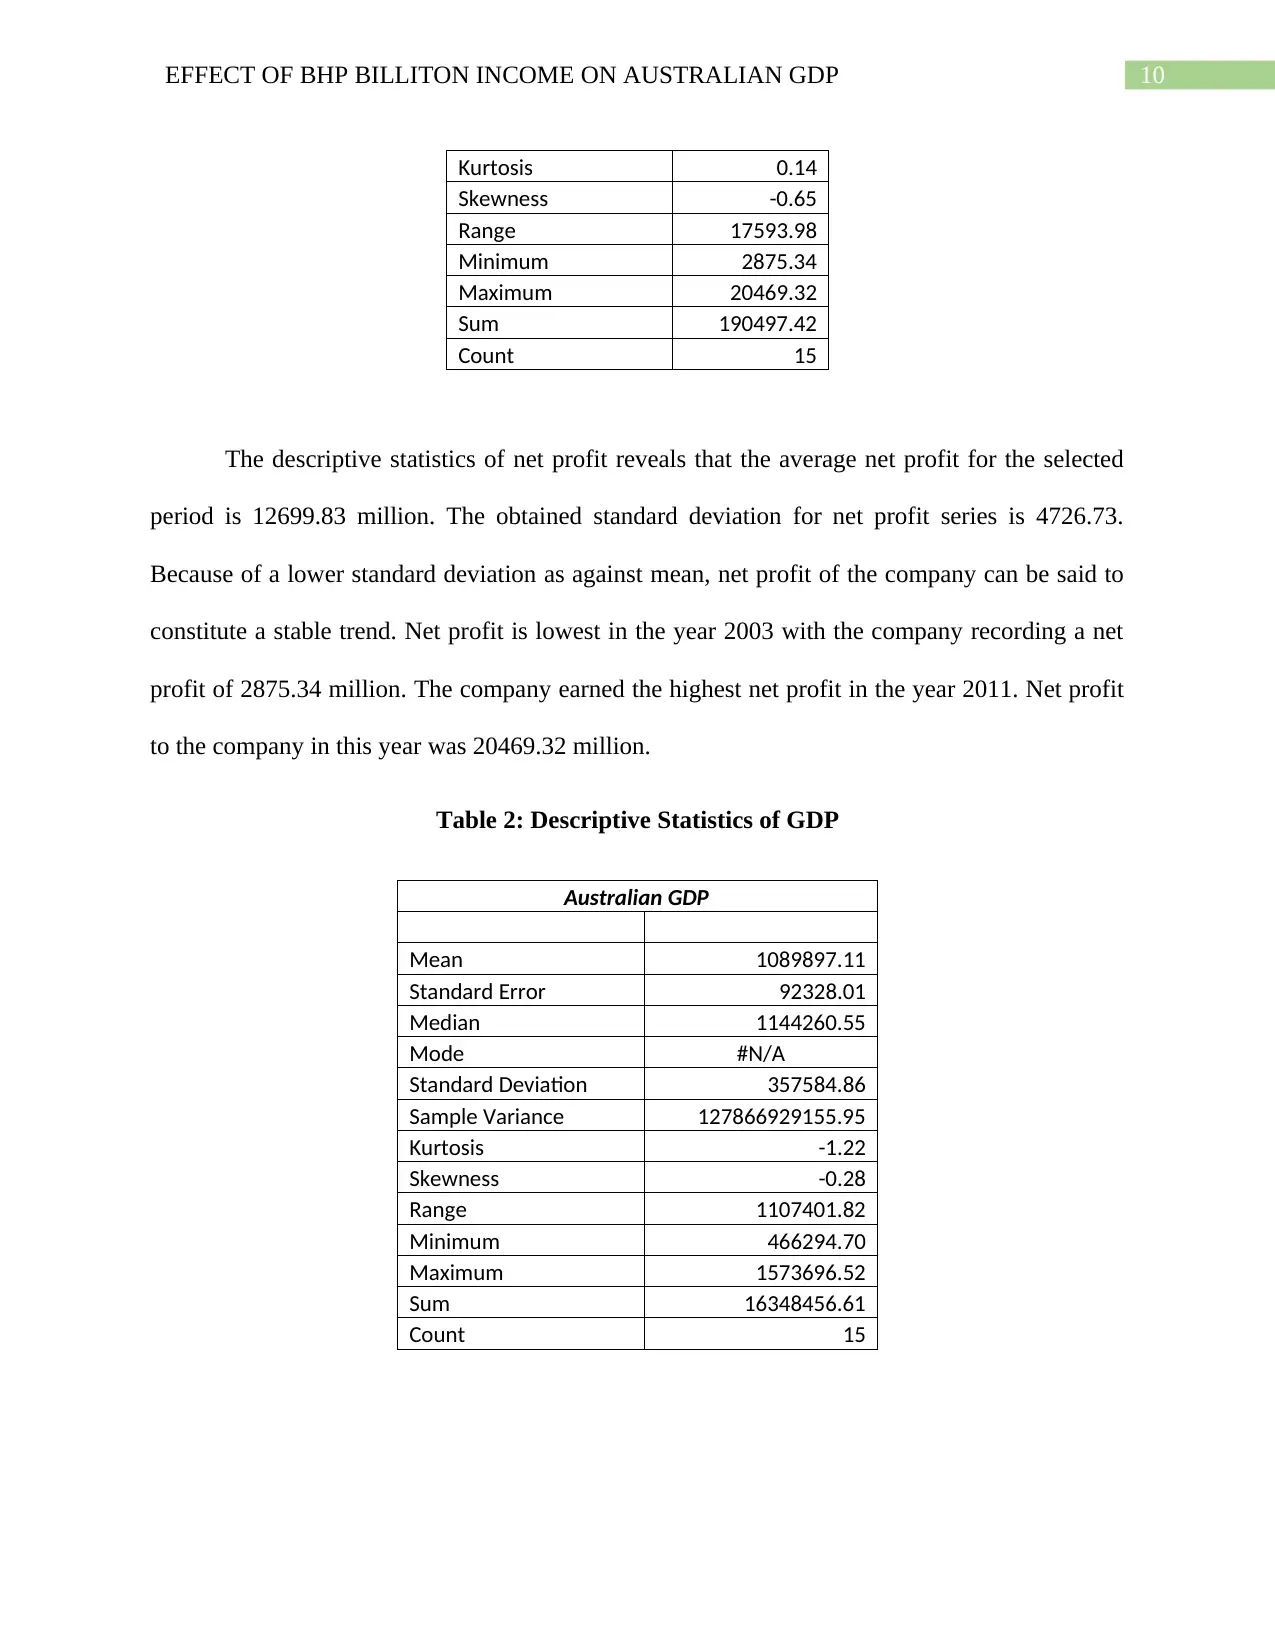
The descriptive statistics of net profit reveals that the average net profit for the selected
period is 12699.83 million. The obtained standard deviation for net profit series is 4726.73.
Because of a lower standard deviation as against mean, net profit of the company can be said to
constitute a stable trend. Net profit is lowest in the year 2003 with the company recording a net
profit of 2875.34 million. The company earned the highest net profit in the year 2011. Net profit
to the company in this year was 20469.32 million.
Table 2: Descriptive Statistics of GDP
Australian GDP
Mean 1089897.11
Standard Error 92328.01
Median 1144260.55
Mode #N/A
Standard Deviation 357584.86
Sample Variance 127866929155.95
Kurtosis -1.22
Skewness -0.28
Range 1107401.82
Minimum 466294.70
Maximum 1573696.52
Sum 16348456.61
Count 15
Kurtosis 0.14
Skewness -0.65
Range 17593.98
Minimum 2875.34
Maximum 20469.32
Sum 190497.42
Count 15
The descriptive statistics of net profit reveals that the average net profit for the selected
period is 12699.83 million. The obtained standard deviation for net profit series is 4726.73.
Because of a lower standard deviation as against mean, net profit of the company can be said to
constitute a stable trend. Net profit is lowest in the year 2003 with the company recording a net
profit of 2875.34 million. The company earned the highest net profit in the year 2011. Net profit
to the company in this year was 20469.32 million.
Table 2: Descriptive Statistics of GDP
Australian GDP
Mean 1089897.11
Standard Error 92328.01
Median 1144260.55
Mode #N/A
Standard Deviation 357584.86
Sample Variance 127866929155.95
Kurtosis -1.22
Skewness -0.28
Range 1107401.82
Minimum 466294.70
Maximum 1573696.52
Sum 16348456.61
Count 15
11EFFECT OF BHP BILLITON INCOME ON AUSTRALIAN GDP
The descriptive statistics of Australian GDP shows that average GDP of Australia for the
selected period is 1089897.11 million. The obtained standard deviation for GDP series is
357584.86. Because of a lower standard deviation as against mean, GDP of Australia can be said
to constitute a stable trend. Australia accounted the lowest GDP in the year 2003 with GDP of
the year being 466294.70 million. The economy recorded the highest GDP in the year 2013.
GDP of Australia in this year was 1573696.52 million.
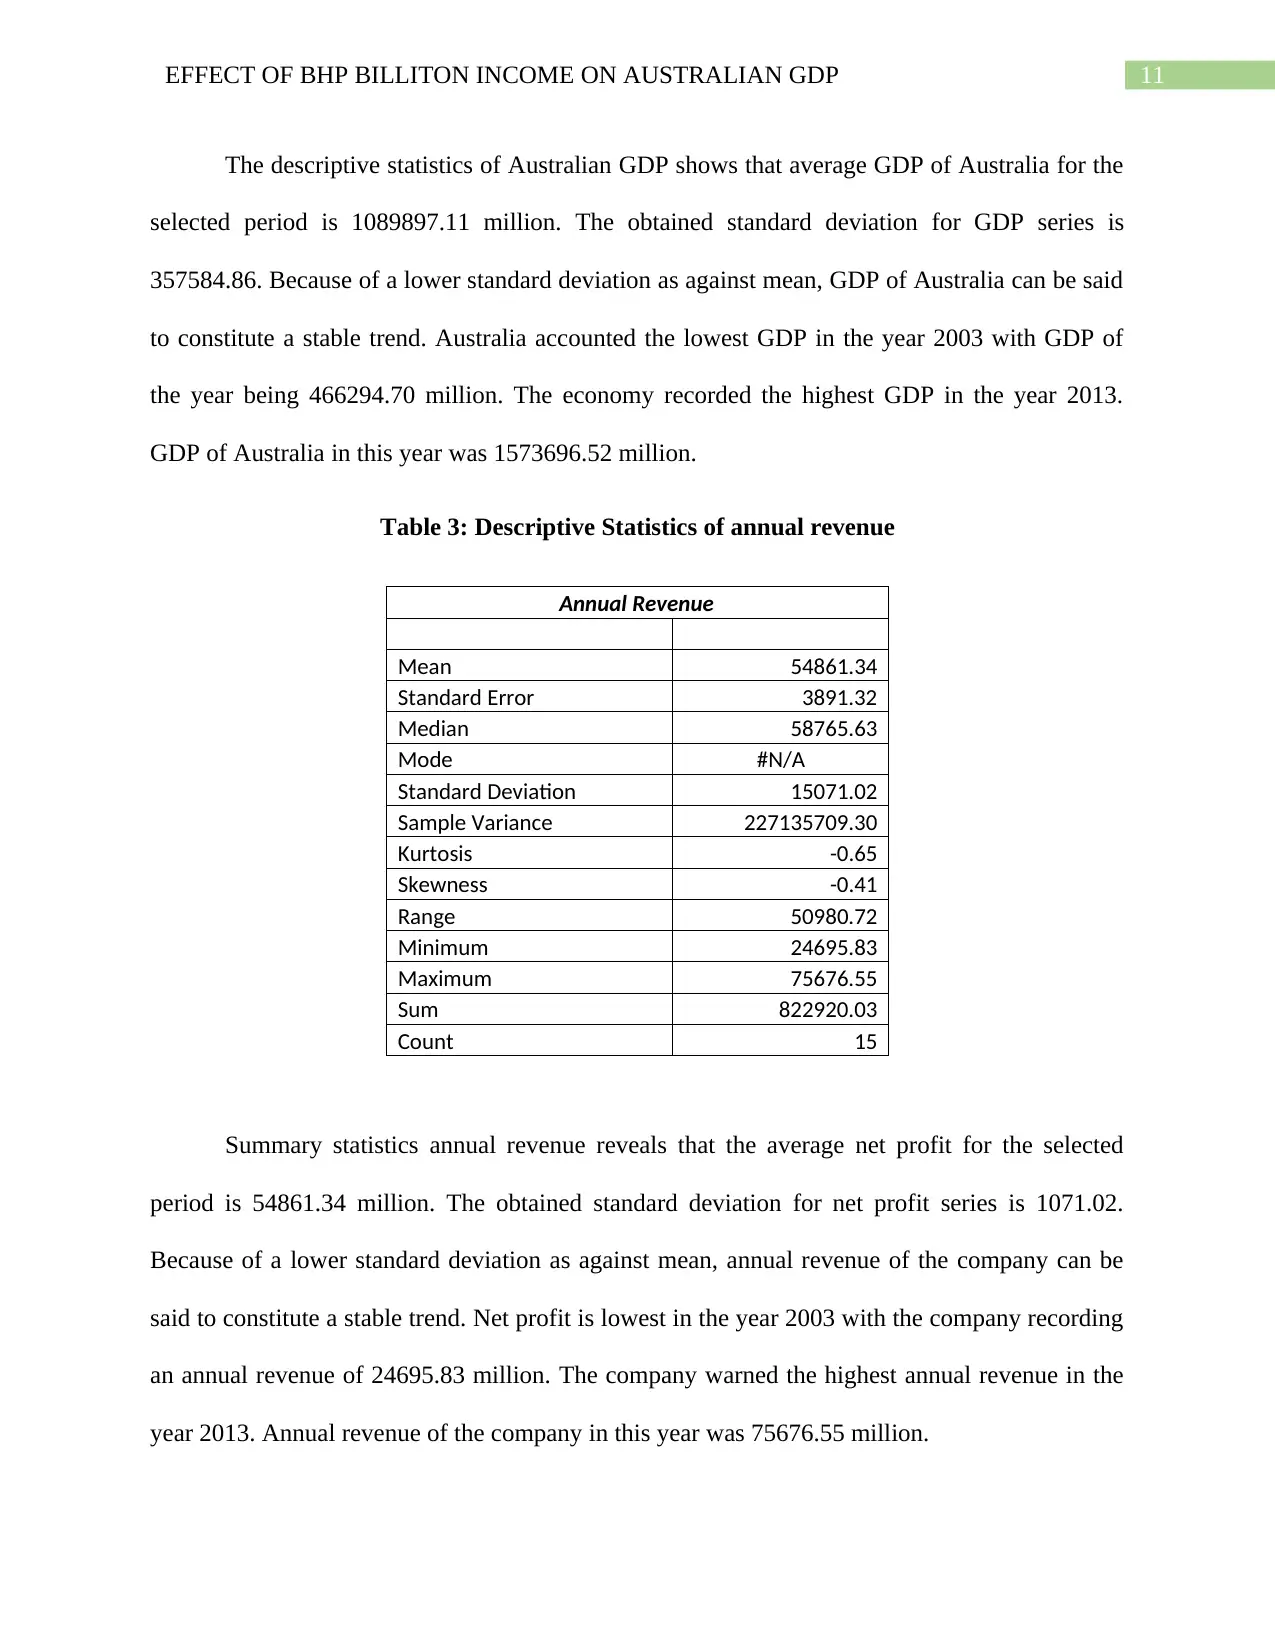
Table 3: Descriptive Statistics of annual revenue
Annual Revenue
Mean 54861.34
Standard Error 3891.32
Median 58765.63
Mode #N/A
Standard Deviation 15071.02
Sample Variance 227135709.30
Kurtosis -0.65
Skewness -0.41
Range 50980.72
Minimum 24695.83
Maximum 75676.55
Sum 822920.03
Count 15
Summary statistics annual revenue reveals that the average net profit for the selected
period is 54861.34 million. The obtained standard deviation for net profit series is 1071.02.
Because of a lower standard deviation as against mean, annual revenue of the company can be
said to constitute a stable trend. Net profit is lowest in the year 2003 with the company recording
an annual revenue of 24695.83 million. The company warned the highest annual revenue in the
year 2013. Annual revenue of the company in this year was 75676.55 million.
The descriptive statistics of Australian GDP shows that average GDP of Australia for the
selected period is 1089897.11 million. The obtained standard deviation for GDP series is
357584.86. Because of a lower standard deviation as against mean, GDP of Australia can be said
to constitute a stable trend. Australia accounted the lowest GDP in the year 2003 with GDP of
the year being 466294.70 million. The economy recorded the highest GDP in the year 2013.
GDP of Australia in this year was 1573696.52 million.
Table 3: Descriptive Statistics of annual revenue
Annual Revenue
Mean 54861.34
Standard Error 3891.32
Median 58765.63
Mode #N/A
Standard Deviation 15071.02
Sample Variance 227135709.30
Kurtosis -0.65
Skewness -0.41
Range 50980.72
Minimum 24695.83
Maximum 75676.55
Sum 822920.03
Count 15
Summary statistics annual revenue reveals that the average net profit for the selected
period is 54861.34 million. The obtained standard deviation for net profit series is 1071.02.
Because of a lower standard deviation as against mean, annual revenue of the company can be
said to constitute a stable trend. Net profit is lowest in the year 2003 with the company recording
an annual revenue of 24695.83 million. The company warned the highest annual revenue in the
year 2013. Annual revenue of the company in this year was 75676.55 million.
⊘ This is a preview!⊘
Do you want full access?
Subscribe today to unlock all pages.
Trusted by 1+ million students worldwide
1 out of 23
Related Documents


Your All-in-One AI-Powered Toolkit for Academic Success.
+13062052269
info@desklib.com
Available 24*7 on WhatsApp / Email
![[object Object]](/_next/static/media/star-bottom.7253800d.svg)
Unlock your academic potential
Copyright © 2020–2026 A2Z Services. All Rights Reserved. Developed and managed by ZUCOL.