MA609 Business Analytics: BHP Iron Ore Transportation Project

Verified

Added on  2022/10/31

|9
|2302
|142
Project
AI Summary
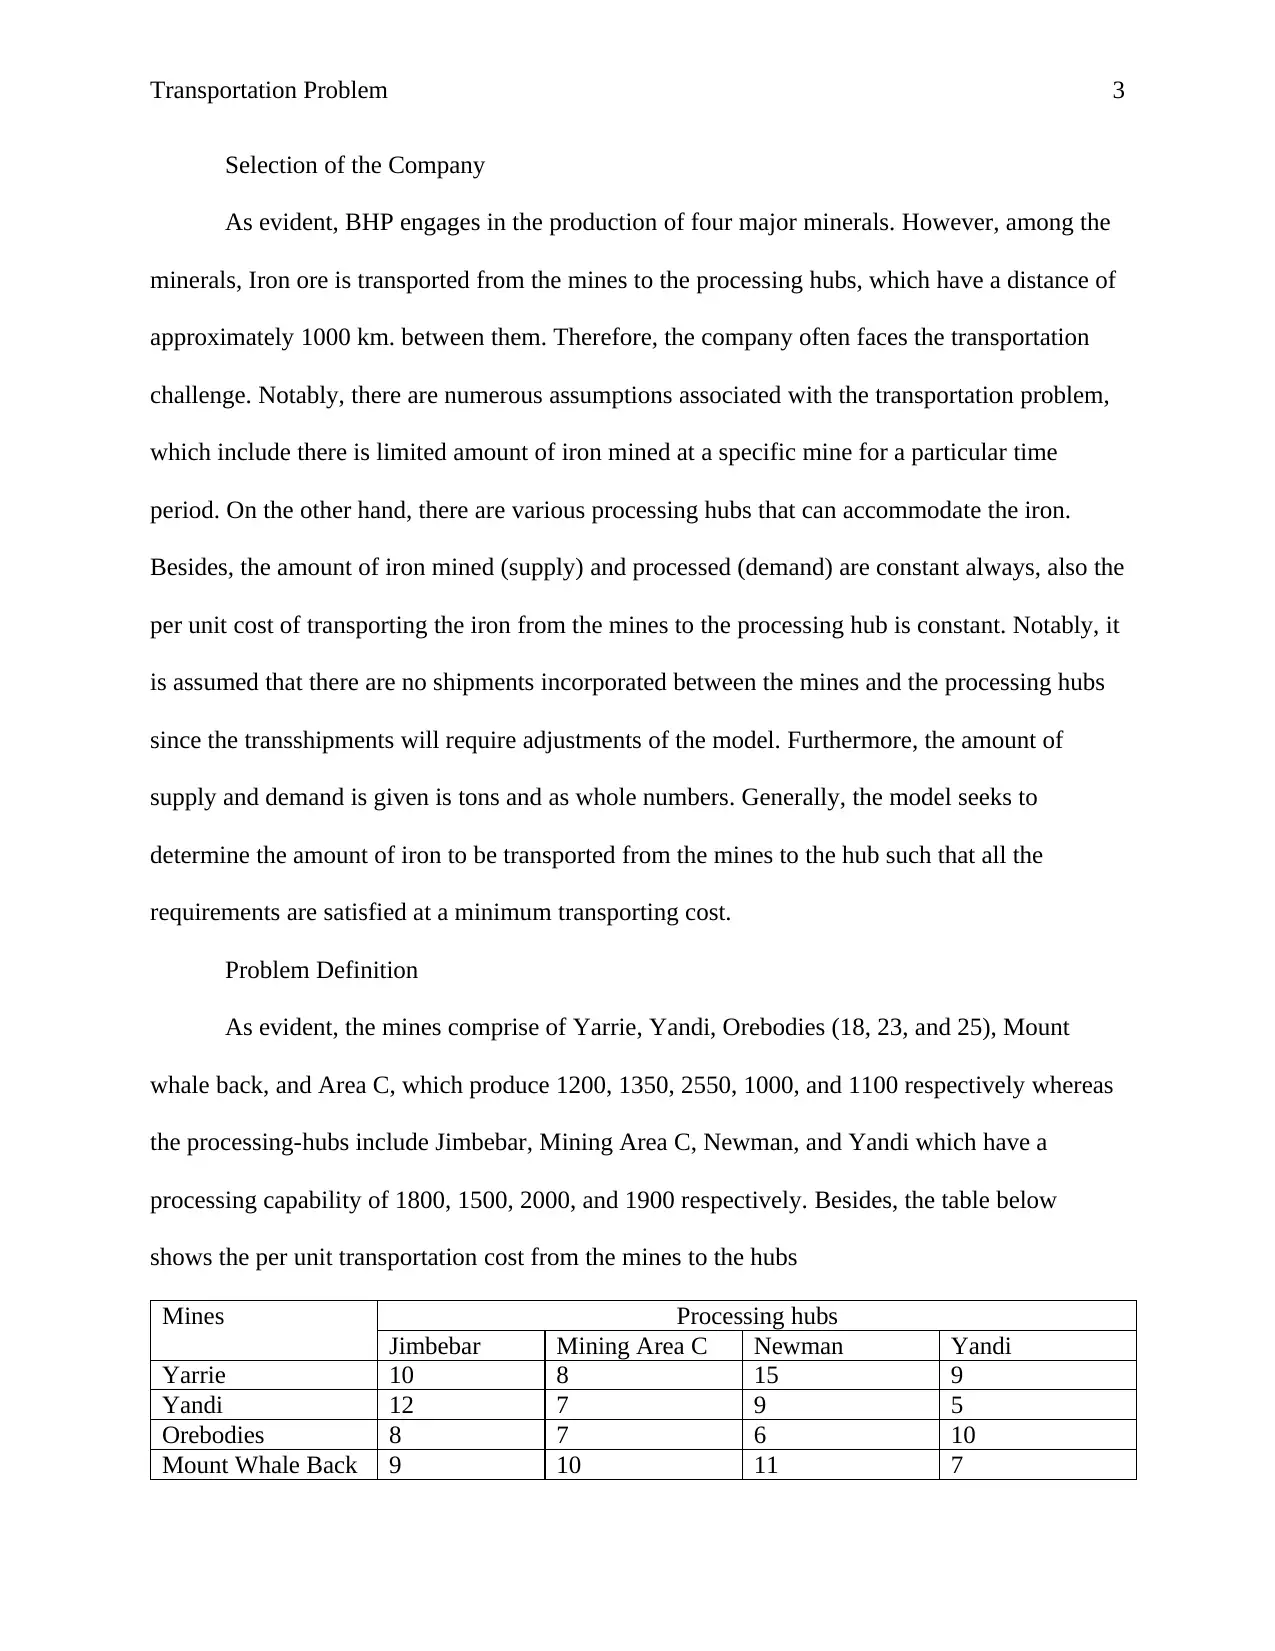
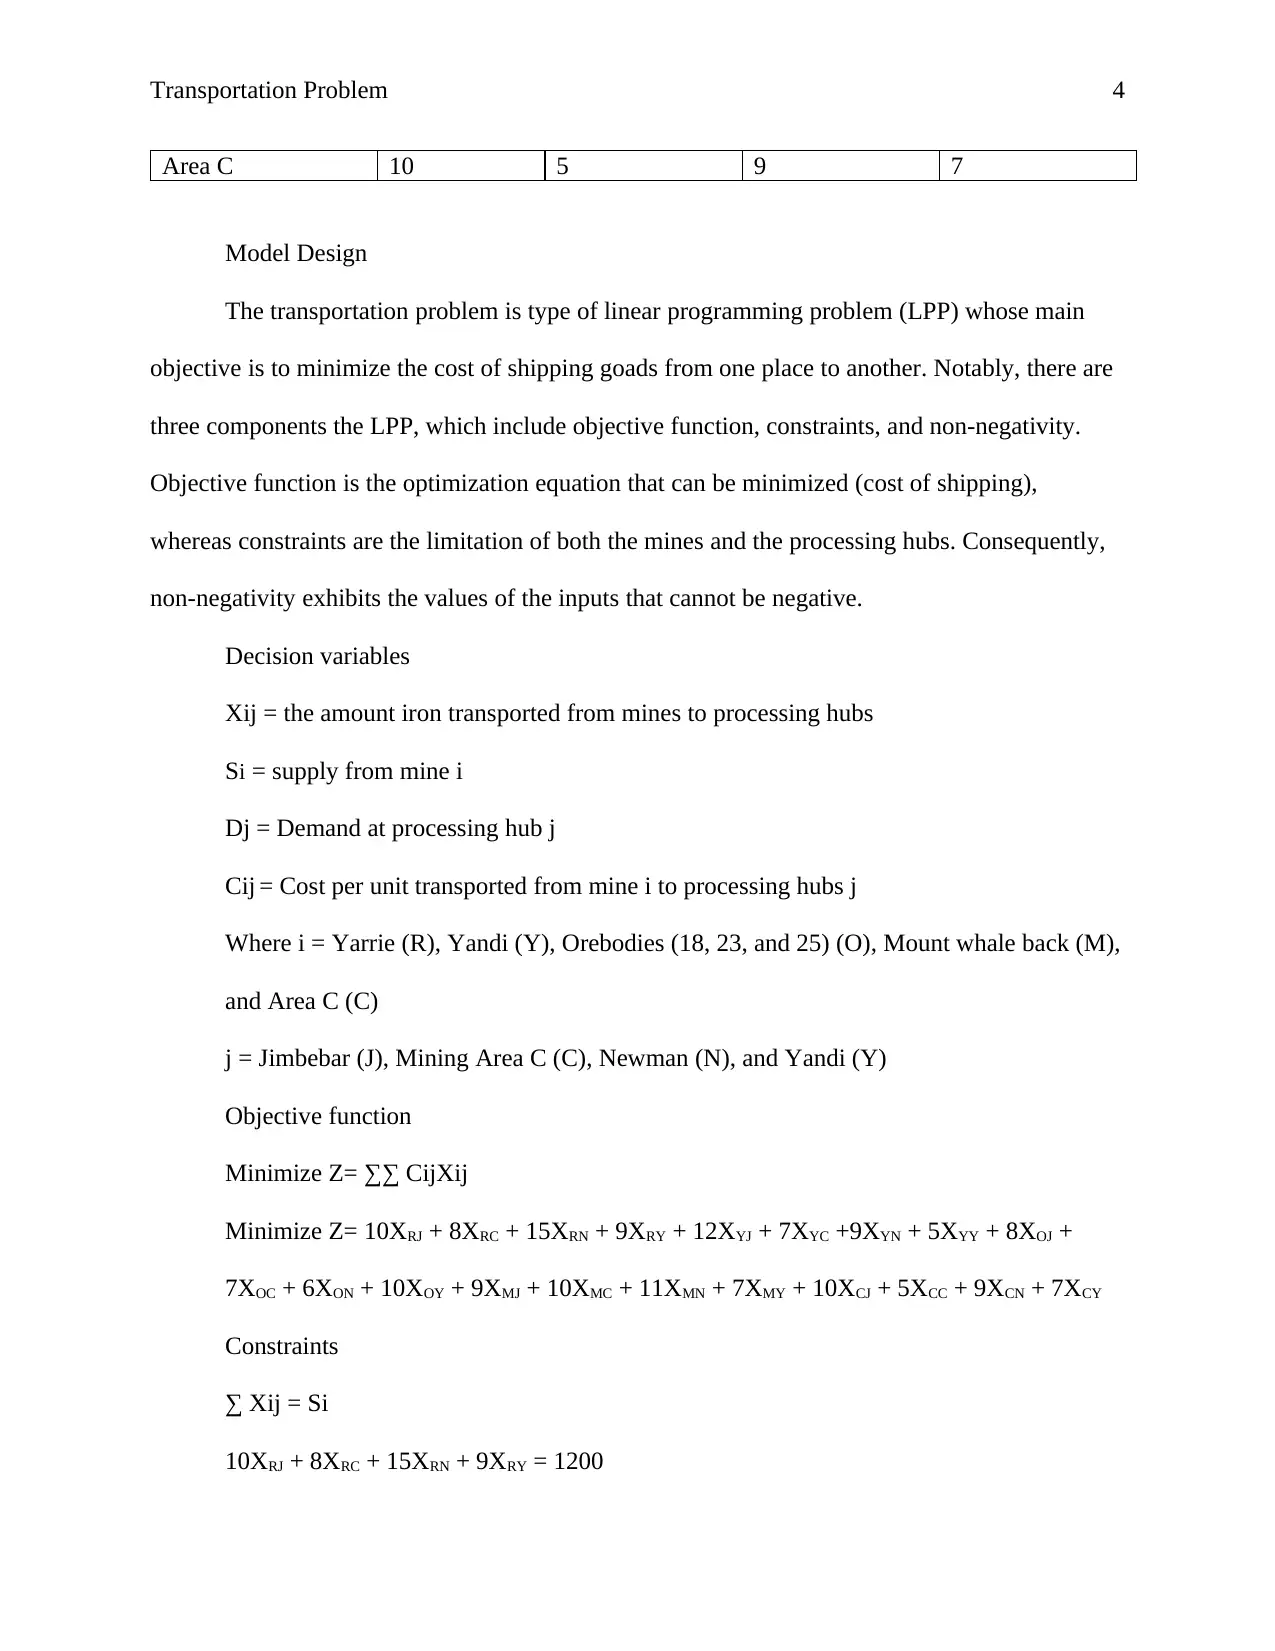
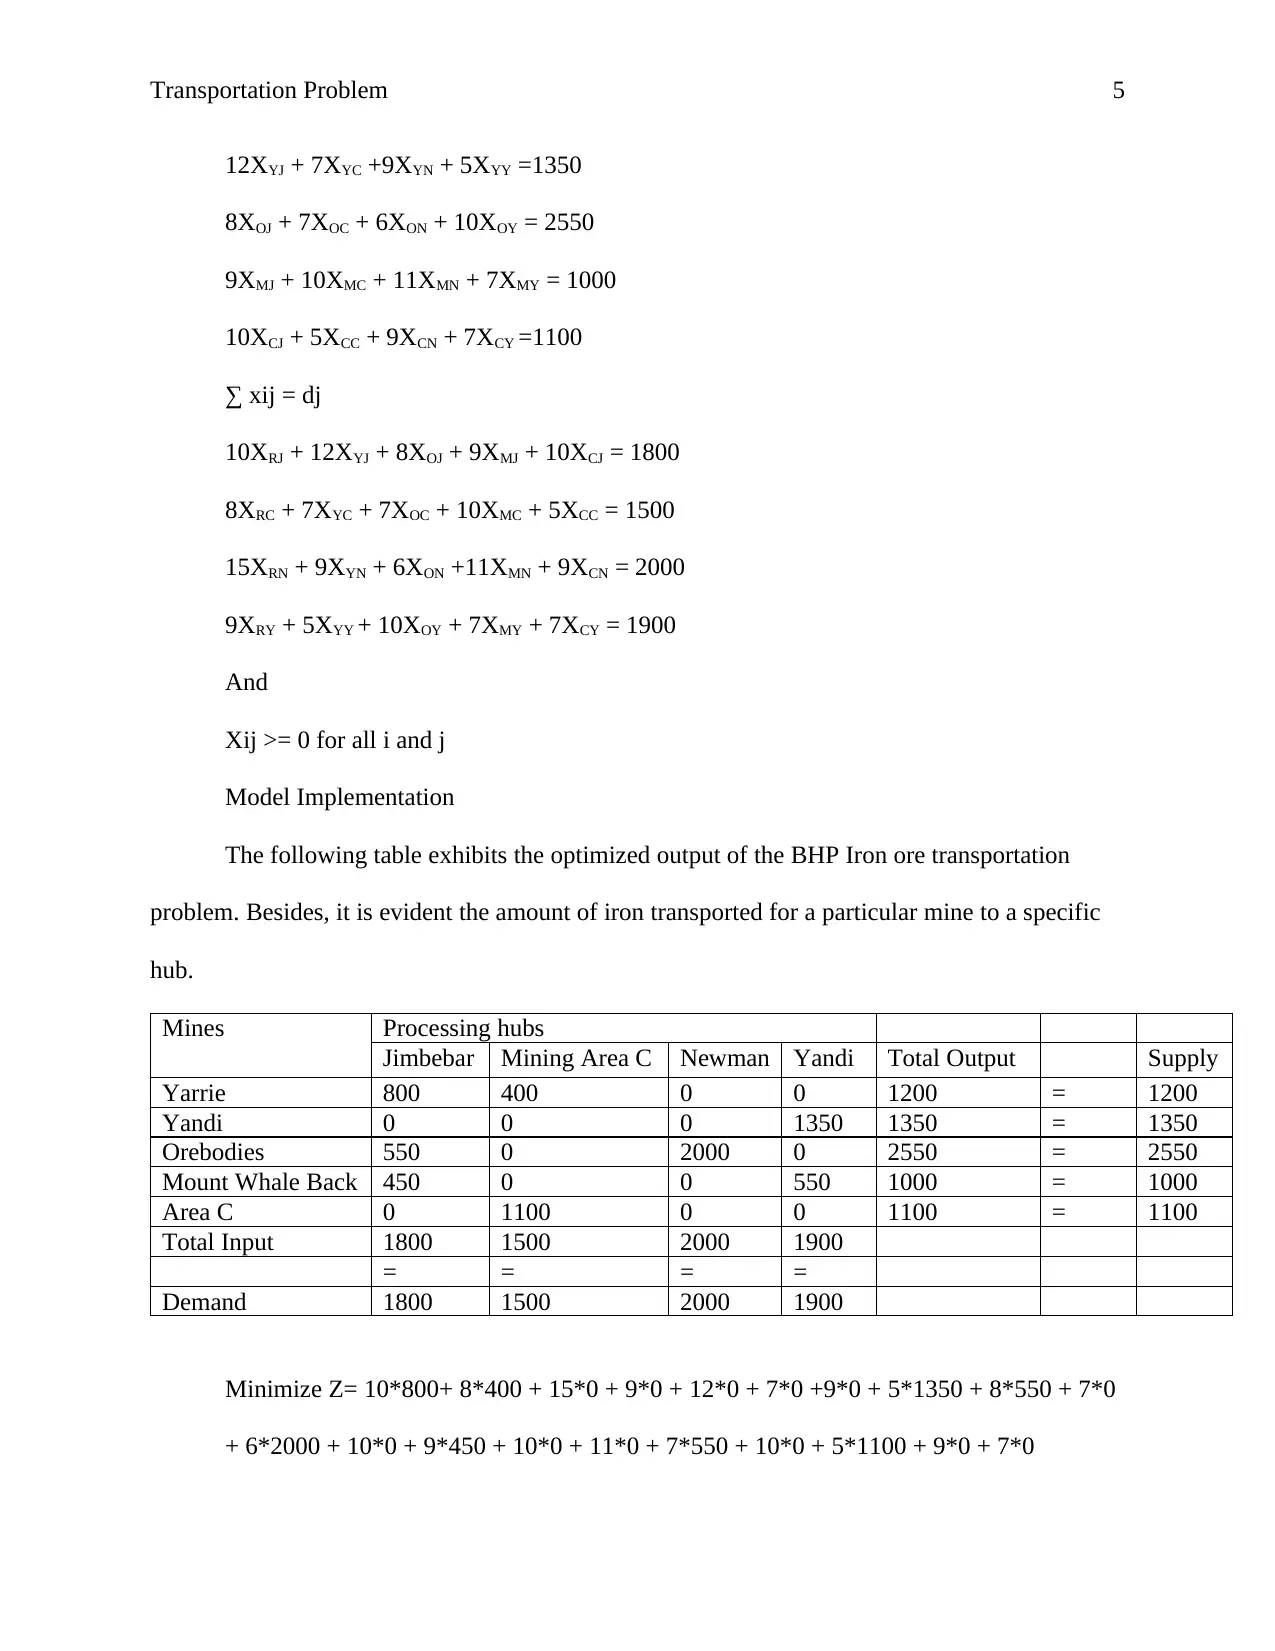
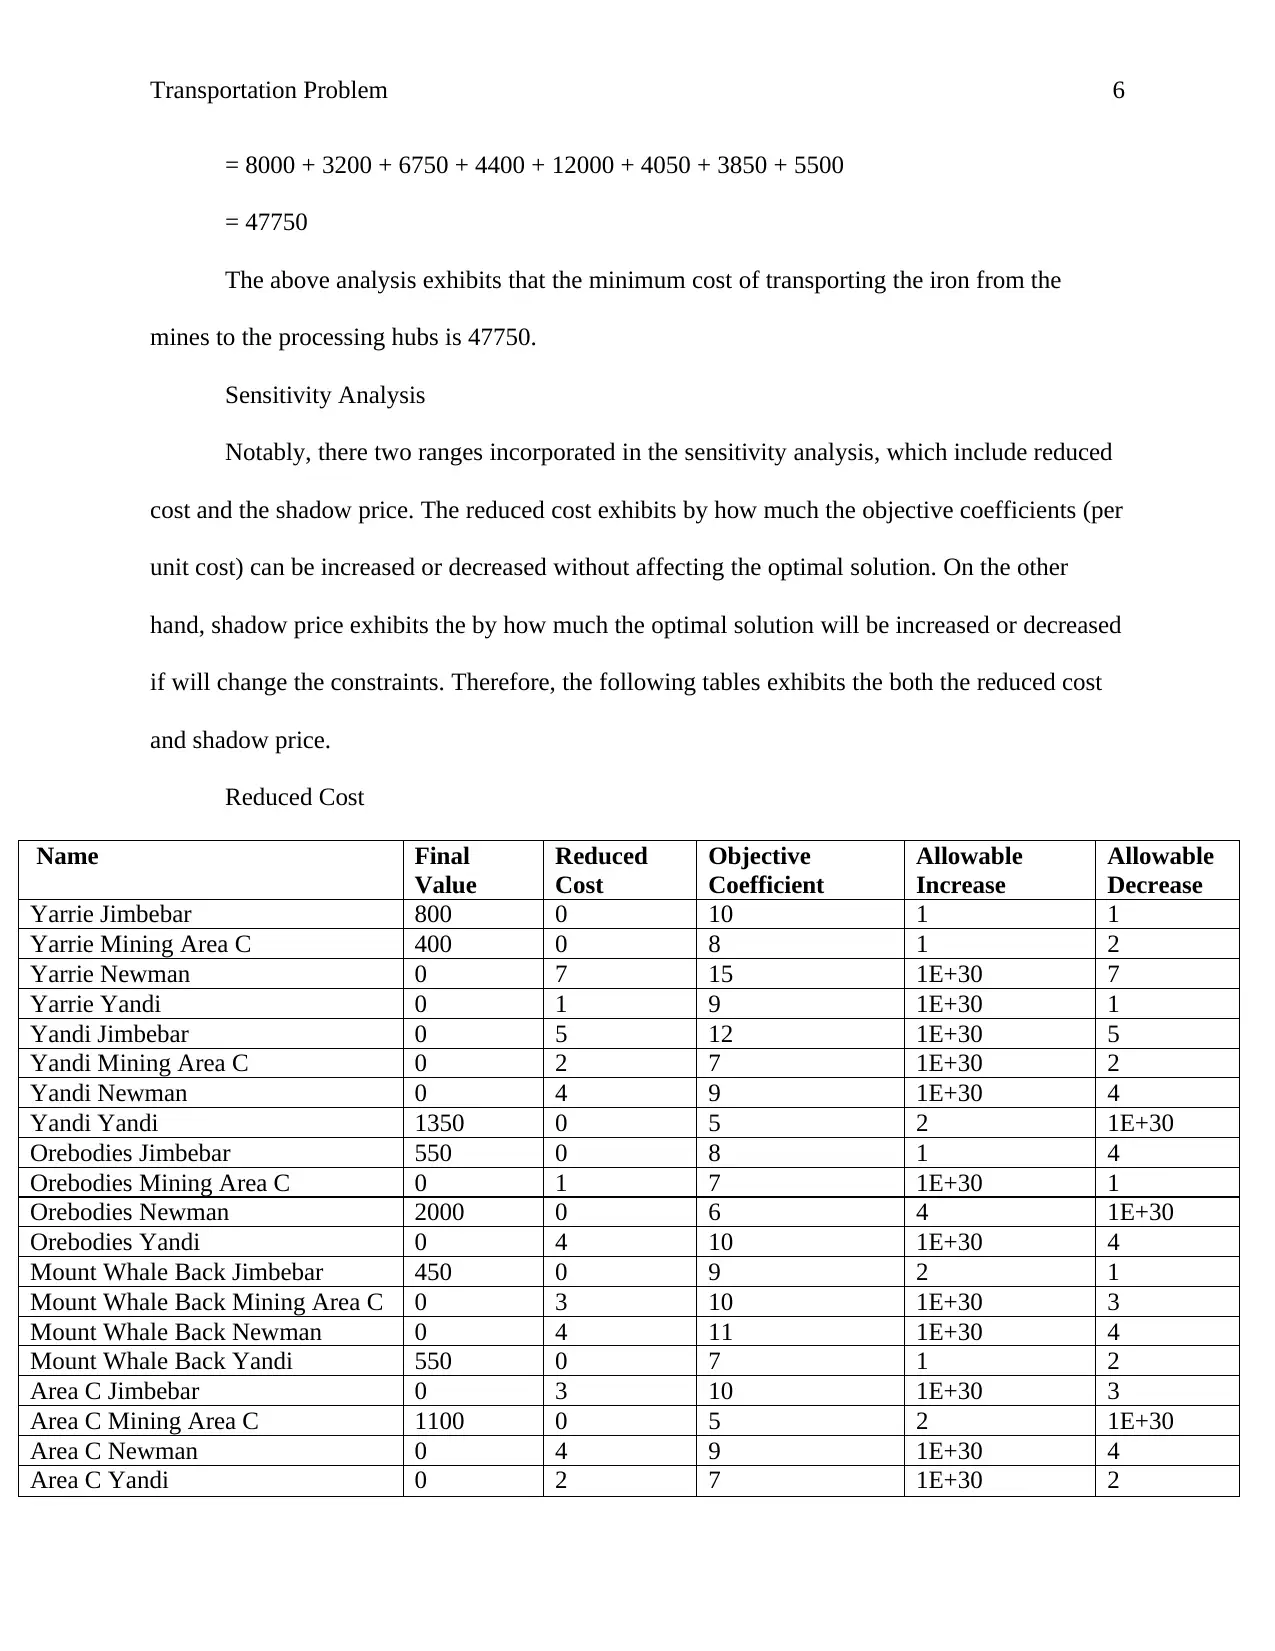
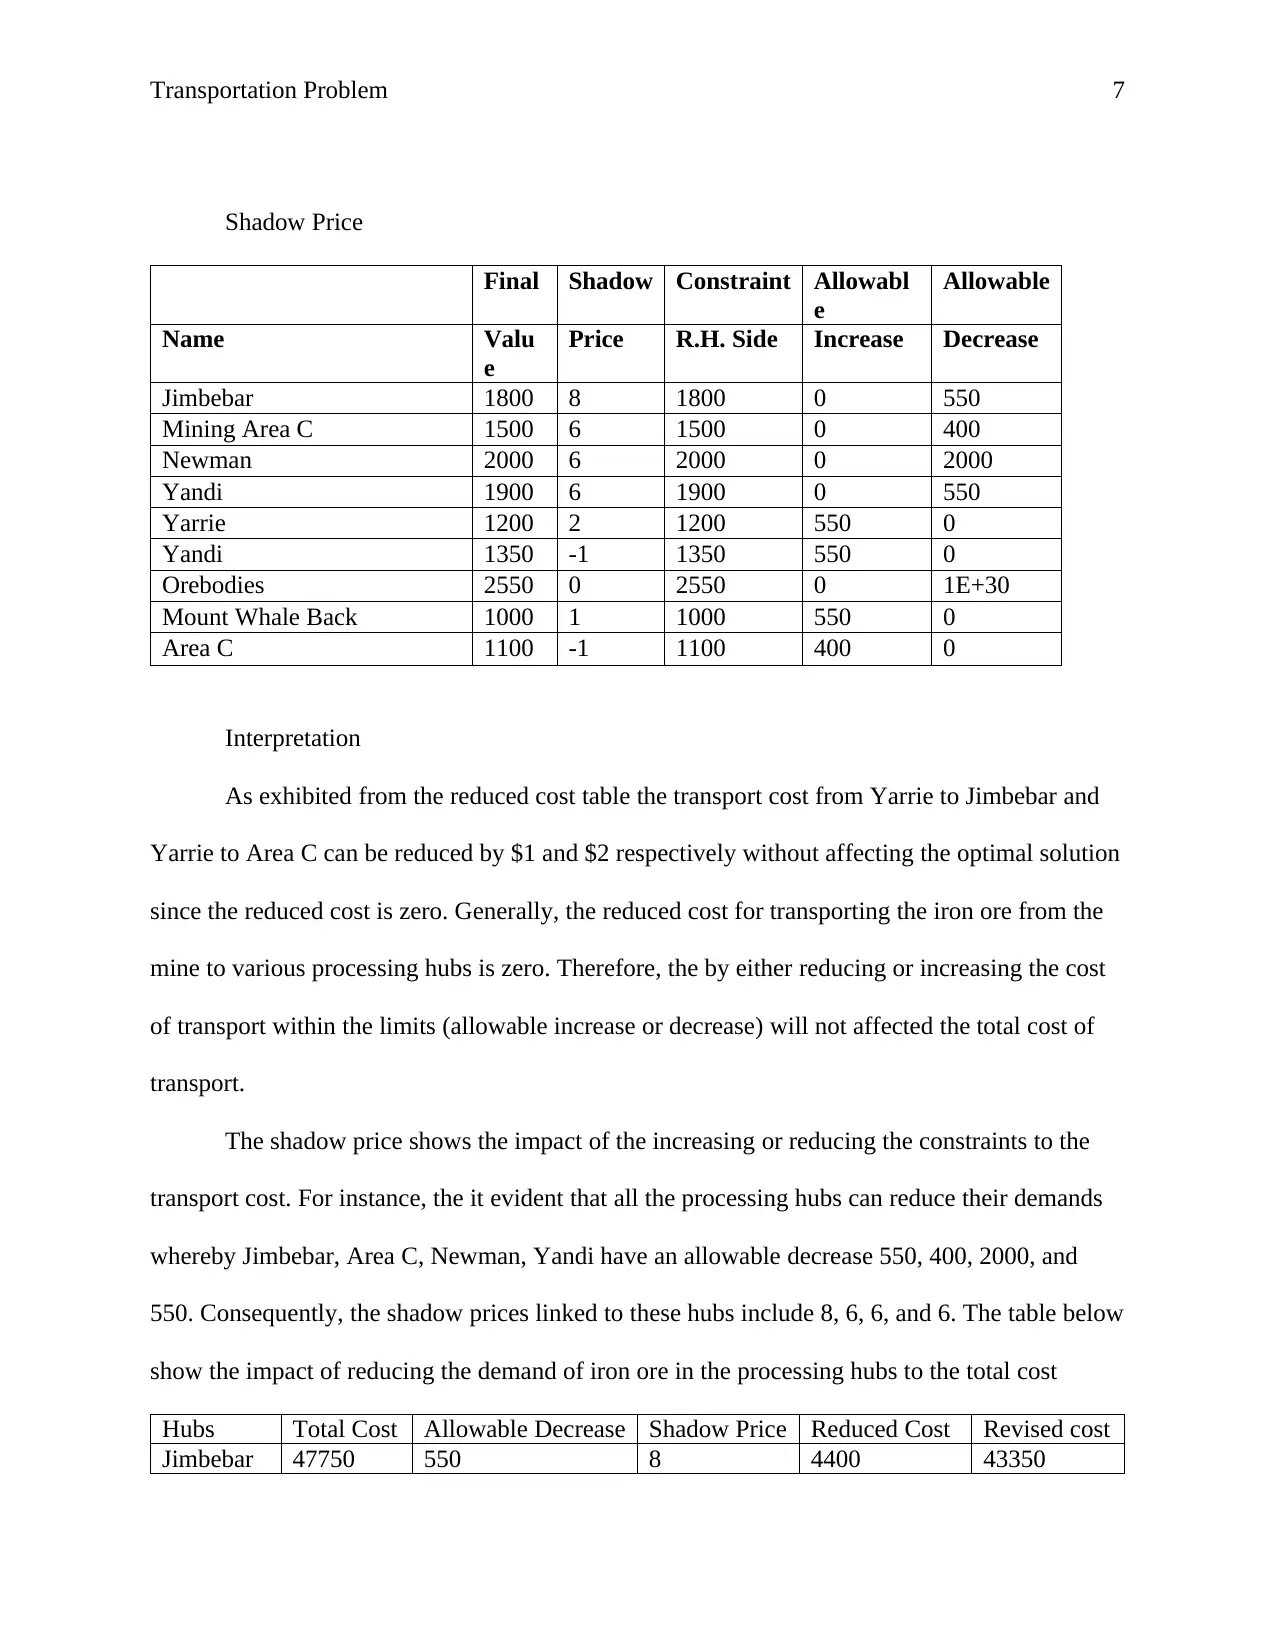
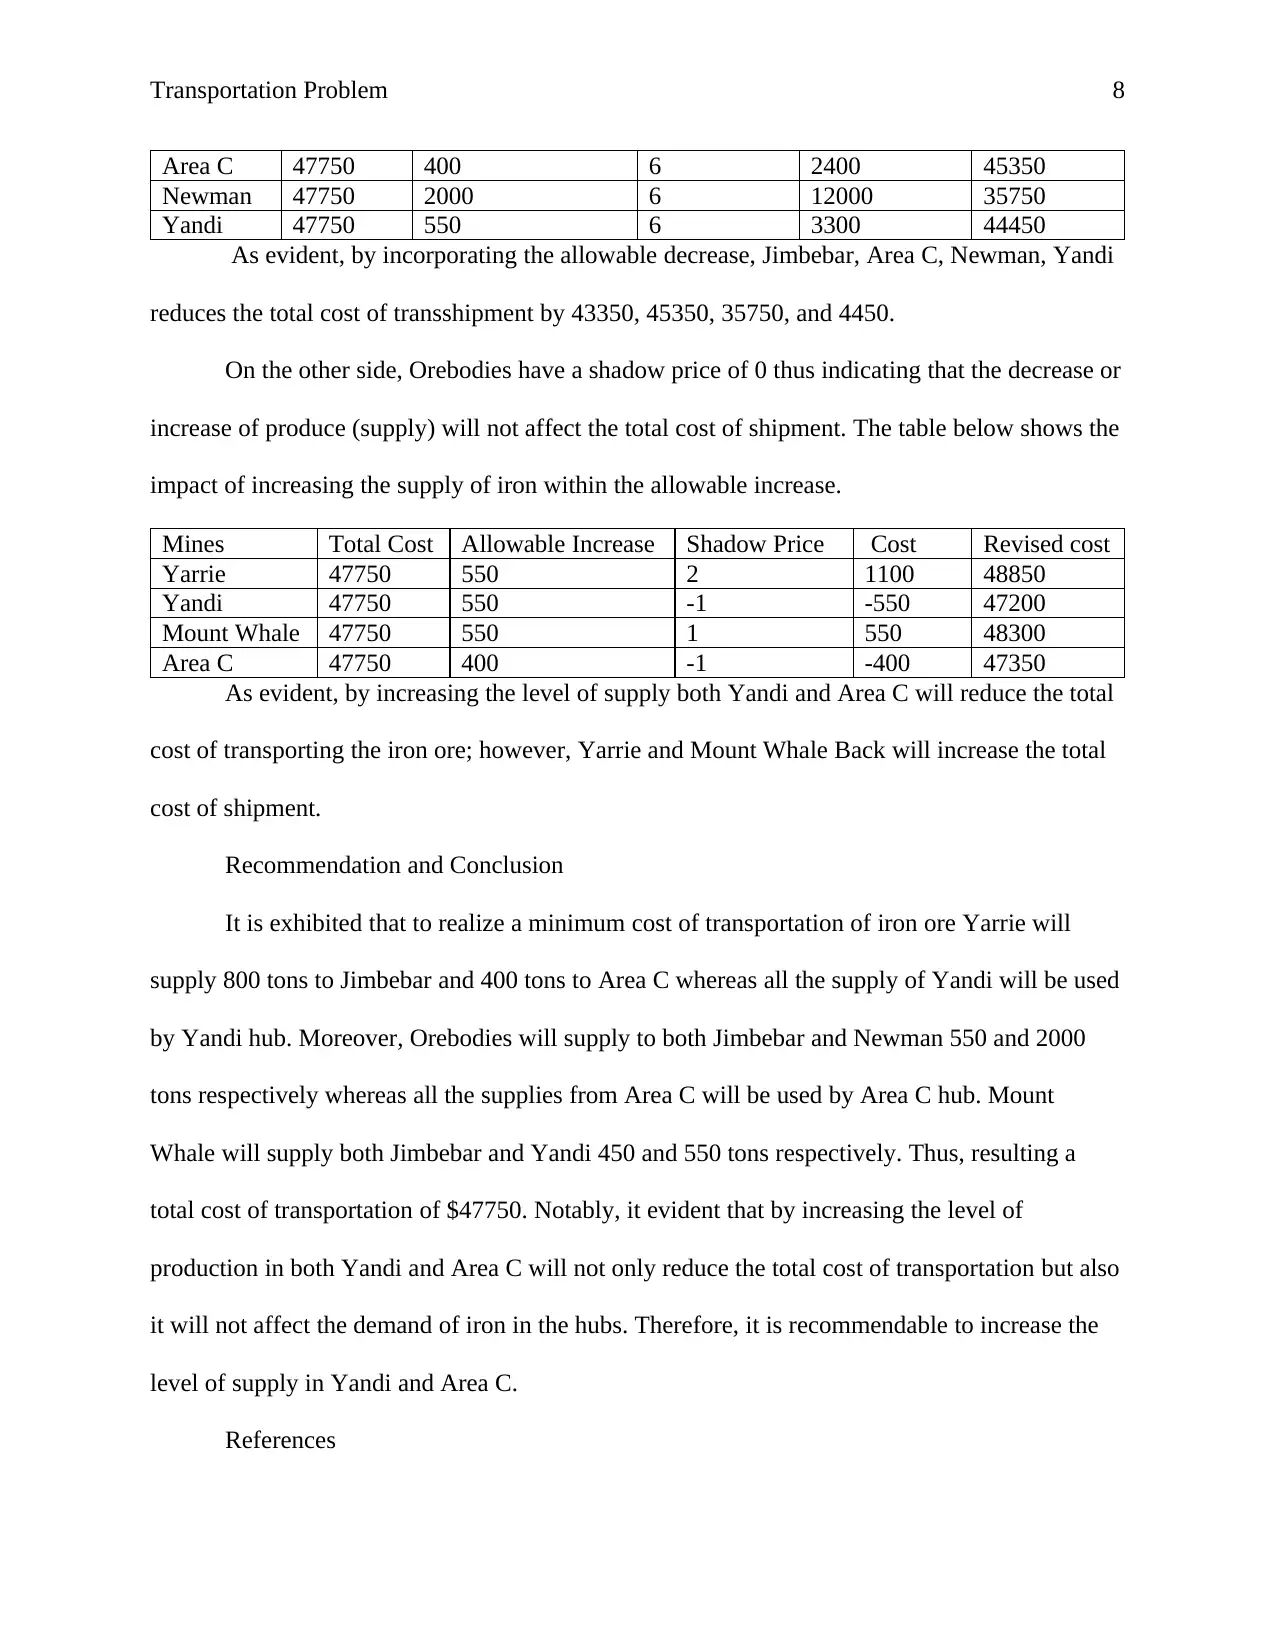
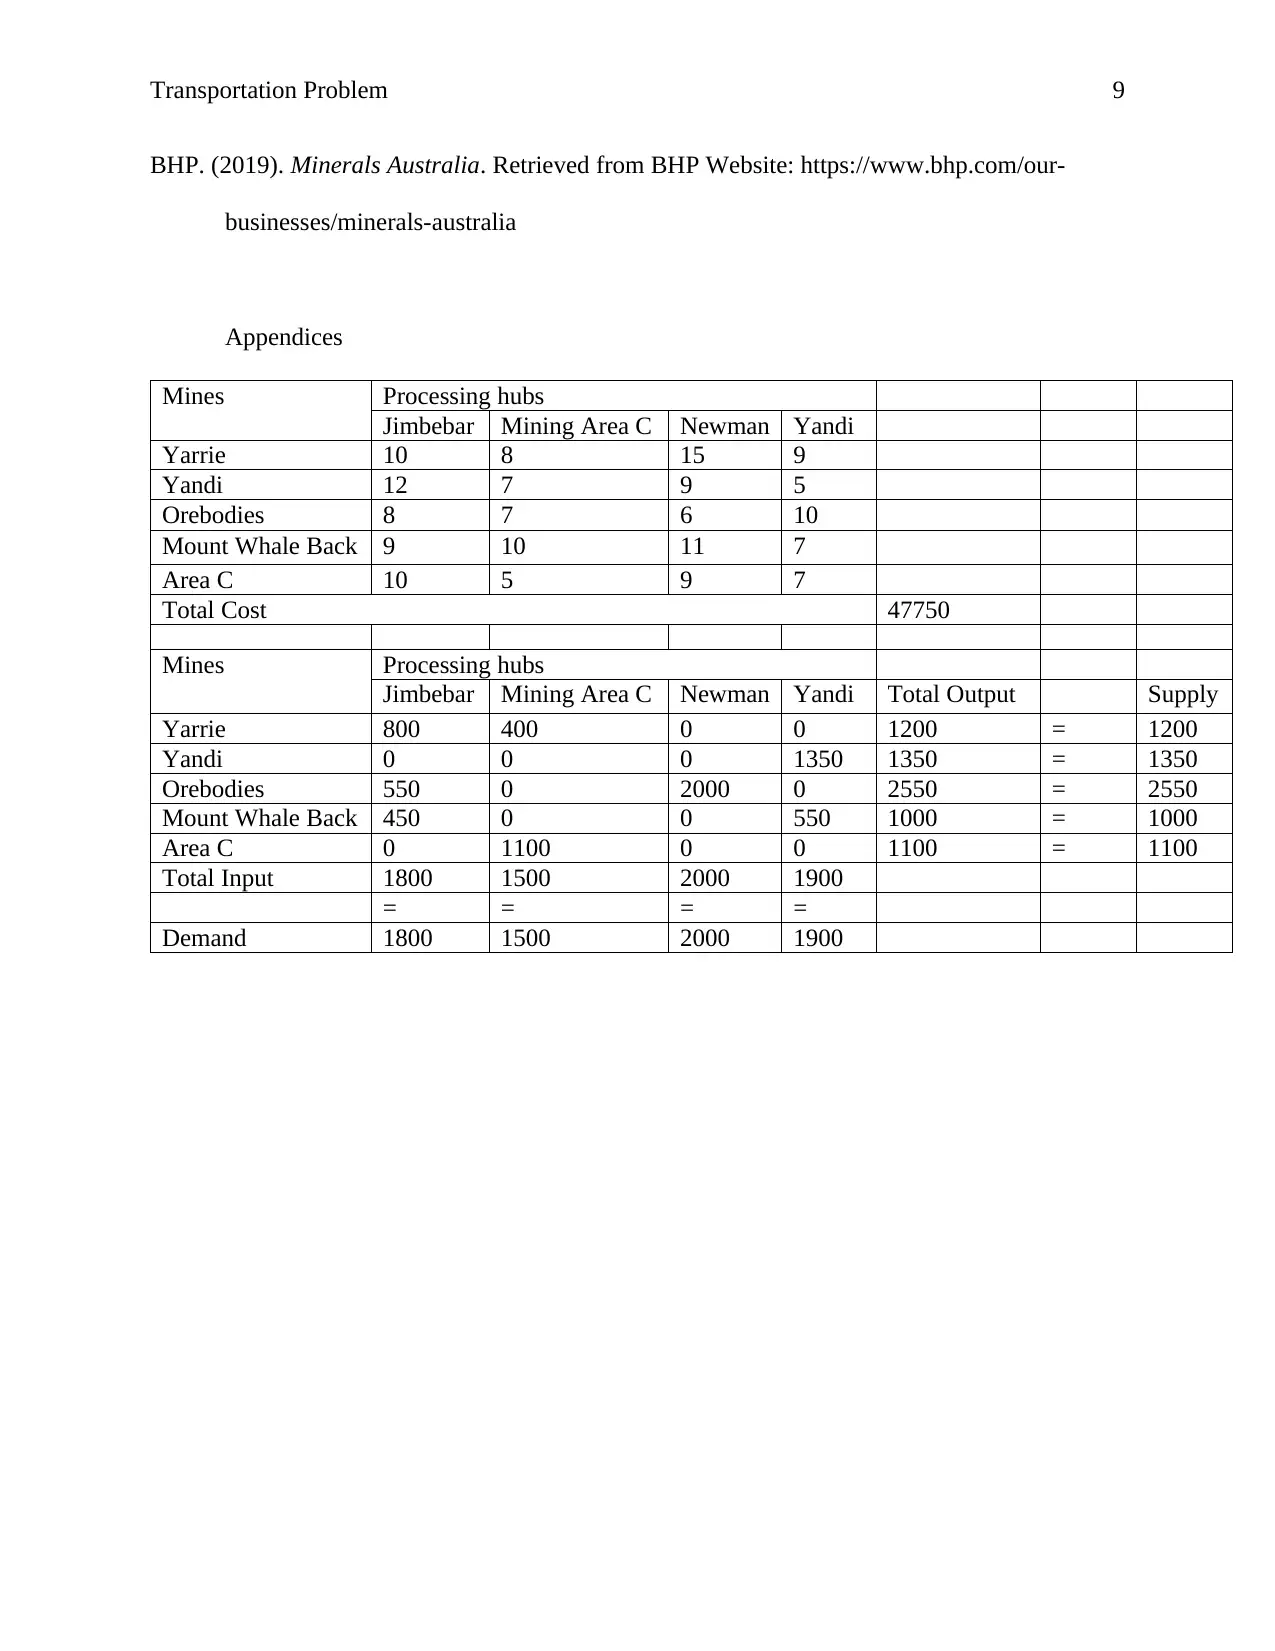
This project analyzes the transportation problem faced by BHP, a major mining company, in transporting iron ore from various mines to processing hubs. The assignment defines the problem, outlining the supply from mines, the demand at processing hubs, and the per-unit transportation costs. A linear programming model is designed and implemented to minimize the total transportation cost, determining the optimal amount of iron ore to be shipped from each mine to each hub. The solution presents the optimized output, including the quantities transported and the minimum cost of $47750. Furthermore, a sensitivity analysis is conducted, exploring reduced costs and shadow prices to assess the impact of changes in transportation costs and supply/demand constraints. Recommendations are provided, such as increasing the supply in certain mines to further reduce costs. The project concludes with a summary of the findings and references.
tabler-icon-diamond-filled.svg

Contribute Materials

Your contribution can guide someone’s learning journey. Share your documents today.
Document Page
Running header: Transportation Problem 1
BHP Transportation Problem
Name:
Institution:
tabler-icon-diamond-filled.svg

Secure Best Marks with AI Grader

Need help grading? Try our AI Grader for instant feedback on your assignments.
Document Page
Transportation Problem 2
Introduction
The BHP is one of the largest companies that involves in mining of minerals across the
globe whereby it has branches in at least 25 countries although the headquarter is located in
Melbourne, Australia. The company is as a result of a merger between Broken Hill Proprietary
and Billiton. Consequently, the company engages in numerous activities which includes
operations in Western Australia, Queensland, New South Wales and South Australia that focus
on iron ore, copper, coal and nickel. The main source of copper is the Olympic Dam located 560
km north of Adelaide (BHP, 2019). Notably, the Dam comprises of underground and surface
activities that operates a complete integrated processing facility from ore to metal. The
processing plants comprise of two grinding systems that use the floatation extraction process to
extract high-quality copper concentrate from the Sulphide ore.
The main source of Iron ore is the Western Australian Iron Ore (WAIO) which contains
an integrated system of four processing hubs and five mines connected by more than 1000 km of
rail and port infrastructure in the Pilbara region of northern Western Australia (BHP, 2019). The
processing-hubs include Jimbebar, Mining Area C, Newman, and Yandi whereas the mines
comprise of Yarrie, Yandi, Orebodies (18, 23, and 25), Mount whale back, and Area C.
Consequently, the main BHP source of coal is the Queensland Coal, which comprises of BHP
Mitsubishi Alliance (BMA) and Mitsui Coal (BMC). Notably, both BMA and BMC are partially
owned by the BHP, whereby BMA is owned 50:50 by BHP and Mitsubishi whereas BMC is
owned 80:20 BHP and Mitsui respectively. The nickel major source of nickel is located in
Western Australia known as Nickel West. Notably, Nickel West is a complete integrated system
(mine to market), whereby all operations, which include mines, concentration, smelter, and
refinery are located in Western Australia (BHP, 2019).
Document Page
Transportation Problem 3
Selection of the Company
As evident, BHP engages in the production of four major minerals. However, among the
minerals, Iron ore is transported from the mines to the processing hubs, which have a distance of
approximately 1000 km. between them. Therefore, the company often faces the transportation
challenge. Notably, there are numerous assumptions associated with the transportation problem,
which include there is limited amount of iron mined at a specific mine for a particular time
period. On the other hand, there are various processing hubs that can accommodate the iron.
Besides, the amount of iron mined (supply) and processed (demand) are constant always, also the
per unit cost of transporting the iron from the mines to the processing hub is constant. Notably, it
is assumed that there are no shipments incorporated between the mines and the processing hubs
since the transshipments will require adjustments of the model. Furthermore, the amount of
supply and demand is given is tons and as whole numbers. Generally, the model seeks to
determine the amount of iron to be transported from the mines to the hub such that all the
requirements are satisfied at a minimum transporting cost.
Problem Definition
As evident, the mines comprise of Yarrie, Yandi, Orebodies (18, 23, and 25), Mount
whale back, and Area C, which produce 1200, 1350, 2550, 1000, and 1100 respectively whereas
the processing-hubs include Jimbebar, Mining Area C, Newman, and Yandi which have a
processing capability of 1800, 1500, 2000, and 1900 respectively. Besides, the table below
shows the per unit transportation cost from the mines to the hubs
Mines Processing hubs
Jimbebar Mining Area C Newman Yandi
Yarrie 10 8 15 9
Yandi 12 7 9 5
Orebodies 8 7 6 10
Mount Whale Back 9 10 11 7
Document Page
Transportation Problem 4
Area C 10 5 9 7
Model Design
The transportation problem is type of linear programming problem (LPP) whose main
objective is to minimize the cost of shipping goads from one place to another. Notably, there are
three components the LPP, which include objective function, constraints, and non-negativity.
Objective function is the optimization equation that can be minimized (cost of shipping),
whereas constraints are the limitation of both the mines and the processing hubs. Consequently,
non-negativity exhibits the values of the inputs that cannot be negative.
Decision variables
Xij = the amount iron transported from mines to processing hubs
Si = supply from mine i
Dj = Demand at processing hub j
Cij = Cost per unit transported from mine i to processing hubs j
Where i = Yarrie (R), Yandi (Y), Orebodies (18, 23, and 25) (O), Mount whale back (M),
and Area C (C)
j = Jimbebar (J), Mining Area C (C), Newman (N), and Yandi (Y)
Objective function
Minimize Z= ∑∑ CijXij
Minimize Z= 10XRJ + 8XRC + 15XRN + 9XRY + 12XYJ + 7XYC +9XYN + 5XYY + 8XOJ +
7XOC + 6XON + 10XOY + 9XMJ + 10XMC + 11XMN + 7XMY + 10XCJ + 5XCC + 9XCN + 7XCY
Constraints
∑ Xij = Si
10XRJ + 8XRC + 15XRN + 9XRY = 1200
tabler-icon-diamond-filled.svg

Secure Best Marks with AI Grader

Need help grading? Try our AI Grader for instant feedback on your assignments.
Document Page
Transportation Problem 5
12XYJ + 7XYC +9XYN + 5XYY =1350
8XOJ + 7XOC + 6XON + 10XOY = 2550
9XMJ + 10XMC + 11XMN + 7XMY = 1000
10XCJ + 5XCC + 9XCN + 7XCY =1100
∑ xij = dj
10XRJ + 12XYJ + 8XOJ + 9XMJ + 10XCJ = 1800
8XRC + 7XYC + 7XOC + 10XMC + 5XCC = 1500
15XRN + 9XYN + 6XON +11XMN + 9XCN = 2000
9XRY + 5XYY + 10XOY + 7XMY + 7XCY = 1900
And
Xij >= 0 for all i and j
Model Implementation
The following table exhibits the optimized output of the BHP Iron ore transportation
problem. Besides, it is evident the amount of iron transported for a particular mine to a specific
hub.
Mines Processing hubs
Jimbebar Mining Area C Newman Yandi Total Output Supply
Yarrie 800 400 0 0 1200 = 1200
Yandi 0 0 0 1350 1350 = 1350
Orebodies 550 0 2000 0 2550 = 2550
Mount Whale Back 450 0 0 550 1000 = 1000
Area C 0 1100 0 0 1100 = 1100
Total Input 1800 1500 2000 1900
= = = =
Demand 1800 1500 2000 1900
Minimize Z= 10*800+ 8*400 + 15*0 + 9*0 + 12*0 + 7*0 +9*0 + 5*1350 + 8*550 + 7*0
+ 6*2000 + 10*0 + 9*450 + 10*0 + 11*0 + 7*550 + 10*0 + 5*1100 + 9*0 + 7*0
Document Page
Transportation Problem 6
= 8000 + 3200 + 6750 + 4400 + 12000 + 4050 + 3850 + 5500
= 47750
The above analysis exhibits that the minimum cost of transporting the iron from the
mines to the processing hubs is 47750.
Sensitivity Analysis
Notably, there two ranges incorporated in the sensitivity analysis, which include reduced
cost and the shadow price. The reduced cost exhibits by how much the objective coefficients (per
unit cost) can be increased or decreased without affecting the optimal solution. On the other
hand, shadow price exhibits the by how much the optimal solution will be increased or decreased
if will change the constraints. Therefore, the following tables exhibits the both the reduced cost
and shadow price.
Reduced Cost
Name Final
Value
Reduced
Cost
Objective
Coefficient
Allowable
Increase
Allowable
Decrease
Yarrie Jimbebar 800 0 10 1 1
Yarrie Mining Area C 400 0 8 1 2
Yarrie Newman 0 7 15 1E+30 7
Yarrie Yandi 0 1 9 1E+30 1
Yandi Jimbebar 0 5 12 1E+30 5
Yandi Mining Area C 0 2 7 1E+30 2
Yandi Newman 0 4 9 1E+30 4
Yandi Yandi 1350 0 5 2 1E+30
Orebodies Jimbebar 550 0 8 1 4
Orebodies Mining Area C 0 1 7 1E+30 1
Orebodies Newman 2000 0 6 4 1E+30
Orebodies Yandi 0 4 10 1E+30 4
Mount Whale Back Jimbebar 450 0 9 2 1
Mount Whale Back Mining Area C 0 3 10 1E+30 3
Mount Whale Back Newman 0 4 11 1E+30 4
Mount Whale Back Yandi 550 0 7 1 2
Area C Jimbebar 0 3 10 1E+30 3
Area C Mining Area C 1100 0 5 2 1E+30
Area C Newman 0 4 9 1E+30 4
Area C Yandi 0 2 7 1E+30 2
Document Page
Transportation Problem 7
Shadow Price
Final Shadow Constraint Allowabl
e
Allowable
Name Valu
e
Price R.H. Side Increase Decrease
Jimbebar 1800 8 1800 0 550
Mining Area C 1500 6 1500 0 400
Newman 2000 6 2000 0 2000
Yandi 1900 6 1900 0 550
Yarrie 1200 2 1200 550 0
Yandi 1350 -1 1350 550 0
Orebodies 2550 0 2550 0 1E+30
Mount Whale Back 1000 1 1000 550 0
Area C 1100 -1 1100 400 0
Interpretation
As exhibited from the reduced cost table the transport cost from Yarrie to Jimbebar and
Yarrie to Area C can be reduced by $1 and $2 respectively without affecting the optimal solution
since the reduced cost is zero. Generally, the reduced cost for transporting the iron ore from the
mine to various processing hubs is zero. Therefore, the by either reducing or increasing the cost
of transport within the limits (allowable increase or decrease) will not affected the total cost of
transport.
The shadow price shows the impact of the increasing or reducing the constraints to the
transport cost. For instance, the it evident that all the processing hubs can reduce their demands
whereby Jimbebar, Area C, Newman, Yandi have an allowable decrease 550, 400, 2000, and
550. Consequently, the shadow prices linked to these hubs include 8, 6, 6, and 6. The table below
show the impact of reducing the demand of iron ore in the processing hubs to the total cost
Hubs Total Cost Allowable Decrease Shadow Price Reduced Cost Revised cost
Jimbebar 47750 550 8 4400 43350
tabler-icon-diamond-filled.svg

Paraphrase This Document

Need a fresh take? Get an instant paraphrase of this document with our AI Paraphraser
Document Page
Transportation Problem 8
Area C 47750 400 6 2400 45350
Newman 47750 2000 6 12000 35750
Yandi 47750 550 6 3300 44450
As evident, by incorporating the allowable decrease, Jimbebar, Area C, Newman, Yandi
reduces the total cost of transshipment by 43350, 45350, 35750, and 4450.
On the other side, Orebodies have a shadow price of 0 thus indicating that the decrease or
increase of produce (supply) will not affect the total cost of shipment. The table below shows the
impact of increasing the supply of iron within the allowable increase.
Mines Total Cost Allowable Increase Shadow Price Cost Revised cost
Yarrie 47750 550 2 1100 48850
Yandi 47750 550 -1 -550 47200
Mount Whale 47750 550 1 550 48300
Area C 47750 400 -1 -400 47350
As evident, by increasing the level of supply both Yandi and Area C will reduce the total
cost of transporting the iron ore; however, Yarrie and Mount Whale Back will increase the total
cost of shipment.
Recommendation and Conclusion
It is exhibited that to realize a minimum cost of transportation of iron ore Yarrie will
supply 800 tons to Jimbebar and 400 tons to Area C whereas all the supply of Yandi will be used
by Yandi hub. Moreover, Orebodies will supply to both Jimbebar and Newman 550 and 2000
tons respectively whereas all the supplies from Area C will be used by Area C hub. Mount
Whale will supply both Jimbebar and Yandi 450 and 550 tons respectively. Thus, resulting a
total cost of transportation of $47750. Notably, it evident that by increasing the level of
production in both Yandi and Area C will not only reduce the total cost of transportation but also
it will not affect the demand of iron in the hubs. Therefore, it is recommendable to increase the
level of supply in Yandi and Area C.
References
Document Page
Transportation Problem 9
BHP. (2019). Minerals Australia. Retrieved from BHP Website: https://www.bhp.com/our-
businesses/minerals-australia
Appendices
Mines Processing hubs
Jimbebar Mining Area C Newman Yandi
Yarrie 10 8 15 9
Yandi 12 7 9 5
Orebodies 8 7 6 10
Mount Whale Back 9 10 11 7
Area C 10 5 9 7
Total Cost 47750
Mines Processing hubs
Jimbebar Mining Area C Newman Yandi Total Output Supply
Yarrie 800 400 0 0 1200 = 1200
Yandi 0 0 0 1350 1350 = 1350
Orebodies 550 0 2000 0 2550 = 2550
Mount Whale Back 450 0 0 550 1000 = 1000
Area C 0 1100 0 0 1100 = 1100
Total Input 1800 1500 2000 1900
= = = =
Demand 1800 1500 2000 1900
chevron_up_icon
1 out of 9
circle_padding
hide_on_mobile
zoom_out_icon
logo.png

Your All-in-One AI-Powered Toolkit for Academic Success.

Available 24*7 on WhatsApp / Email

[object Object]