Comprehensive Case Study: Analyzing BHP LTD's Financial Ratios
VerifiedAdded on 2023/06/18
|14
|3156
|125
Case Study
AI Summary
This case study provides a detailed financial analysis of BHP LTD, focusing on key financial ratios to assess the company's strengths and weaknesses. The analysis includes profitability ratios such as return on equity, return on assets, gross profit ratio, and profit margin, revealing trends in the company's earnings and asset utilization. Liquidity ratios like the current ratio, quick ratio, and cash flow ratio from operating activity are examined to evaluate BHP LTD's ability to meet short-term obligations. Furthermore, capital structure ratios, including debt ratio and equity ratio, are analyzed to understand the company's leverage and solvency. The report concludes with an overall assessment of BHP LTD's financial health based on the ratio analysis, offering insights for investors and management.

Case study presentation
Paraphrase This Document
Need a fresh take? Get an instant paraphrase of this document with our AI Paraphraser
TABLE OF CONTENTS:
INTRODUCTION...........................................................................................................................3
Objective......................................................................................................................................3
Ways of Analysis.........................................................................................................................3
Liquidity ratio of BHP LTD .......................................................................................................4
Profitability ratio:.........................................................................................................................4
Return on equity ratio..................................................................................................................4
Return on Asset ratio...................................................................................................................5
Gross profit ratio..........................................................................................................................5
Profit margin................................................................................................................................6
Cash flow to sales ratio:...............................................................................................................6
Liquidity ratio..............................................................................................................................6
Current ratio:................................................................................................................................6
Quick ratio...................................................................................................................................7
Cash flow ratio from operating activity.......................................................................................8
Capital structure ratio...................................................................................................................9
Debt ratio.....................................................................................................................................9
Equity ratio.................................................................................................................................10
Interest coverage ratio................................................................................................................10
Conclusion.......................................................................................................................................1
References .......................................................................................................................................2
Books and Journal............................................................................................................................2
INTRODUCTION
The following report focuses on recognizing the strength and weaknesses of BHP group limited.
This report demonstrates ratios for this company and provides financial health of the company.
In this report there are different ratios has been used such as profitability, Solvency, liquidity etc.
In the entire report BHP ltd has been discussed, As this company is listed on Australian stock
exchange and it deals in retailing of gas and electricity for commercial as well as residential
purpose (Simamora and et.al 2019). This company deals in mining, metals and petroleum. This
company has lot of customers who are enjoying the products and services offered by them. BHP
LTd is committed to shape the sustainable energy of Australia.
Objective
The main objective behind calculating the ratios of this company is find out the strength
and weakness. As ratio analysis id one of the helpful tool which provides accurate result about
the competitive edge of the company. It also assists the management of the company to know the
⊘ This is a preview!⊘
Do you want full access?
Subscribe today to unlock all pages.
Trusted by 1+ million students worldwide
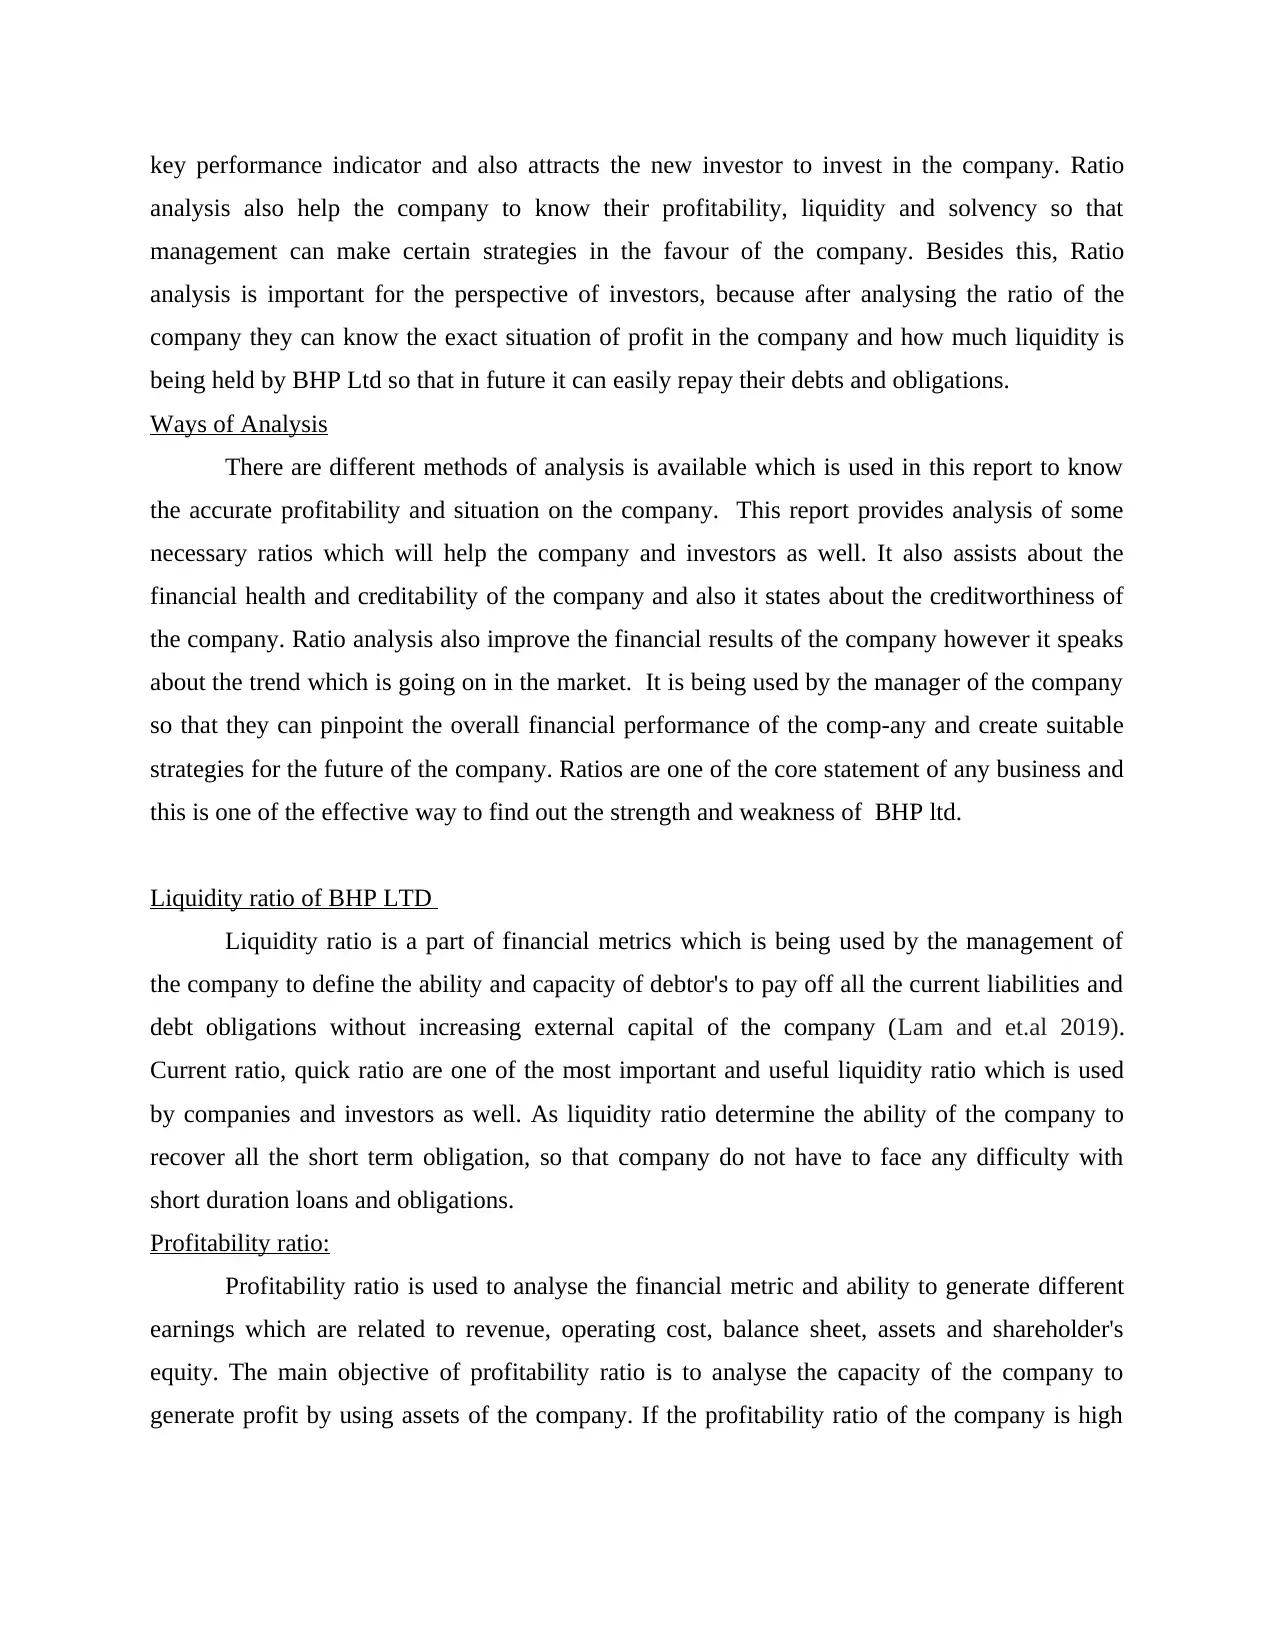
key performance indicator and also attracts the new investor to invest in the company. Ratio
analysis also help the company to know their profitability, liquidity and solvency so that
management can make certain strategies in the favour of the company. Besides this, Ratio
analysis is important for the perspective of investors, because after analysing the ratio of the
company they can know the exact situation of profit in the company and how much liquidity is
being held by BHP Ltd so that in future it can easily repay their debts and obligations.
Ways of Analysis
There are different methods of analysis is available which is used in this report to know
the accurate profitability and situation on the company. This report provides analysis of some
necessary ratios which will help the company and investors as well. It also assists about the
financial health and creditability of the company and also it states about the creditworthiness of
the company. Ratio analysis also improve the financial results of the company however it speaks
about the trend which is going on in the market. It is being used by the manager of the company
so that they can pinpoint the overall financial performance of the comp-any and create suitable
strategies for the future of the company. Ratios are one of the core statement of any business and
this is one of the effective way to find out the strength and weakness of BHP ltd.
Liquidity ratio of BHP LTD
Liquidity ratio is a part of financial metrics which is being used by the management of
the company to define the ability and capacity of debtor's to pay off all the current liabilities and
debt obligations without increasing external capital of the company (Lam and et.al 2019).
Current ratio, quick ratio are one of the most important and useful liquidity ratio which is used
by companies and investors as well. As liquidity ratio determine the ability of the company to
recover all the short term obligation, so that company do not have to face any difficulty with
short duration loans and obligations.
Profitability ratio:
Profitability ratio is used to analyse the financial metric and ability to generate different
earnings which are related to revenue, operating cost, balance sheet, assets and shareholder's
equity. The main objective of profitability ratio is to analyse the capacity of the company to
generate profit by using assets of the company. If the profitability ratio of the company is high
Paraphrase This Document
Need a fresh take? Get an instant paraphrase of this document with our AI Paraphraser
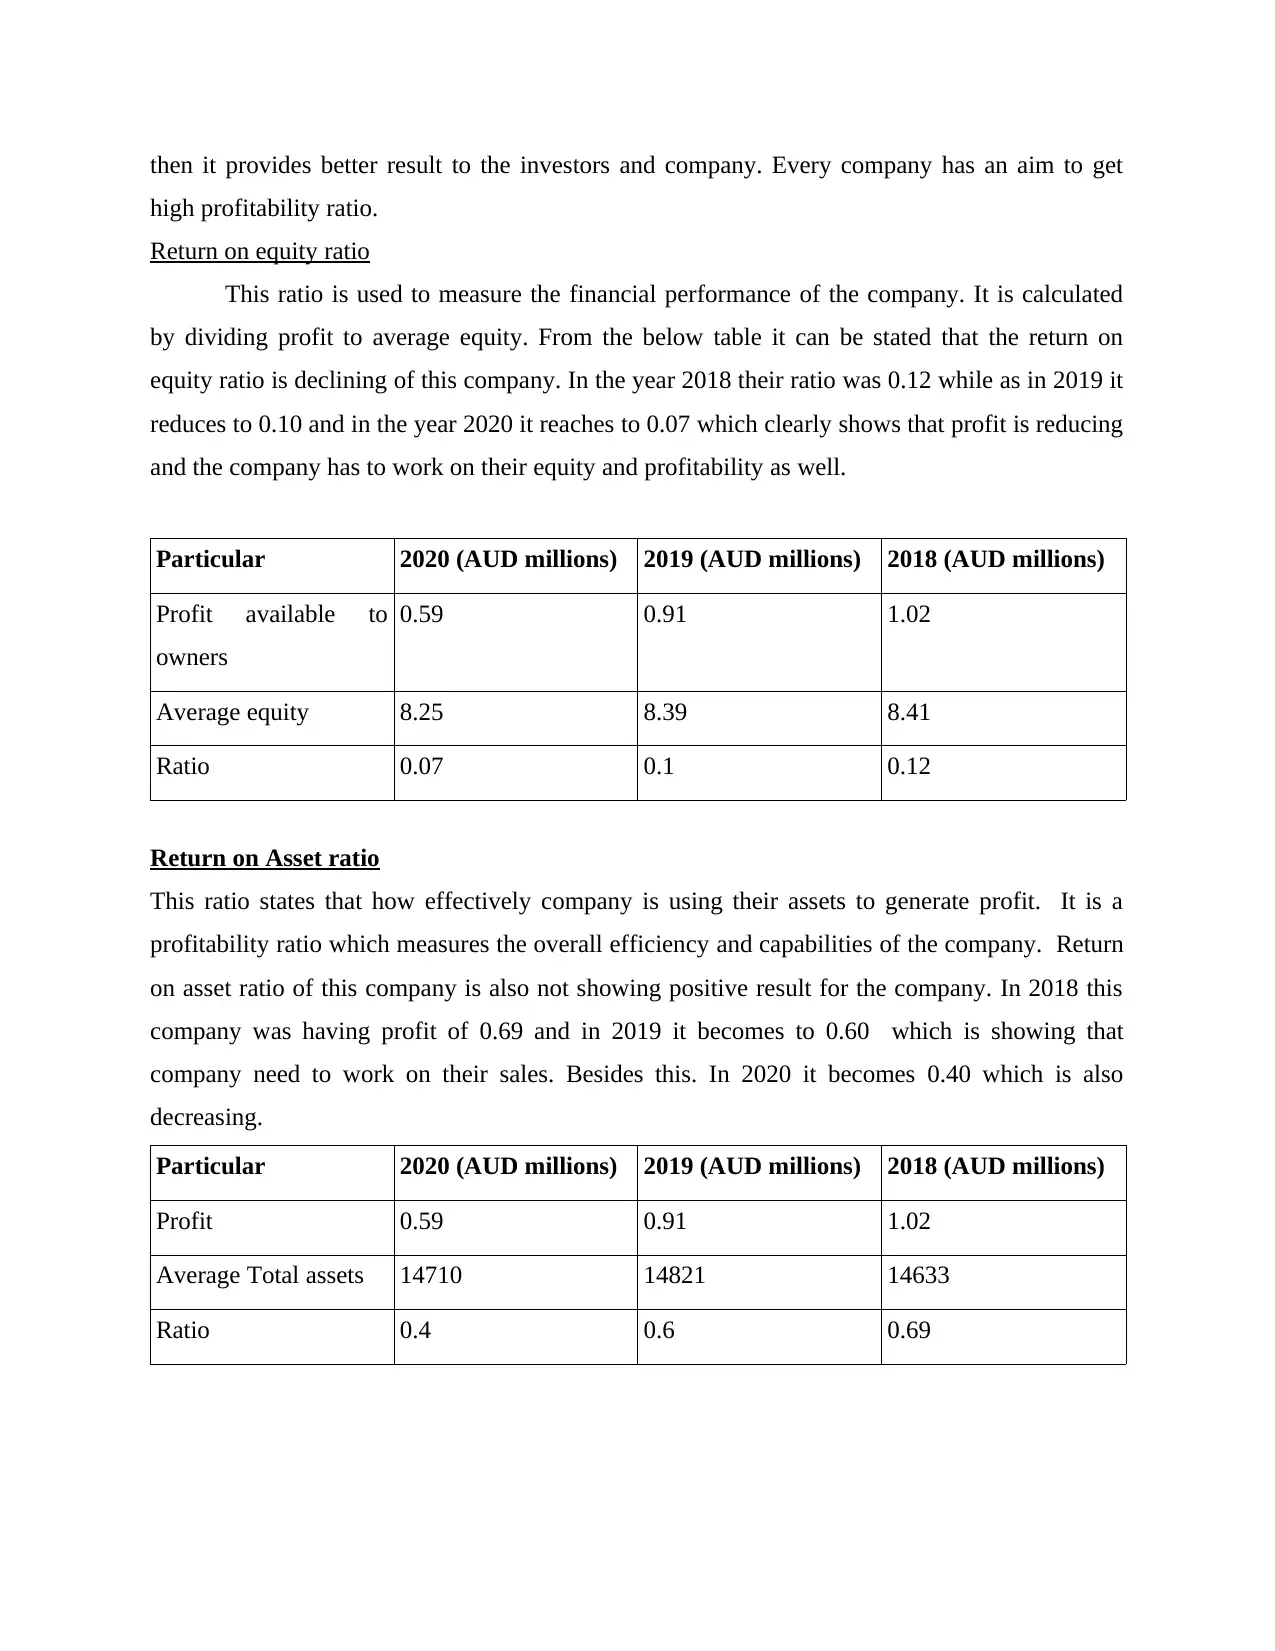
then it provides better result to the investors and company. Every company has an aim to get
high profitability ratio.
Return on equity ratio
This ratio is used to measure the financial performance of the company. It is calculated
by dividing profit to average equity. From the below table it can be stated that the return on
equity ratio is declining of this company. In the year 2018 their ratio was 0.12 while as in 2019 it
reduces to 0.10 and in the year 2020 it reaches to 0.07 which clearly shows that profit is reducing
and the company has to work on their equity and profitability as well.
Particular 2020 (AUD millions) 2019 (AUD millions) 2018 (AUD millions)
Profit available to
owners
0.59 0.91 1.02
Average equity 8.25 8.39 8.41
Ratio 0.07 0.1 0.12
Return on Asset ratio
This ratio states that how effectively company is using their assets to generate profit. It is a
profitability ratio which measures the overall efficiency and capabilities of the company. Return
on asset ratio of this company is also not showing positive result for the company. In 2018 this
company was having profit of 0.69 and in 2019 it becomes to 0.60 which is showing that
company need to work on their sales. Besides this. In 2020 it becomes 0.40 which is also
decreasing.
Particular 2020 (AUD millions) 2019 (AUD millions) 2018 (AUD millions)
Profit 0.59 0.91 1.02
Average Total assets 14710 14821 14633
Ratio 0.4 0.6 0.69
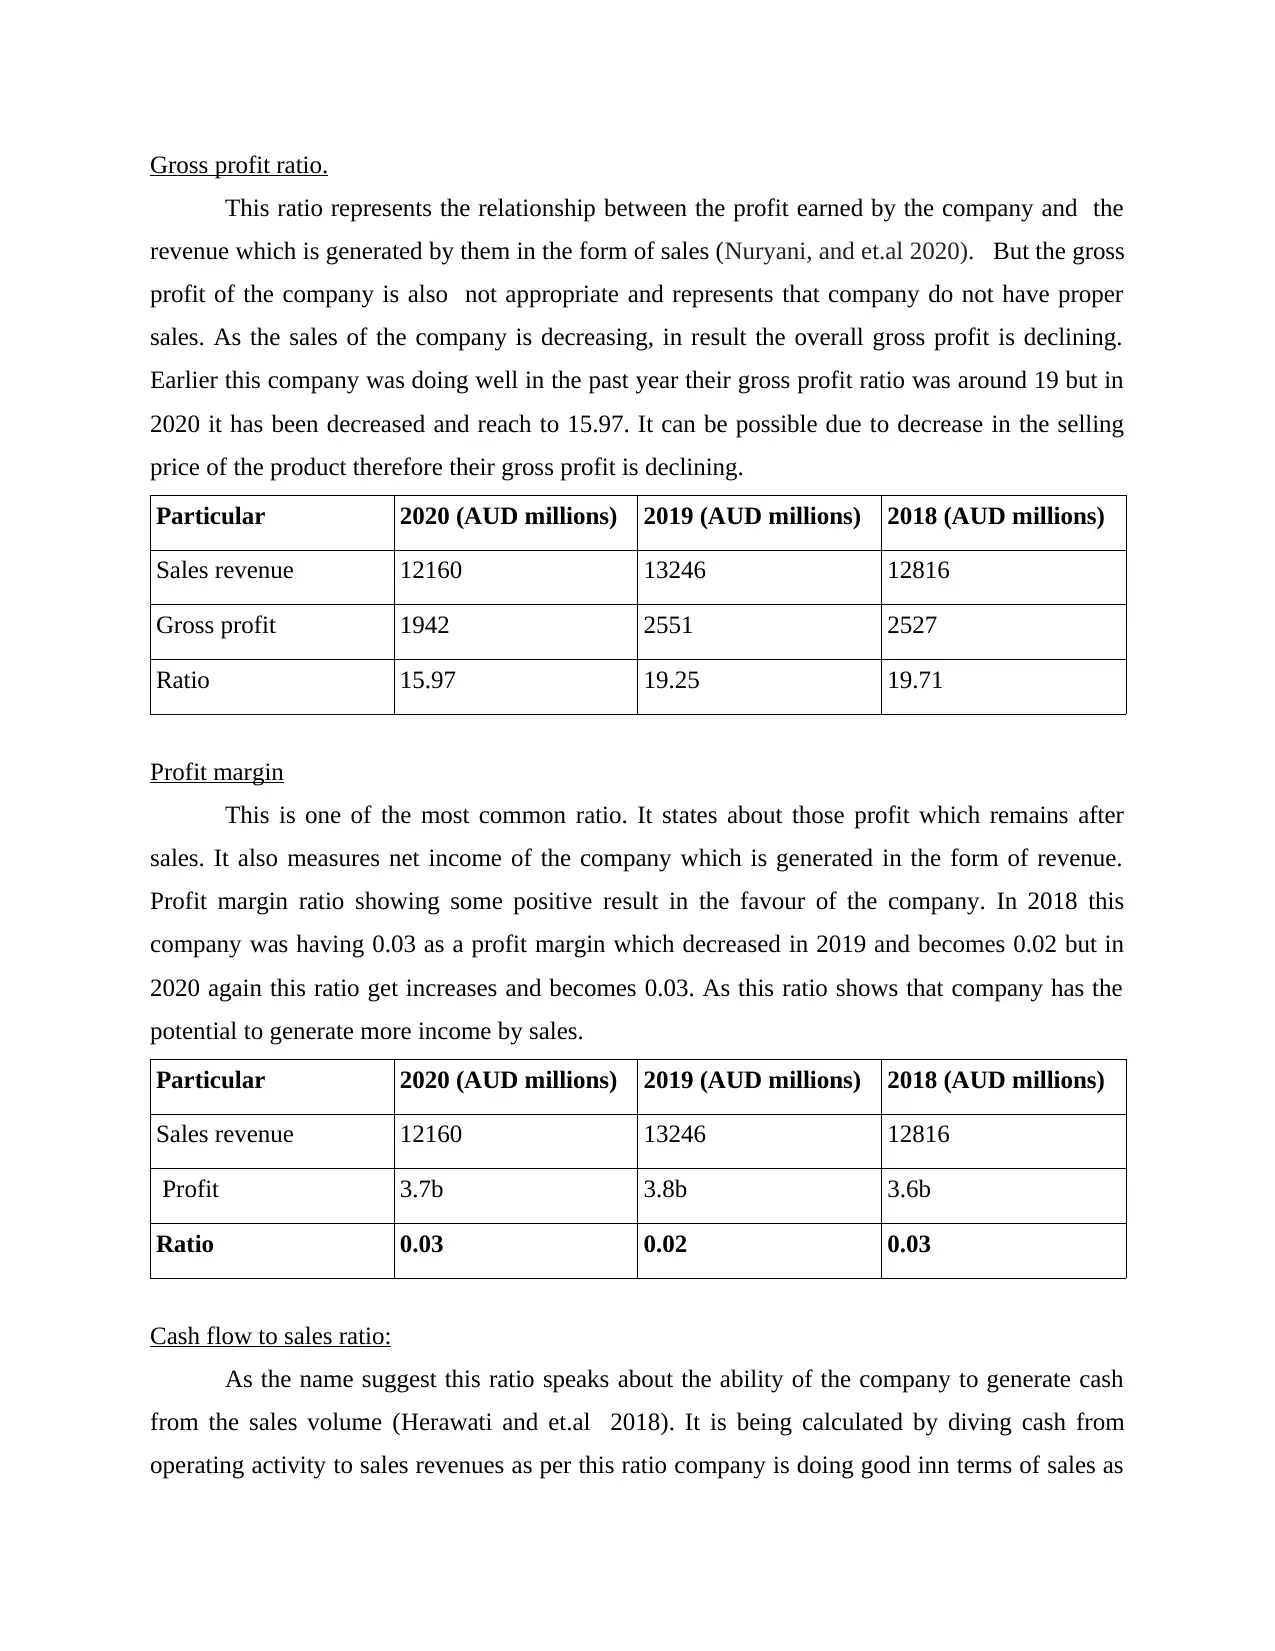
Gross profit ratio.
This ratio represents the relationship between the profit earned by the company and the
revenue which is generated by them in the form of sales (Nuryani, and et.al 2020). But the gross
profit of the company is also not appropriate and represents that company do not have proper
sales. As the sales of the company is decreasing, in result the overall gross profit is declining.
Earlier this company was doing well in the past year their gross profit ratio was around 19 but in
2020 it has been decreased and reach to 15.97. It can be possible due to decrease in the selling
price of the product therefore their gross profit is declining.
Particular 2020 (AUD millions) 2019 (AUD millions) 2018 (AUD millions)
Sales revenue 12160 13246 12816
Gross profit 1942 2551 2527
Ratio 15.97 19.25 19.71
Profit margin
This is one of the most common ratio. It states about those profit which remains after
sales. It also measures net income of the company which is generated in the form of revenue.
Profit margin ratio showing some positive result in the favour of the company. In 2018 this
company was having 0.03 as a profit margin which decreased in 2019 and becomes 0.02 but in
2020 again this ratio get increases and becomes 0.03. As this ratio shows that company has the
potential to generate more income by sales.
Particular 2020 (AUD millions) 2019 (AUD millions) 2018 (AUD millions)
Sales revenue 12160 13246 12816
Profit 3.7b 3.8b 3.6b
Ratio 0.03 0.02 0.03
Cash flow to sales ratio:
As the name suggest this ratio speaks about the ability of the company to generate cash
from the sales volume (Herawati and et.al 2018). It is being calculated by diving cash from
operating activity to sales revenues as per this ratio company is doing good inn terms of sales as
⊘ This is a preview!⊘
Do you want full access?
Subscribe today to unlock all pages.
Trusted by 1+ million students worldwide
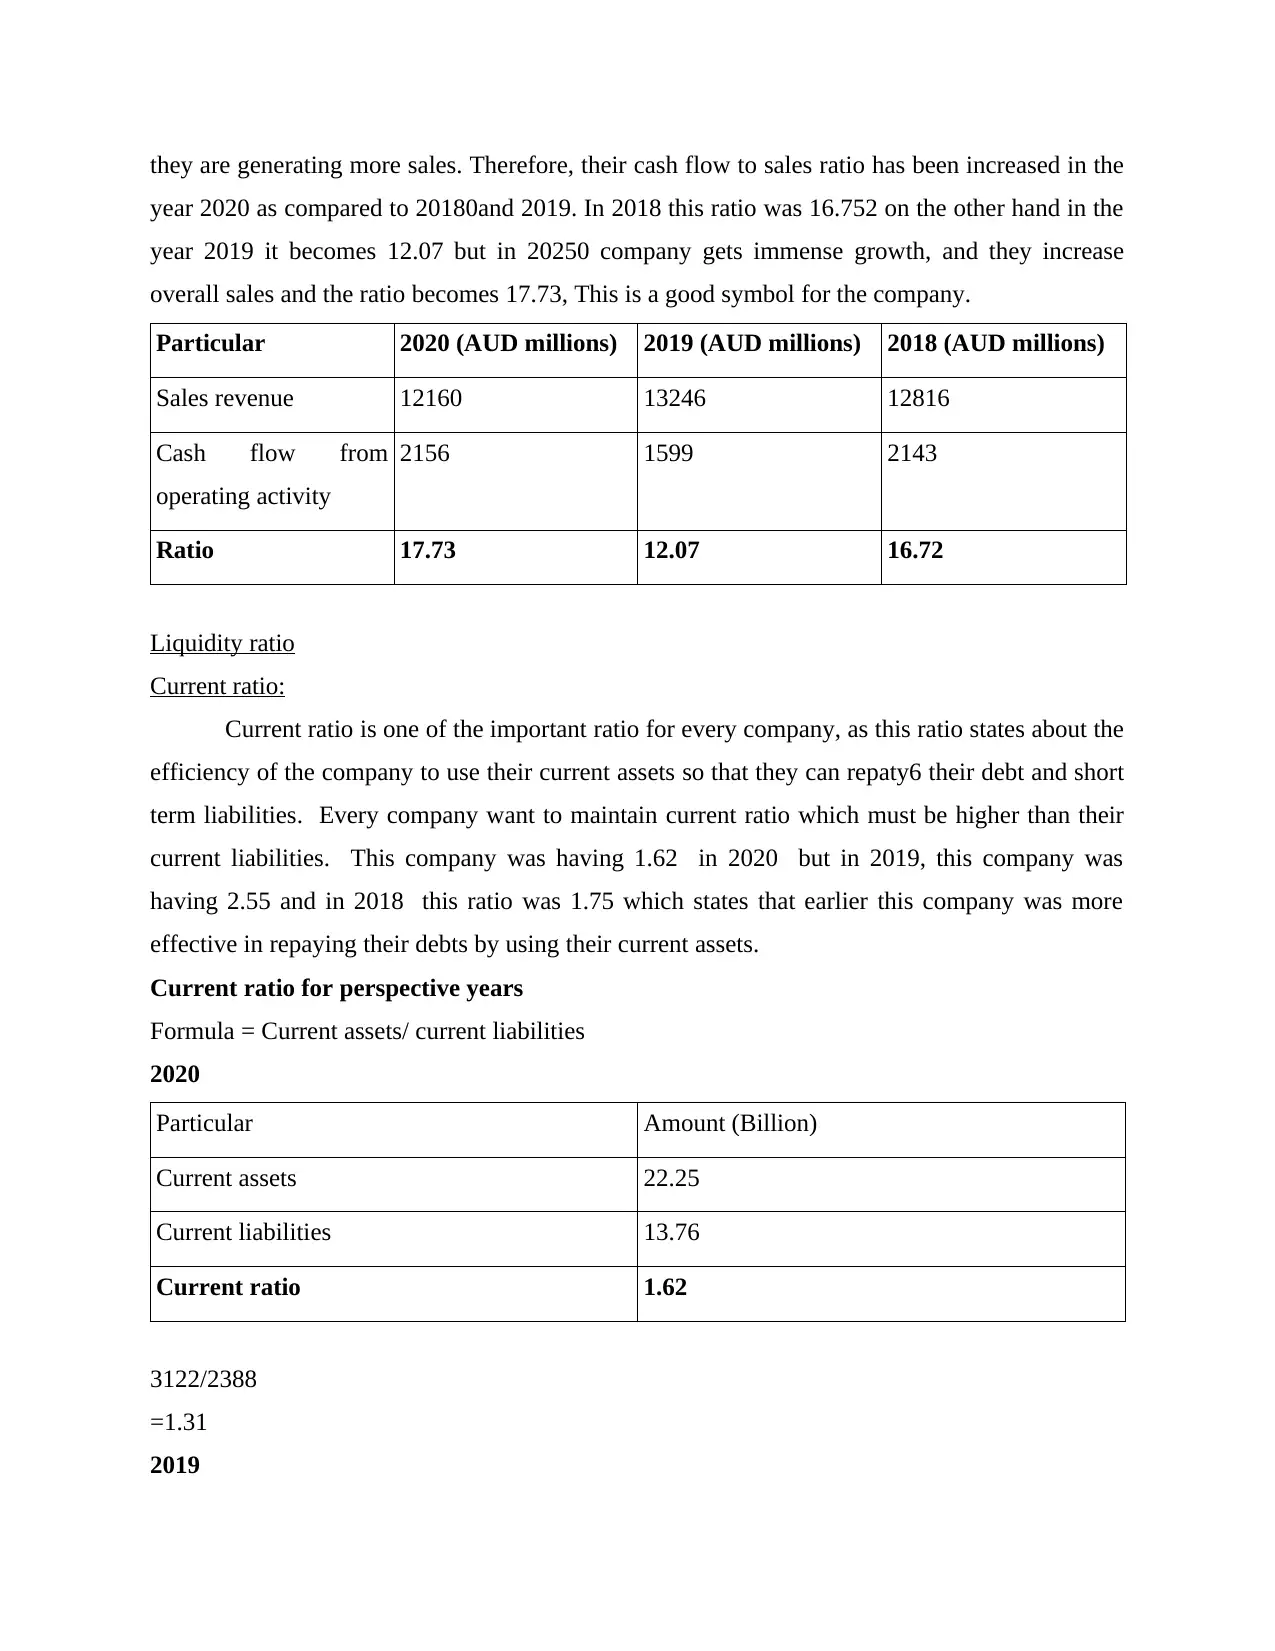
they are generating more sales. Therefore, their cash flow to sales ratio has been increased in the
year 2020 as compared to 20180and 2019. In 2018 this ratio was 16.752 on the other hand in the
year 2019 it becomes 12.07 but in 20250 company gets immense growth, and they increase
overall sales and the ratio becomes 17.73, This is a good symbol for the company.
Particular 2020 (AUD millions) 2019 (AUD millions) 2018 (AUD millions)
Sales revenue 12160 13246 12816
Cash flow from
operating activity
2156 1599 2143
Ratio 17.73 12.07 16.72
Liquidity ratio
Current ratio:
Current ratio is one of the important ratio for every company, as this ratio states about the
efficiency of the company to use their current assets so that they can repaty6 their debt and short
term liabilities. Every company want to maintain current ratio which must be higher than their
current liabilities. This company was having 1.62 in 2020 but in 2019, this company was
having 2.55 and in 2018 this ratio was 1.75 which states that earlier this company was more
effective in repaying their debts by using their current assets.
Current ratio for perspective years
Formula = Current assets/ current liabilities
2020
Particular Amount (Billion)
Current assets 22.25
Current liabilities 13.76
Current ratio 1.62
3122/2388
=1.31
2019
Paraphrase This Document
Need a fresh take? Get an instant paraphrase of this document with our AI Paraphraser
Particular Amount (Billions)
Current assets 26.41
Current liabilities 10.37
Current ratio 2.55
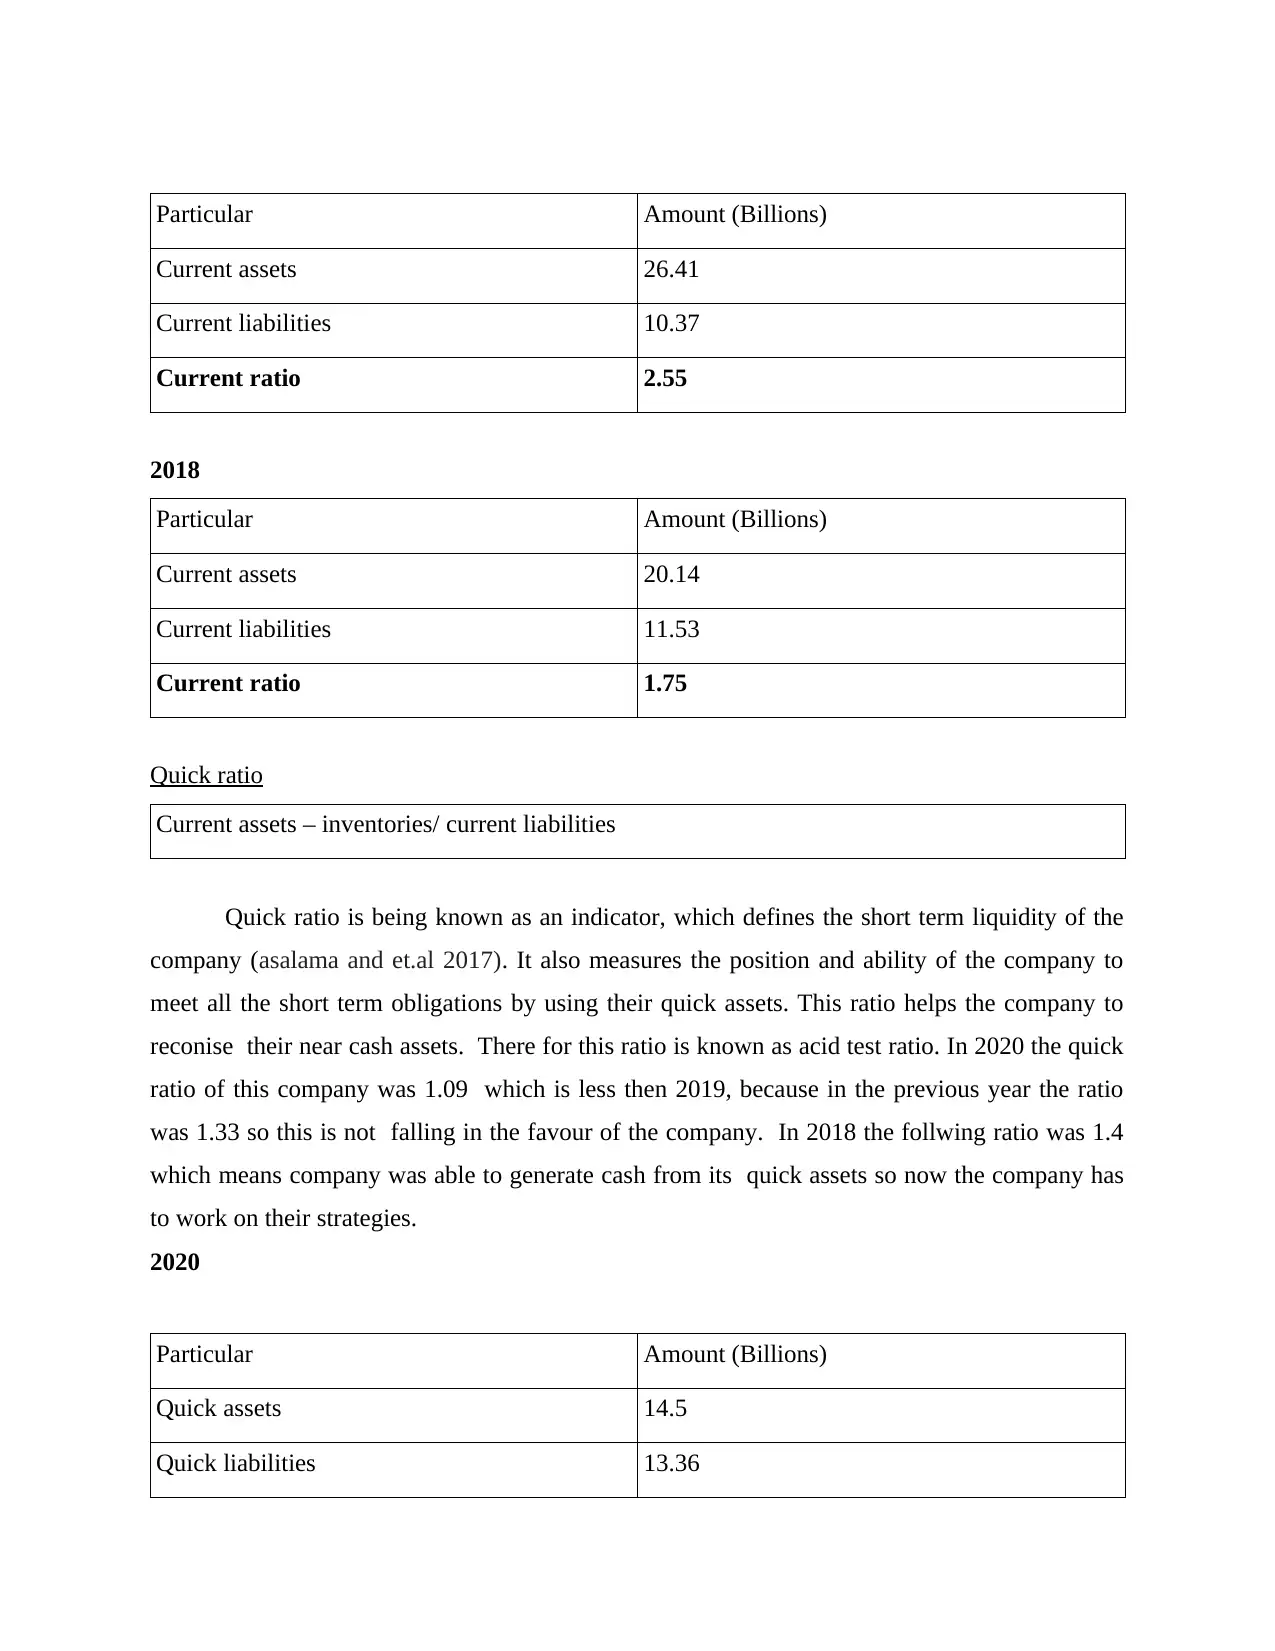
2018
Particular Amount (Billions)
Current assets 20.14
Current liabilities 11.53
Current ratio 1.75
Quick ratio
Current assets – inventories/ current liabilities
Quick ratio is being known as an indicator, which defines the short term liquidity of the
company (asalama and et.al 2017). It also measures the position and ability of the company to
meet all the short term obligations by using their quick assets. This ratio helps the company to
reconise their near cash assets. There for this ratio is known as acid test ratio. In 2020 the quick
ratio of this company was 1.09 which is less then 2019, because in the previous year the ratio
was 1.33 so this is not falling in the favour of the company. In 2018 the follwing ratio was 1.4
which means company was able to generate cash from its quick assets so now the company has
to work on their strategies.
2020
Particular Amount (Billions)
Quick assets 14.5
Quick liabilities 13.36
Current assets 26.41
Current liabilities 10.37
Current ratio 2.55
2018
Particular Amount (Billions)
Current assets 20.14
Current liabilities 11.53
Current ratio 1.75
Quick ratio
Current assets – inventories/ current liabilities
Quick ratio is being known as an indicator, which defines the short term liquidity of the
company (asalama and et.al 2017). It also measures the position and ability of the company to
meet all the short term obligations by using their quick assets. This ratio helps the company to
reconise their near cash assets. There for this ratio is known as acid test ratio. In 2020 the quick
ratio of this company was 1.09 which is less then 2019, because in the previous year the ratio
was 1.33 so this is not falling in the favour of the company. In 2018 the follwing ratio was 1.4
which means company was able to generate cash from its quick assets so now the company has
to work on their strategies.
2020
Particular Amount (Billions)
Quick assets 14.5
Quick liabilities 13.36
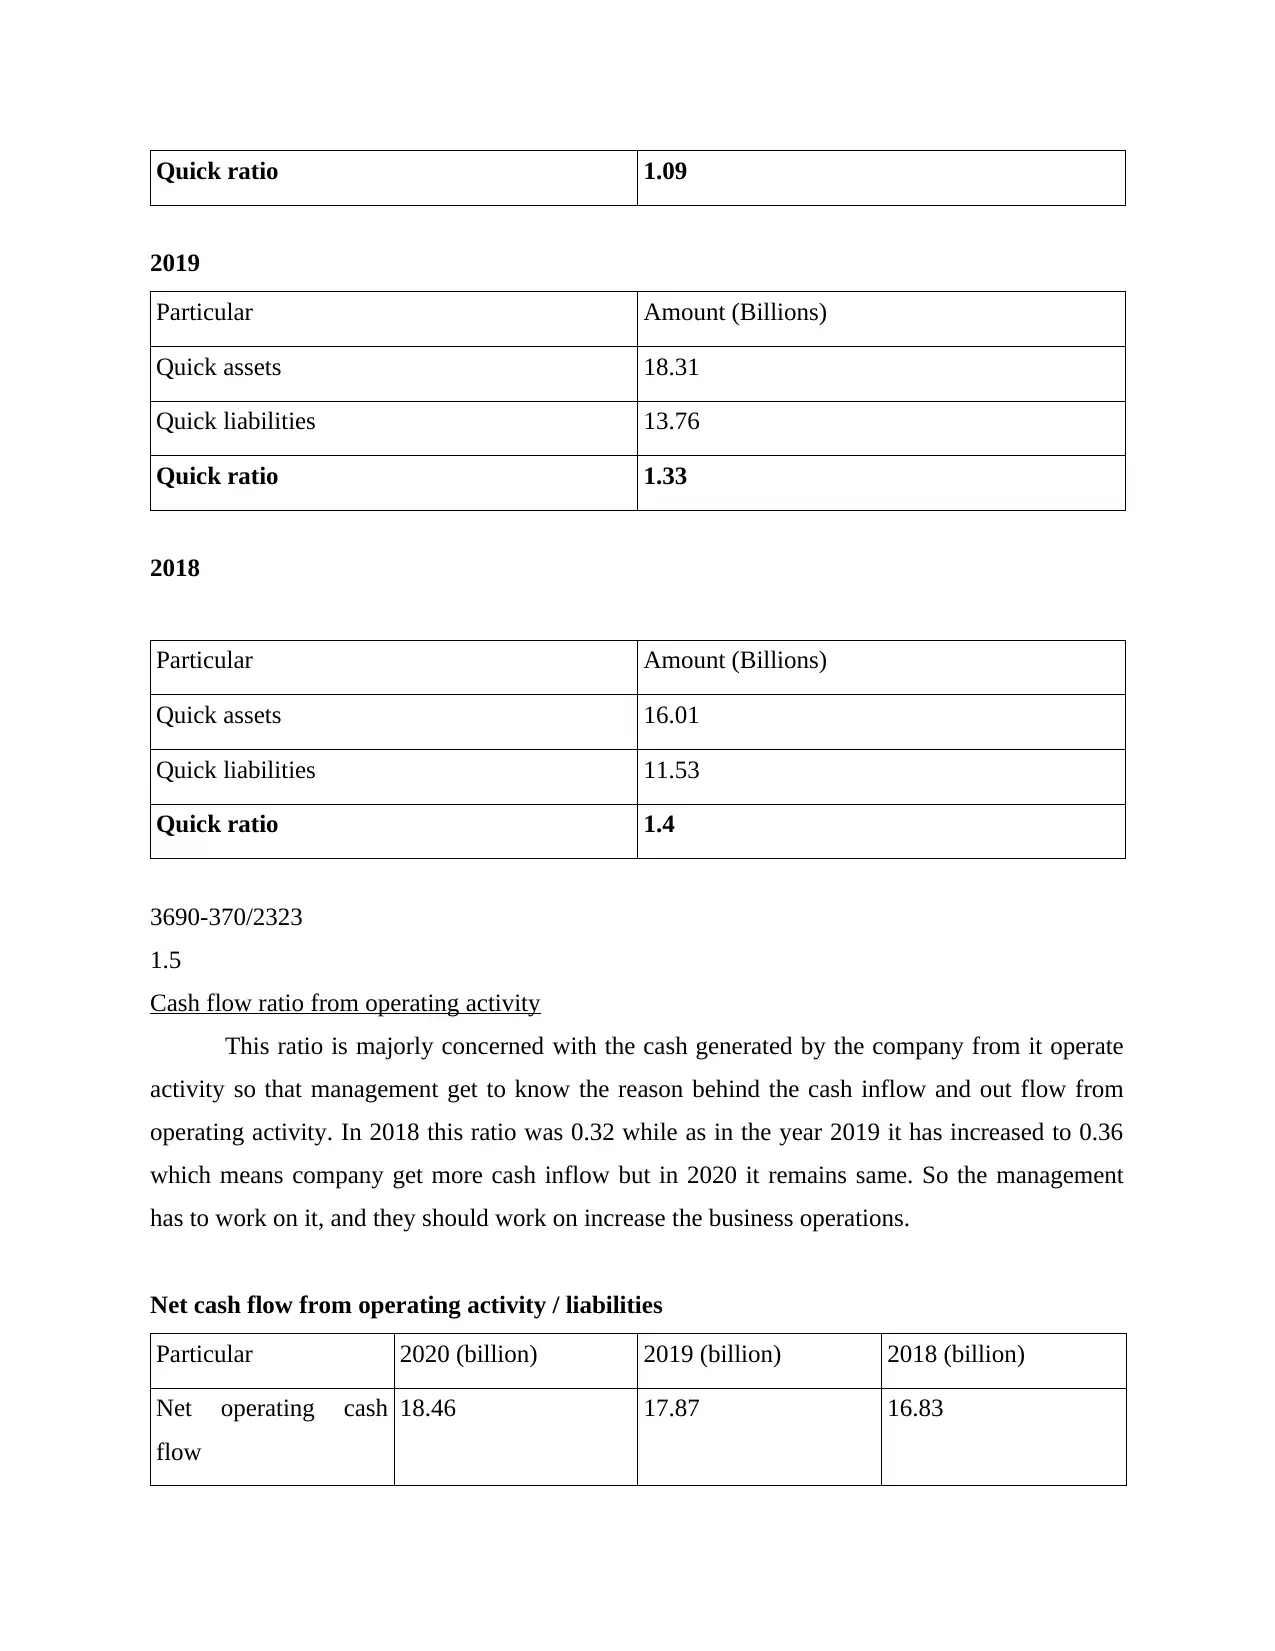
Quick ratio 1.09
2019
Particular Amount (Billions)
Quick assets 18.31
Quick liabilities 13.76
Quick ratio 1.33
2018
Particular Amount (Billions)
Quick assets 16.01
Quick liabilities 11.53
Quick ratio 1.4
3690-370/2323
1.5
Cash flow ratio from operating activity
This ratio is majorly concerned with the cash generated by the company from it operate
activity so that management get to know the reason behind the cash inflow and out flow from
operating activity. In 2018 this ratio was 0.32 while as in the year 2019 it has increased to 0.36
which means company get more cash inflow but in 2020 it remains same. So the management
has to work on it, and they should work on increase the business operations.
Net cash flow from operating activity / liabilities
Particular 2020 (billion) 2019 (billion) 2018 (billion)
Net operating cash
flow
18.46 17.87 16.83
⊘ This is a preview!⊘
Do you want full access?
Subscribe today to unlock all pages.
Trusted by 1+ million students worldwide
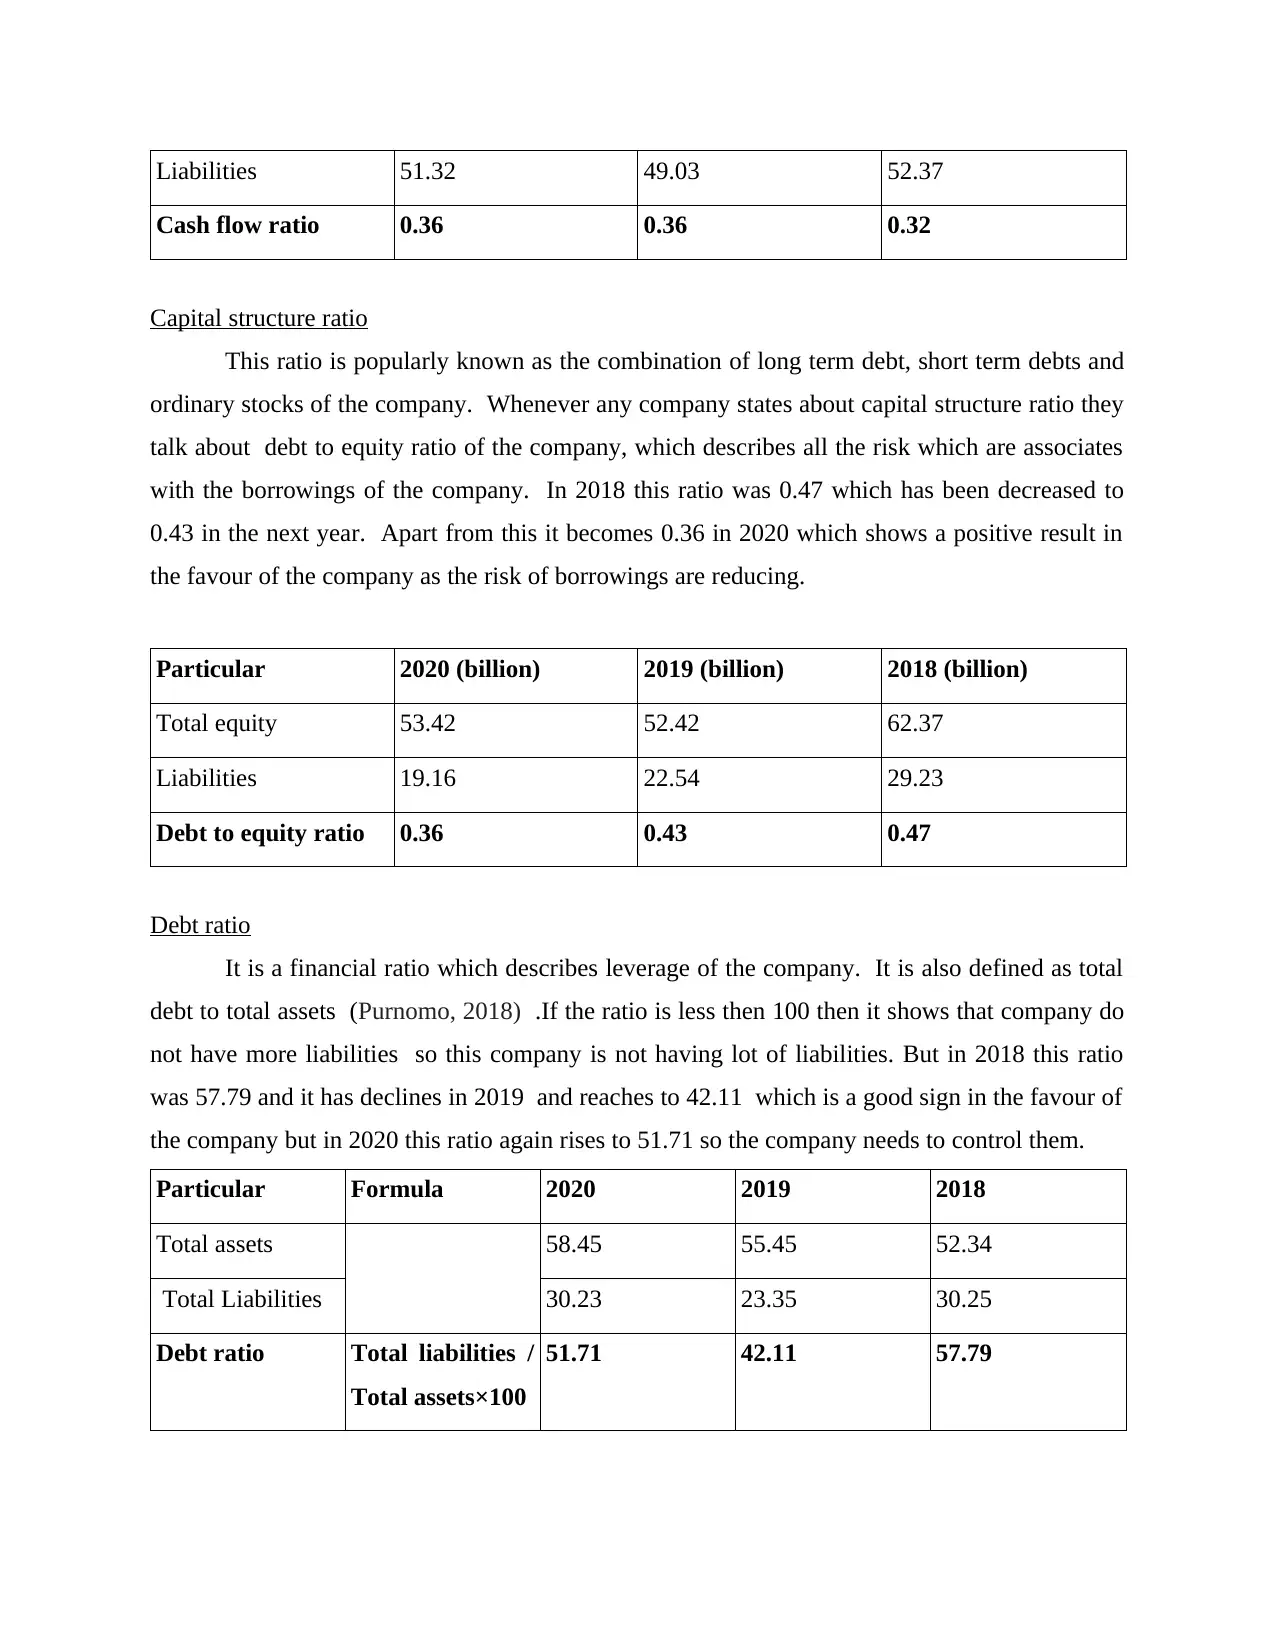
Liabilities 51.32 49.03 52.37
Cash flow ratio 0.36 0.36 0.32
Capital structure ratio
This ratio is popularly known as the combination of long term debt, short term debts and
ordinary stocks of the company. Whenever any company states about capital structure ratio they
talk about debt to equity ratio of the company, which describes all the risk which are associates
with the borrowings of the company. In 2018 this ratio was 0.47 which has been decreased to
0.43 in the next year. Apart from this it becomes 0.36 in 2020 which shows a positive result in
the favour of the company as the risk of borrowings are reducing.
Particular 2020 (billion) 2019 (billion) 2018 (billion)
Total equity 53.42 52.42 62.37
Liabilities 19.16 22.54 29.23
Debt to equity ratio 0.36 0.43 0.47
Debt ratio
It is a financial ratio which describes leverage of the company. It is also defined as total
debt to total assets (Purnomo, 2018) .If the ratio is less then 100 then it shows that company do
not have more liabilities so this company is not having lot of liabilities. But in 2018 this ratio
was 57.79 and it has declines in 2019 and reaches to 42.11 which is a good sign in the favour of
the company but in 2020 this ratio again rises to 51.71 so the company needs to control them.
Particular Formula 2020 2019 2018
Total assets 58.45 55.45 52.34
Total Liabilities 30.23 23.35 30.25
Debt ratio Total liabilities /
Total assets×100
51.71 42.11 57.79
Paraphrase This Document
Need a fresh take? Get an instant paraphrase of this document with our AI Paraphraser
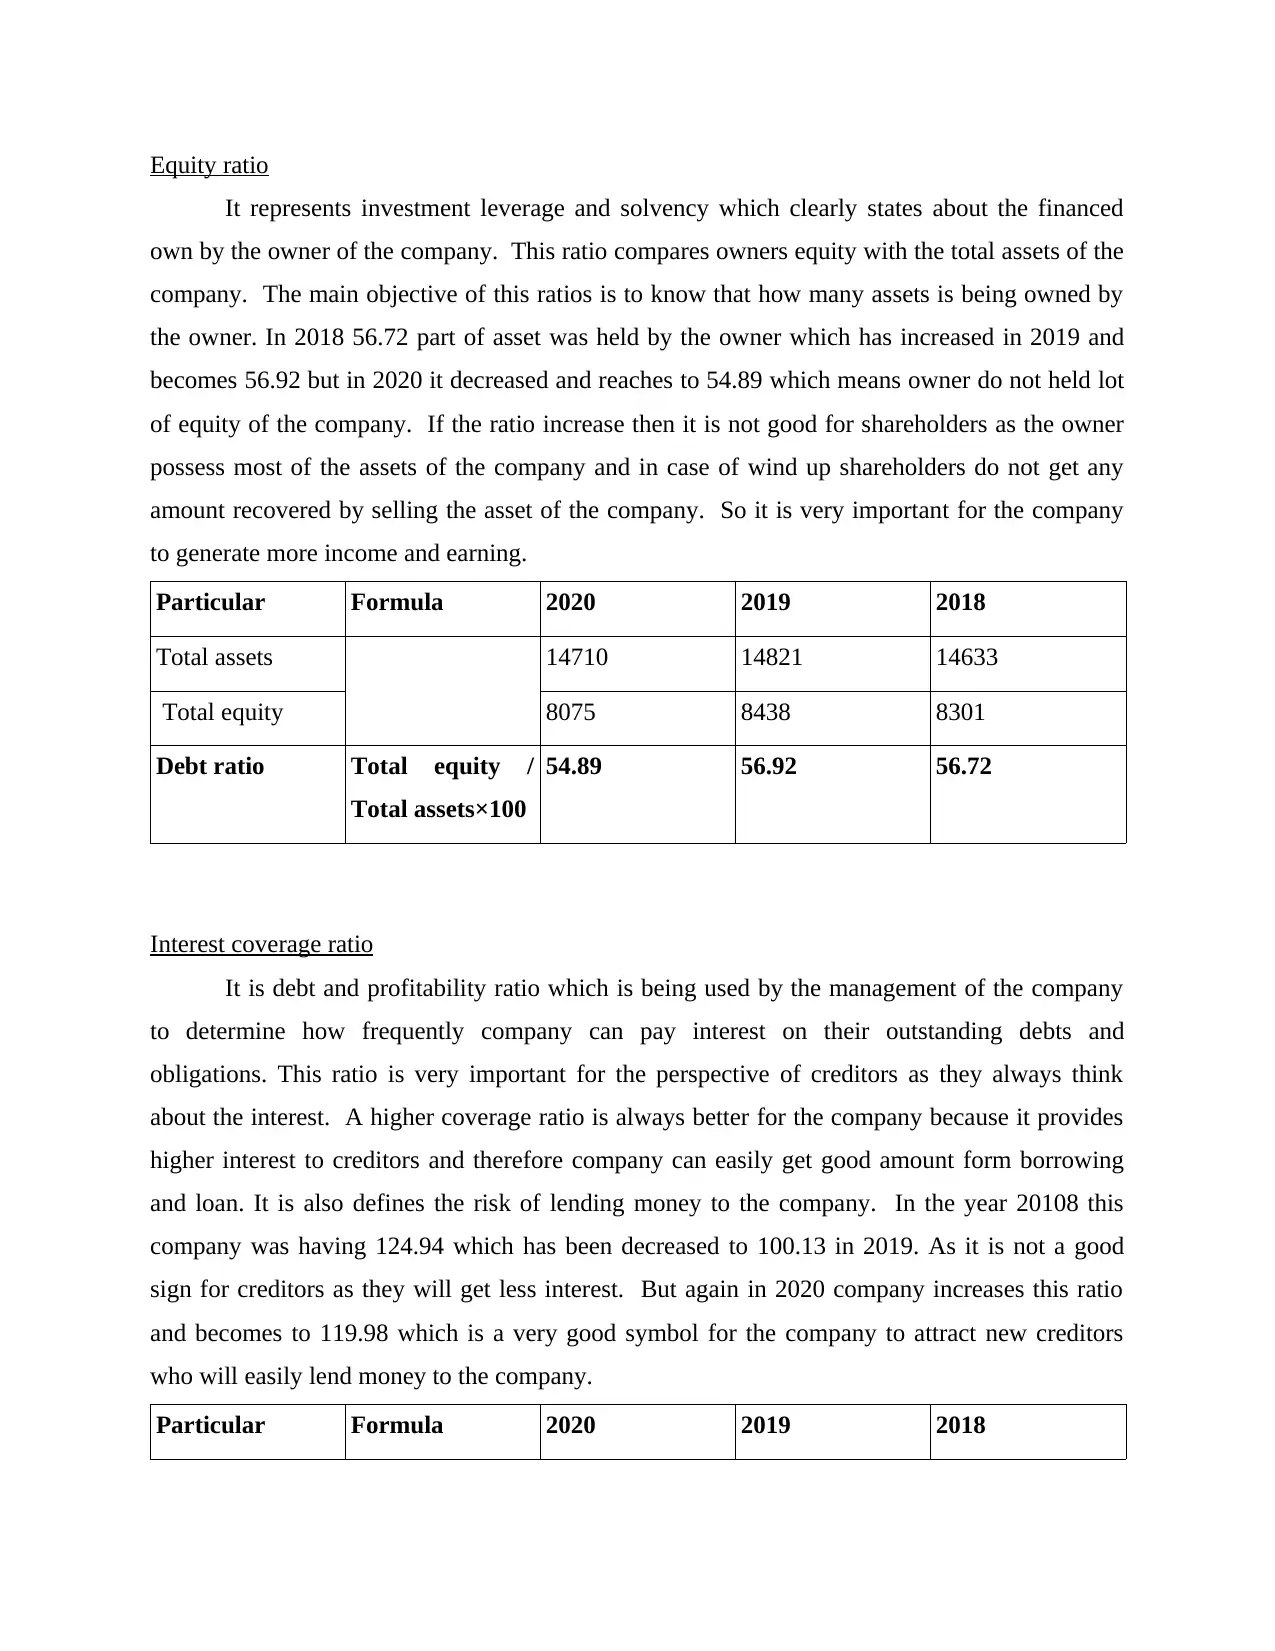
Equity ratio
It represents investment leverage and solvency which clearly states about the financed
own by the owner of the company. This ratio compares owners equity with the total assets of the
company. The main objective of this ratios is to know that how many assets is being owned by
the owner. In 2018 56.72 part of asset was held by the owner which has increased in 2019 and
becomes 56.92 but in 2020 it decreased and reaches to 54.89 which means owner do not held lot
of equity of the company. If the ratio increase then it is not good for shareholders as the owner
possess most of the assets of the company and in case of wind up shareholders do not get any
amount recovered by selling the asset of the company. So it is very important for the company
to generate more income and earning.
Particular Formula 2020 2019 2018
Total assets 14710 14821 14633
Total equity 8075 8438 8301
Debt ratio Total equity /
Total assets×100
54.89 56.92 56.72
Interest coverage ratio
It is debt and profitability ratio which is being used by the management of the company
to determine how frequently company can pay interest on their outstanding debts and
obligations. This ratio is very important for the perspective of creditors as they always think
about the interest. A higher coverage ratio is always better for the company because it provides
higher interest to creditors and therefore company can easily get good amount form borrowing
and loan. It is also defines the risk of lending money to the company. In the year 20108 this
company was having 124.94 which has been decreased to 100.13 in 2019. As it is not a good
sign for creditors as they will get less interest. But again in 2020 company increases this ratio
and becomes to 119.98 which is a very good symbol for the company to attract new creditors
who will easily lend money to the company.
Particular Formula 2020 2019 2018
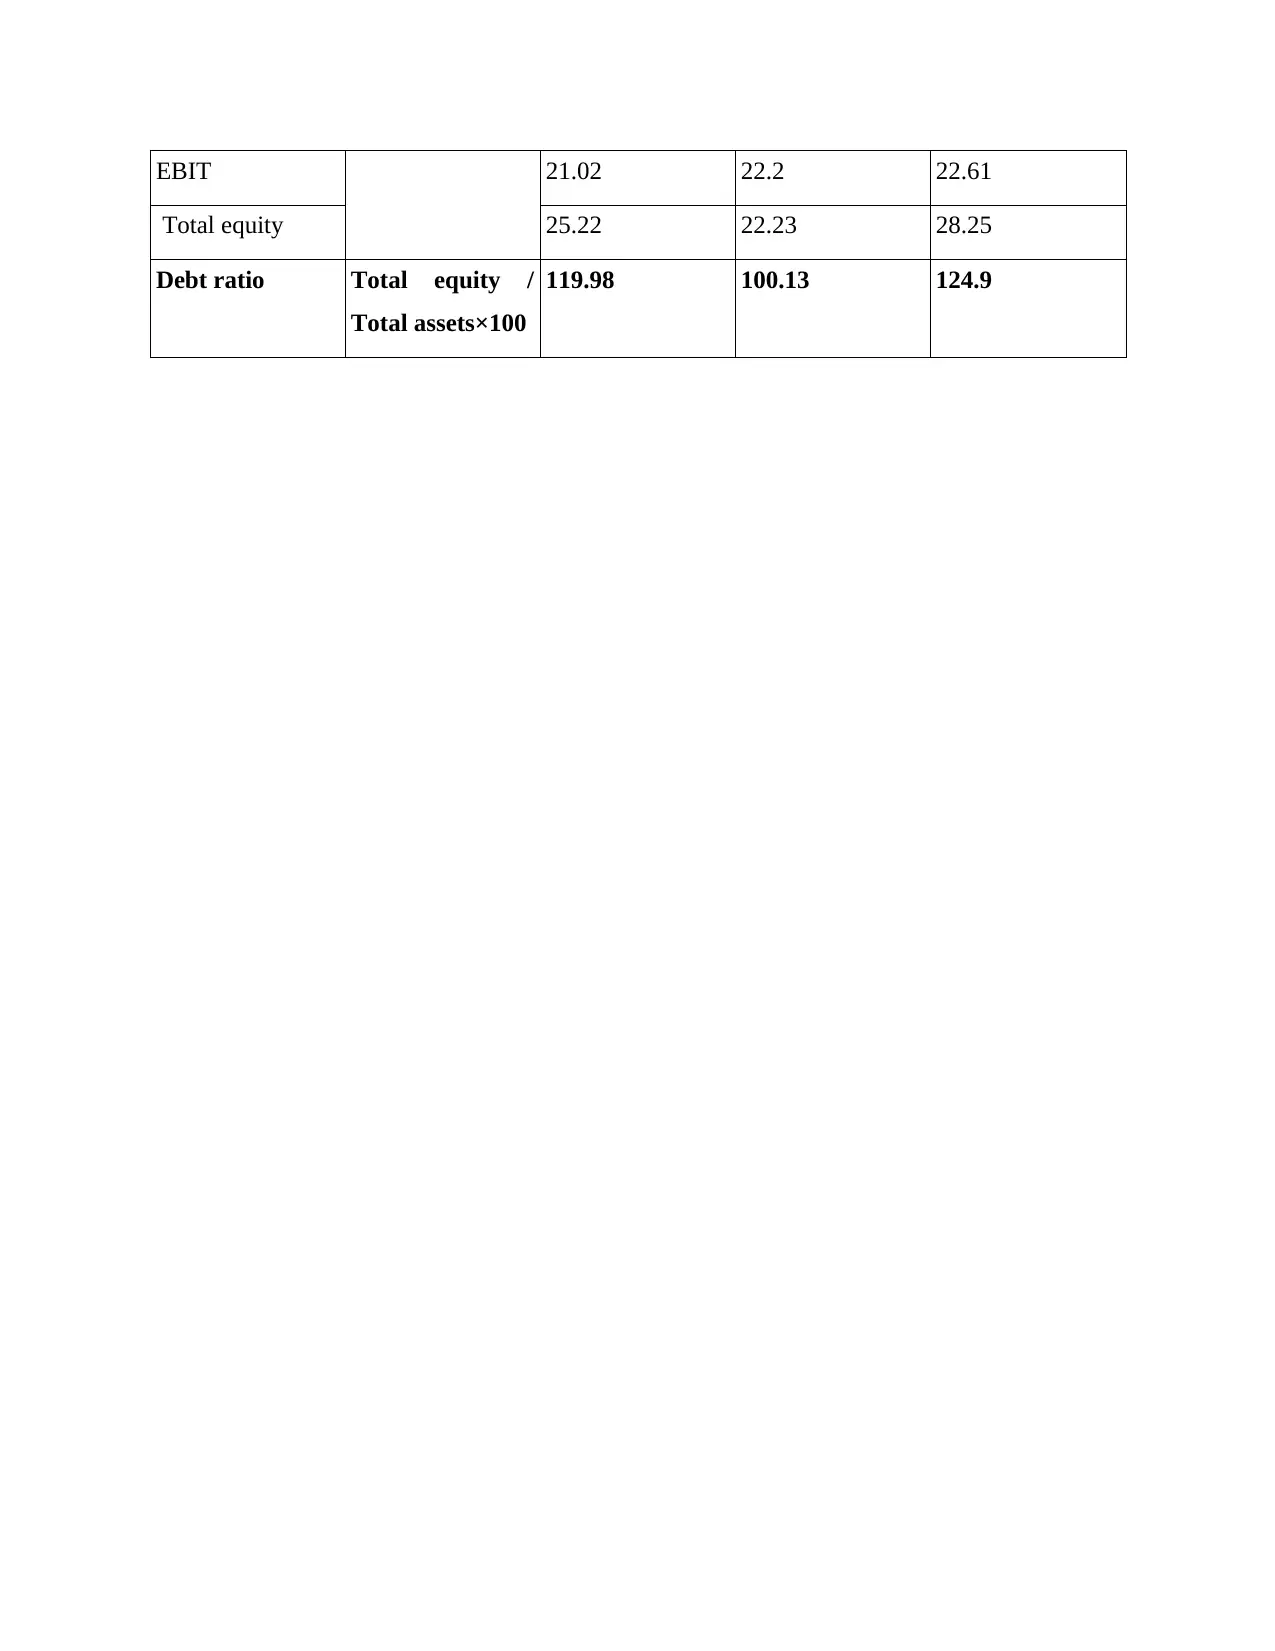
EBIT 21.02 22.2 22.61
Total equity 25.22 22.23 28.25
Debt ratio Total equity /
Total assets×100
119.98 100.13 124.9
Total equity 25.22 22.23 28.25
Debt ratio Total equity /
Total assets×100
119.98 100.13 124.9
⊘ This is a preview!⊘
Do you want full access?
Subscribe today to unlock all pages.
Trusted by 1+ million students worldwide
1 out of 14
Related Documents


Your All-in-One AI-Powered Toolkit for Academic Success.
+13062052269
info@desklib.com
Available 24*7 on WhatsApp / Email
![[object Object]](/_next/static/media/star-bottom.7253800d.svg)
Unlock your academic potential
Copyright © 2020–2026 A2Z Services. All Rights Reserved. Developed and managed by ZUCOL.