HI5002 Finance for Business: Comparative Analysis of BHP vs Rio Tinto
VerifiedAdded on 2023/06/05
|21
|3820
|356
Report
AI Summary
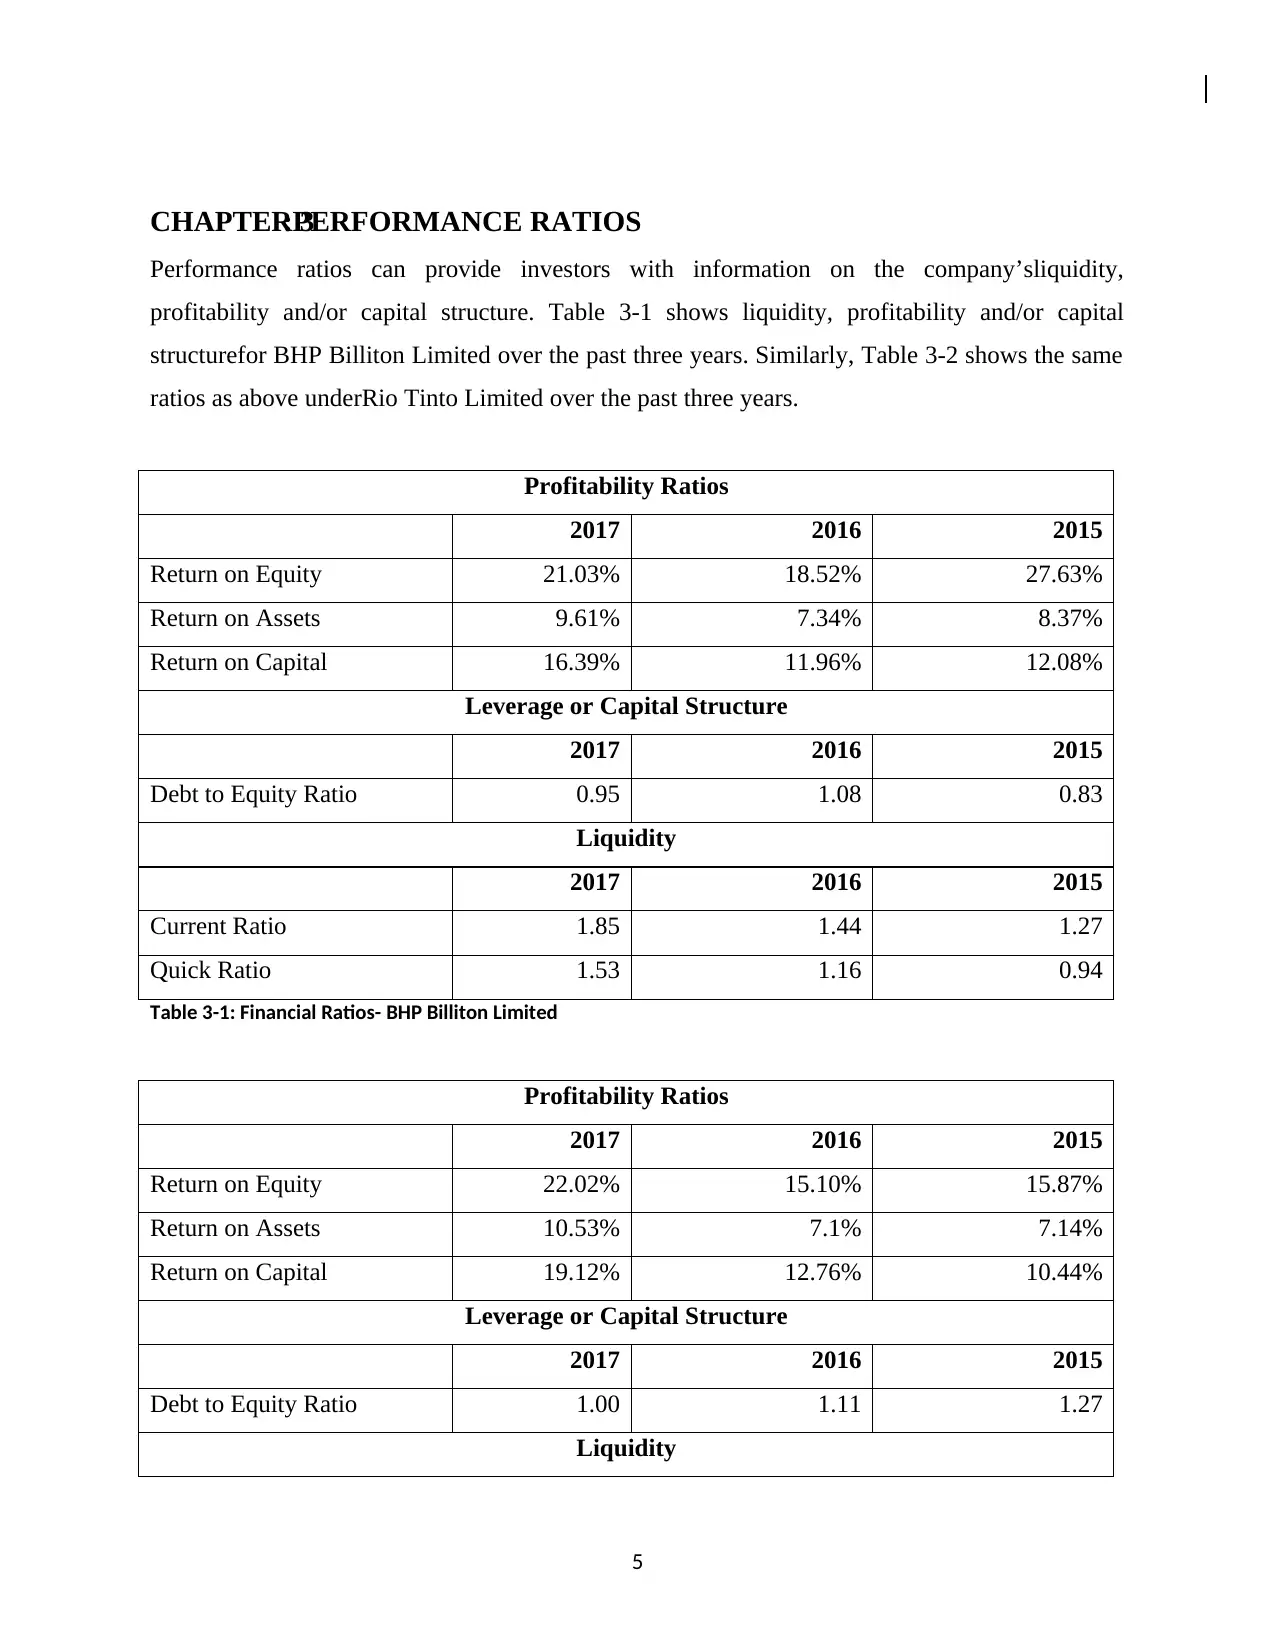
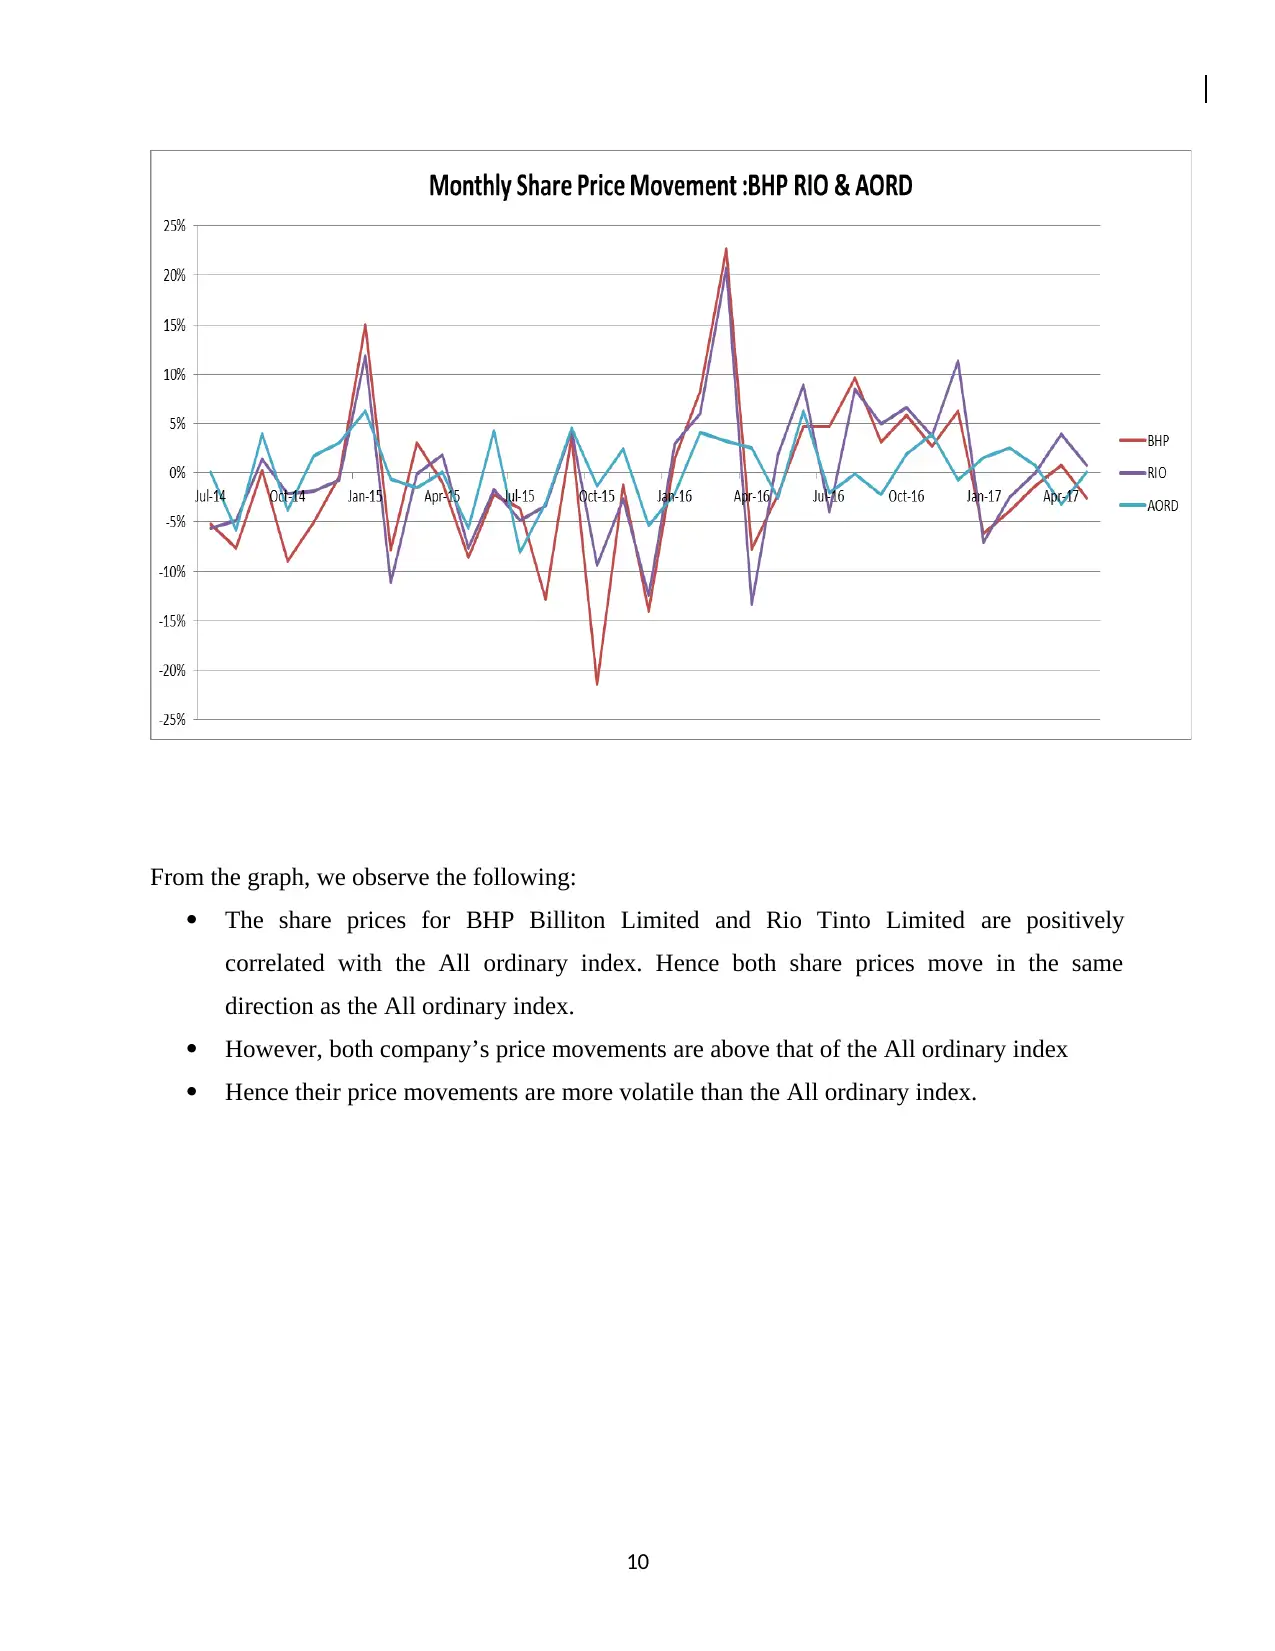
This report provides a comparative financial analysis of BHP Billiton Limited (BHP) and Rio Tinto Limited (RIO), two major companies in the mining and natural resources sector. It begins with an introduction and then explores the operations and comparative advantages of each company. The report then delves into performance ratios, including profitability, liquidity, and leverage, calculated over a three-year period. It analyzes share price movements, identifies factors influencing these movements, and determines beta values and expected rates of return using the CAPM model. The dividend policies of both companies are compared, followed by a letter of recommendation to investors. The report concludes with references and an appendix, offering a comprehensive overview of the financial performance and investment potential of BHP and RIO.

HI5002 Finance for Business Group Assignment T2
2018
2018
Paraphrase This Document
Need a fresh take? Get an instant paraphrase of this document with our AI Paraphraser

TABLE OF CONTENTS
TABLE OF CONTENTS...................................................................................................................................1
CHAPTER 1 : INTRODUCTION.......................................................................................................................2
CHAPTER 2 :OPERATIONS AND COMPARATIVE ADVANTAGES....................................................................3
CHAPTER 3 :PERFORMANCE RATIOS...........................................................................................................5
3.1 Profitability Ratio..............................................................................................................................6
3.2Liquidity Ratios..................................................................................................................................7
3.3 Leverage Ratios.................................................................................................................................8
CHAPTER 4 : 2014-2017 SHARE PRICE MOVEMENT.....................................................................................9
CHAPTER 5 : FACTORS THAT MAY HAVE INFLUENCED SHARE PRICE MOVEMENT....................................11
CHAPTER 6 : BETA VALUES AND EXPECTED RATES OF RETURN.................................................................12
CHAPTER 7 : COMPANY DIVIDEND POLICIES.............................................................................................13
CHAPTER 8 : LETTER OF RECOMMENDATION............................................................................................14
CHAPTER 9 : REFERENCES..........................................................................................................................17
CHAPTER 10 : APPENDIX............................................................................................................................19
1

CHAPTER 1: INTRODUCTION
The purpose of this report is to evaluate and compare two companies. The companies we have
chosen in this report are in the mining and natural resources sector. They include Rio Tinto
Limited (RIO) and BHP Billiton Limited (BHP). The report is divided nine sections as follows:
In section two, we discuss the operations and comparative advantages of the two companies.
In section three,we calculate the performance ratios of the two companies based on liquidity,
profitability and capital structure.
In section four, we analyze the share price movement of the two companies within the last three
years.
In section five, the factors that may have influenced the share price are identified.
In section six, the beta values and expected rates of return are determined using CAPM.
In section seven, the dividend policies under the two chosen companies are compared.
In section eight, a letter of recommendation is made to the investor, based on which company
they should invest in.
2
⊘ This is a preview!⊘
Do you want full access?
Subscribe today to unlock all pages.

Trusted by 1+ million students worldwide

CHAPTER 2:OPERATIONS AND COMPARATIVE ADVANTAGES
About BHP Billiton Limited
BHP Billiton Limited (BHP) is a mining company. It produces iron ore and plays a large role in
oil and gas. The company’s core areas include mineral exploration and production, exploration
of petroleum, refining and production.. BHP’s, operations and interests are divided into
Petroleum and Potash, Coal, Copper, Iron ore, and Nickel(BHP, 2018).
Comparative Advantages- BHP
BHP is currently the largest mining company in the world. Unlike its competitors, it is able to
maintain profitability even at periods when the price of commodities falls making it very
efficient.
Furthermore, BHP is well diversified across manycountries and resources, thus lowering its risk
profile. However, the company’s profitability is volatile as it is subject to movements in
commodity prices(The Australian, 2018).
About Rio Tinto
Rio Tinto Limited (RIO) is a company that is involved in metals and mineral exploration,
production and processing. Rio Tinto’s portfolio of assets is made up of four major product
groups: Aluminums, Iron Ore, Copper and Diamonds, Minerals and Energy(Rio Tinto, 2018).
Comparative Advantages- RIO
Rio Tinto is the second largest mining company in the world. It has operations in various regions
including Australia. About 80% of the company’s revenue are through its iron ore operations.
However, in addition to iron ore, Rio Tinto also produces coal, diamonds, bauxite, alumina,
aluminum, uranium, salt copper and gold.
RIO is less diversified than BHP. Therefore, it is sensitive to currency movements and price
changes in iron ore. However, similar to BHP, RIO is an efficient producer of iron ore. Hence it
3
Paraphrase This Document
Need a fresh take? Get an instant paraphrase of this document with our AI Paraphraser

is able to ‘withstand’ abrupt movements in iron ore prices. Furthermore, the company is able to
benefit when higher cost producers close production(The Australian, 2018).
4
benefit when higher cost producers close production(The Australian, 2018).
4

CHAPTER 3:PERFORMANCE RATIOS
Performance ratios can provide investors with information on the company’sliquidity,
profitability and/or capital structure. Table 3-1 shows liquidity, profitability and/or capital
structurefor BHP Billiton Limited over the past three years. Similarly, Table 3-2 shows the same
ratios as above underRio Tinto Limited over the past three years.
Profitability Ratios
2017 2016 2015
Return on Equity 21.03% 18.52% 27.63%
Return on Assets 9.61% 7.34% 8.37%
Return on Capital 16.39% 11.96% 12.08%
Leverage or Capital Structure
2017 2016 2015
Debt to Equity Ratio 0.95 1.08 0.83
Liquidity
2017 2016 2015
Current Ratio 1.85 1.44 1.27
Quick Ratio 1.53 1.16 0.94
Table 3-1: Financial Ratios- BHP Billiton Limited
Profitability Ratios
2017 2016 2015
Return on Equity 22.02% 15.10% 15.87%
Return on Assets 10.53% 7.1% 7.14%
Return on Capital 19.12% 12.76% 10.44%
Leverage or Capital Structure
2017 2016 2015
Debt to Equity Ratio 1.00 1.11 1.27
Liquidity
5
⊘ This is a preview!⊘
Do you want full access?
Subscribe today to unlock all pages.

Trusted by 1+ million students worldwide

2017 2016 2015
Current Ratio 1.69 1.60 1.53
Quick Ratio 1.38 1.29 1.22
Table 3-2: Financial Ratios- Rio Tinto Limited
3.1 Profitability Ratio
Profitability ratios are used to assess a firm’s ability to use its assets or capital to generate profits.
Examples of profitability ratio are return on assets (ROA), return on equity (roe) and return on
invested capital (ROIC).
Return on Assets (ROA)
ROA measures how efficiently the company's assets have been used to generate profits.
ROA = Net Income+ Interest Expense∗(1−Tax rate)
Average Total Assets
A large ratio suggests that the company has a good return on assets and hence is properly
managed.
The ROA for BHP and Rio increased in 2017. However, Rio Tinto had a higher ROA in 2017
compared to BHP indicating that Rio Tinto was operating more efficiently.
Return on Equity- DuPont
The ROE ratio analyses the ability of a company to realize an adequate return on the capital
invested by the owners or shareholder of the company. A large ratio shows efficiency.
However, it is important to note that the ROE alone does not say anything about the capital
structure. As a result, analysts have split the ratio into three which is the basis of the DuPont
Model(Ro, 2015)
Return on Equity = Net Income
Sales x Sales
Total Assets x Total Assets
Shareholde r ' sEquity
6
Paraphrase This Document
Need a fresh take? Get an instant paraphrase of this document with our AI Paraphraser

The ROE for BHP and Rio increased in 2017. However, Rio Tinto had a higher ROE in 2017
compared to BHP indicating that Rio Tinto is utilizing its capital successfully.
Return on Capital
The ROIC analyses the return an investment releases to its contributors of capital. In other
words, it indicates the efficiency of how a firm turns its contributor’s capital into profits
(Investing Answers, 2017).
Return on Capital = Net Income−D ividends
Invested Capital
The ROIC for both companies increased in 2017. However, Rio Tinto had a higher ROIC in
2017 compared to BHP indicating that the company is convertingits invested capital into profits.
3.2Liquidity Ratios
Liquidity ratios assess the liquidity risk for the company i.e. the company’s ability or inability to
pay its obligations in the short term. Examples of liquidity ratios are the quick (also known as the
acid test ratio) and current ratio (Subramanya & Wild, 2009). A company that has a liquidity
ratio above 1 suggests that there is a greater assurance that the company’s current short term
obligations can be settled by their current assets. Hence, such a company company does not have
a problem of liquidity.
Current ratio = Current assets/current liabilities
Quick ratio = (cash and cash equivalents + marketable securities + accounts receivable) / current
liabilities
In 2017, BHP and RIO showed a current ratio of 1.85 and 1.69 respectively. In the same year,
they showed a quick ratio of 1.53 and 1.38 respectively. Both companies do not have a risk in
liquidity.
7

3.3 Leverage Ratios
These ratios analyse whether a company can meets their long term liabilities. An example of a
ratio is the debt to equity ratio. In 2015-2017, the debt to equity ratio for both companies has
been high (in some cases above 1). This suggests the companies have a lot of debt and hence
presents a solvency risk.
8
⊘ This is a preview!⊘
Do you want full access?
Subscribe today to unlock all pages.

Trusted by 1+ million students worldwide

CHAPTER 4: 2014-2017 SHARE PRICE MOVEMENT
The graph below shows the movements in the monthly share price over the last three years for
Rio Tinto and BHP.
From the graph, we observe the following
The share prices for BHP Billiton Limited and Rio Tinto Limited are positively
correlated with each other. Hence both share prices move in the same direction.
Generally, movement of prices has been closely correlated.
Returns have reached up to 23% in respect to BHP, and 21% in respect to Rio.
The graph below shows the two company’s share price movements, including movements inthe
All Ordinaries Index.
9
Paraphrase This Document
Need a fresh take? Get an instant paraphrase of this document with our AI Paraphraser

From the graph, we observe the following:
The share prices for BHP Billiton Limited and Rio Tinto Limited are positively
correlated with the All ordinary index. Hence both share prices move in the same
direction as the All ordinary index.
However, both company’s price movements are above that of the All ordinary index
Hence their price movements are more volatile than the All ordinary index.
10

CHAPTER 5: FACTORS THAT MAY HAVE INFLUENCED SHARE PRICE
MOVEMENT
BHP Billiton Ltd
In 2016, BHP Billiton announced that its first-half results would include write-downs worth
US$911m relating to closures and redundancies within the group, including the revaluation of its
copper business and iron ore production. Following this announcement, share prices in BHP
Billiton droppedby over 4% (Australian Associated Press, 2016).
In 2015, following a dam collapse in Brazil that resulted in the country’s worst environmental
disaster, BHP’s share price fell across all markets, falling 22 per cent in Sydney and 23 per cent
in both London and Johannesburg between 5 November 2015 and 30 November 2015. The falls
wiped $25bn off the company’s value(Independent, 2018).
Rio Tinto Ltd
In 2017, Rio Tinto announced that it will buy back another $US 2.5 billion of shares. As a result,
due to the announcement, share prices increased despite the drop in iron ore prices(Gray, 2017).
In 2014, Rio Tinto issued a statement that it had rejected to enter a takeover approach from
Glencore Plc. This merger would have created a $160 billion mining giant. Following this
announcement, Rio’s share price increased as much as 4.7 percent to a 9-day high. Glencore was
down 2.1 percent (Reuters, 2014).
11
⊘ This is a preview!⊘
Do you want full access?
Subscribe today to unlock all pages.

Trusted by 1+ million students worldwide
1 out of 21
Related Documents

Your All-in-One AI-Powered Toolkit for Academic Success.
+13062052269
info@desklib.com
Available 24*7 on WhatsApp / Email
Unlock your academic potential
Copyright © 2020–2025 A2Z Services. All Rights Reserved. Developed and managed by ZUCOL.