Analyzing Business Intelligence for Data-Driven Decision Making

Verified

Added on  2023/06/08

|13
|2171
|131
Report
AI Summary
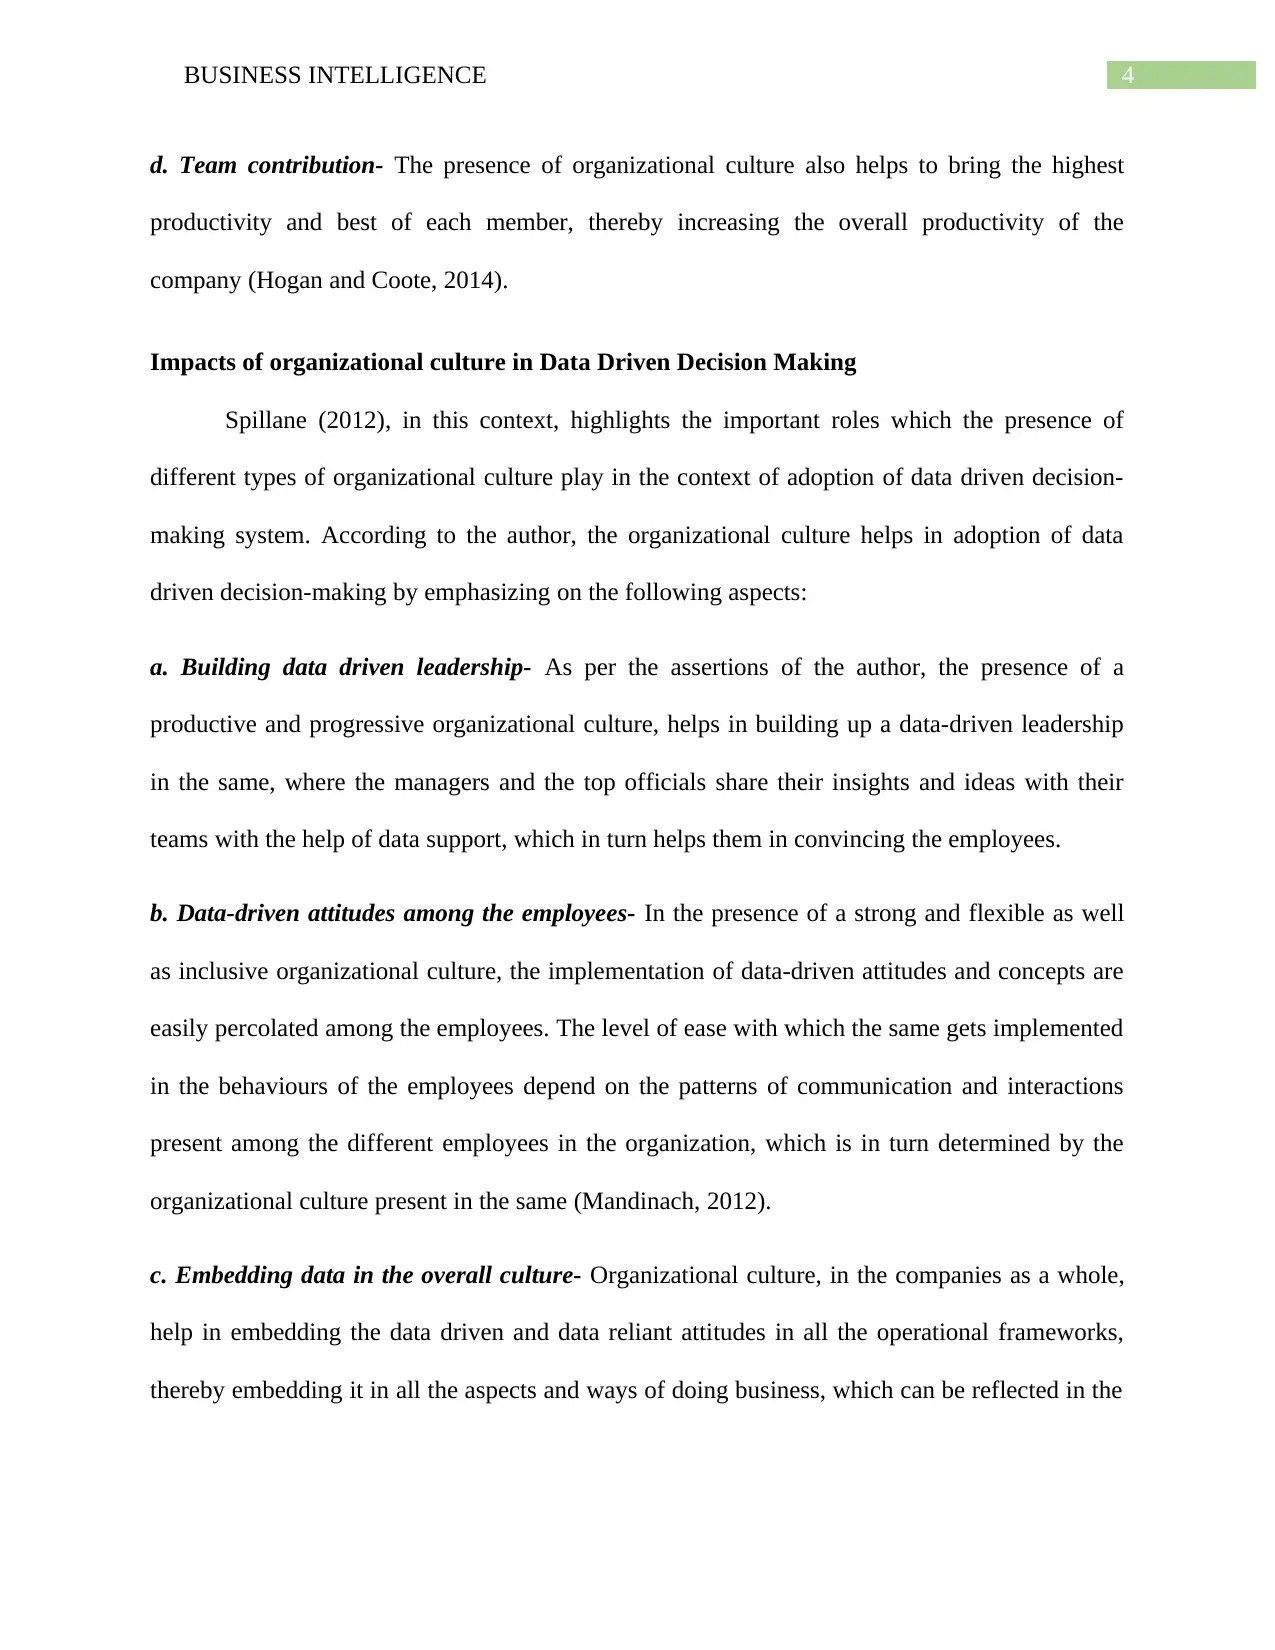
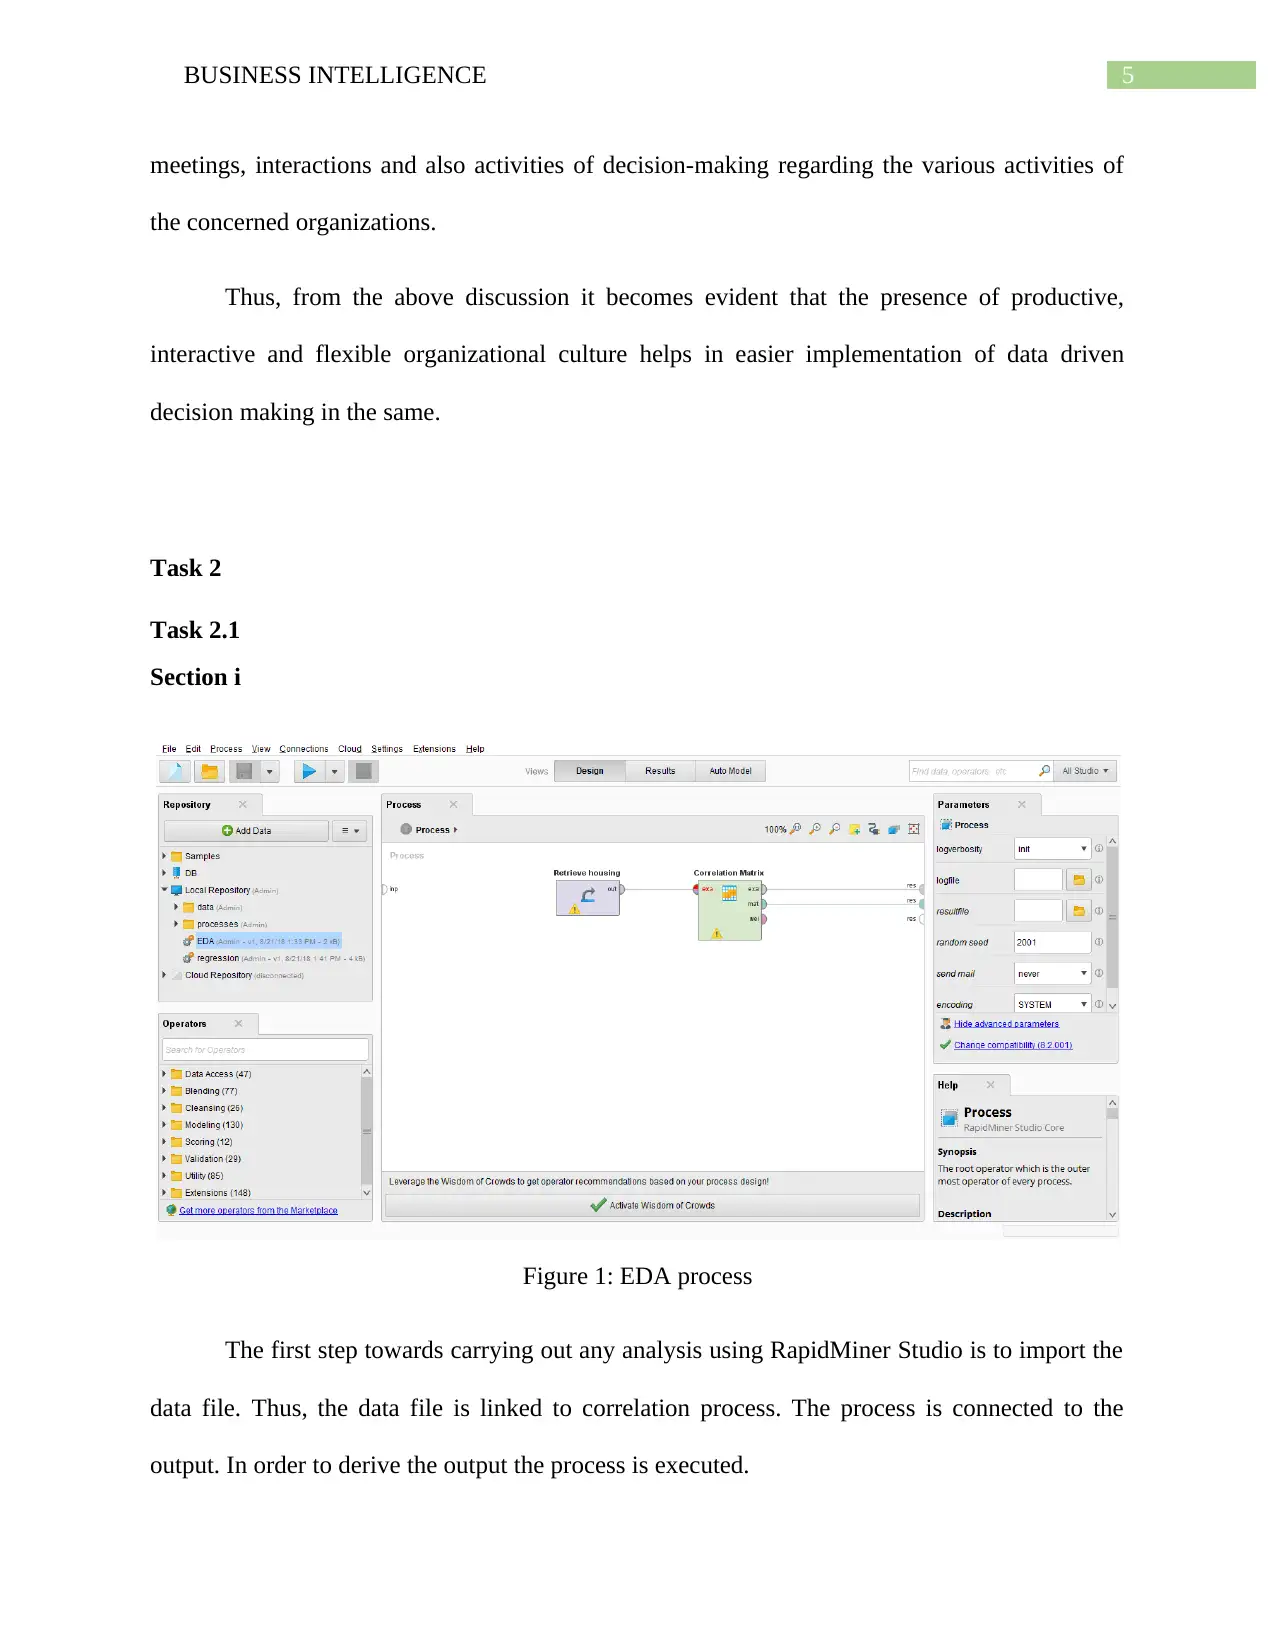
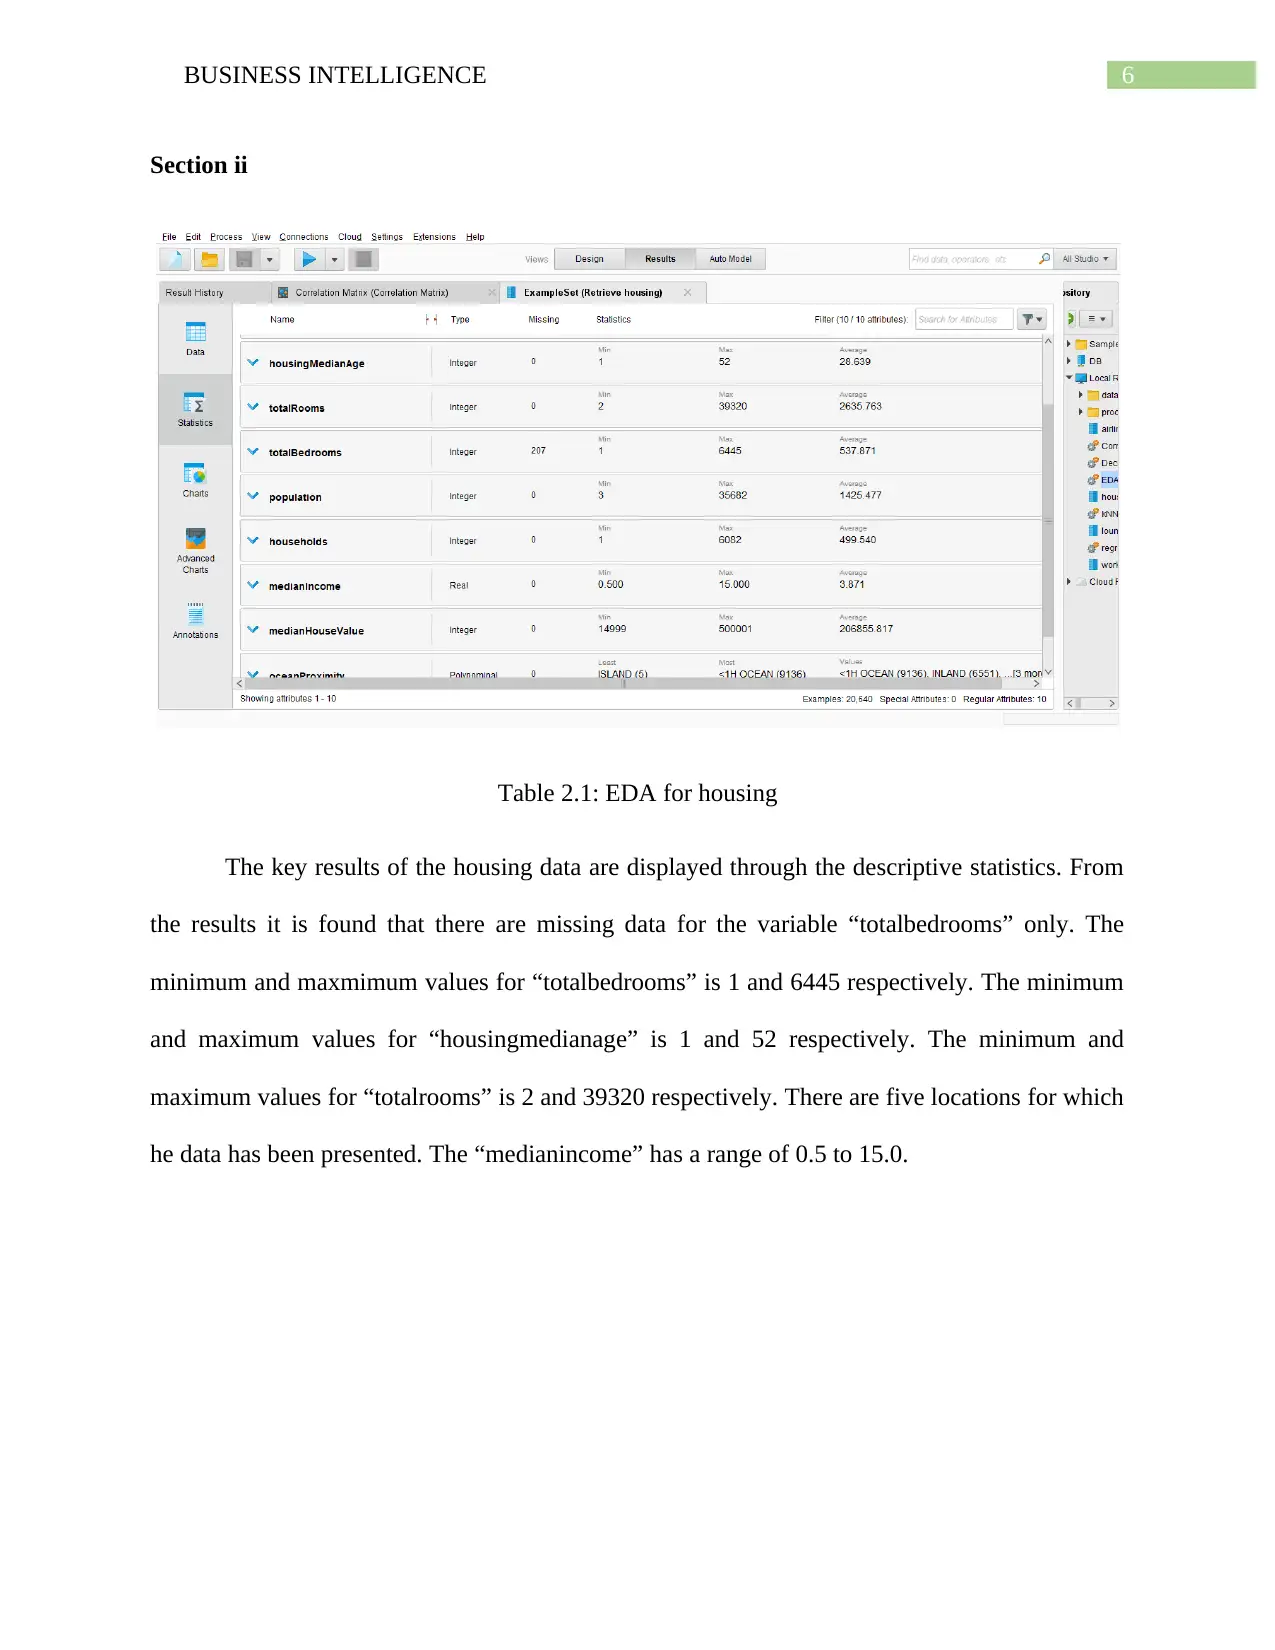
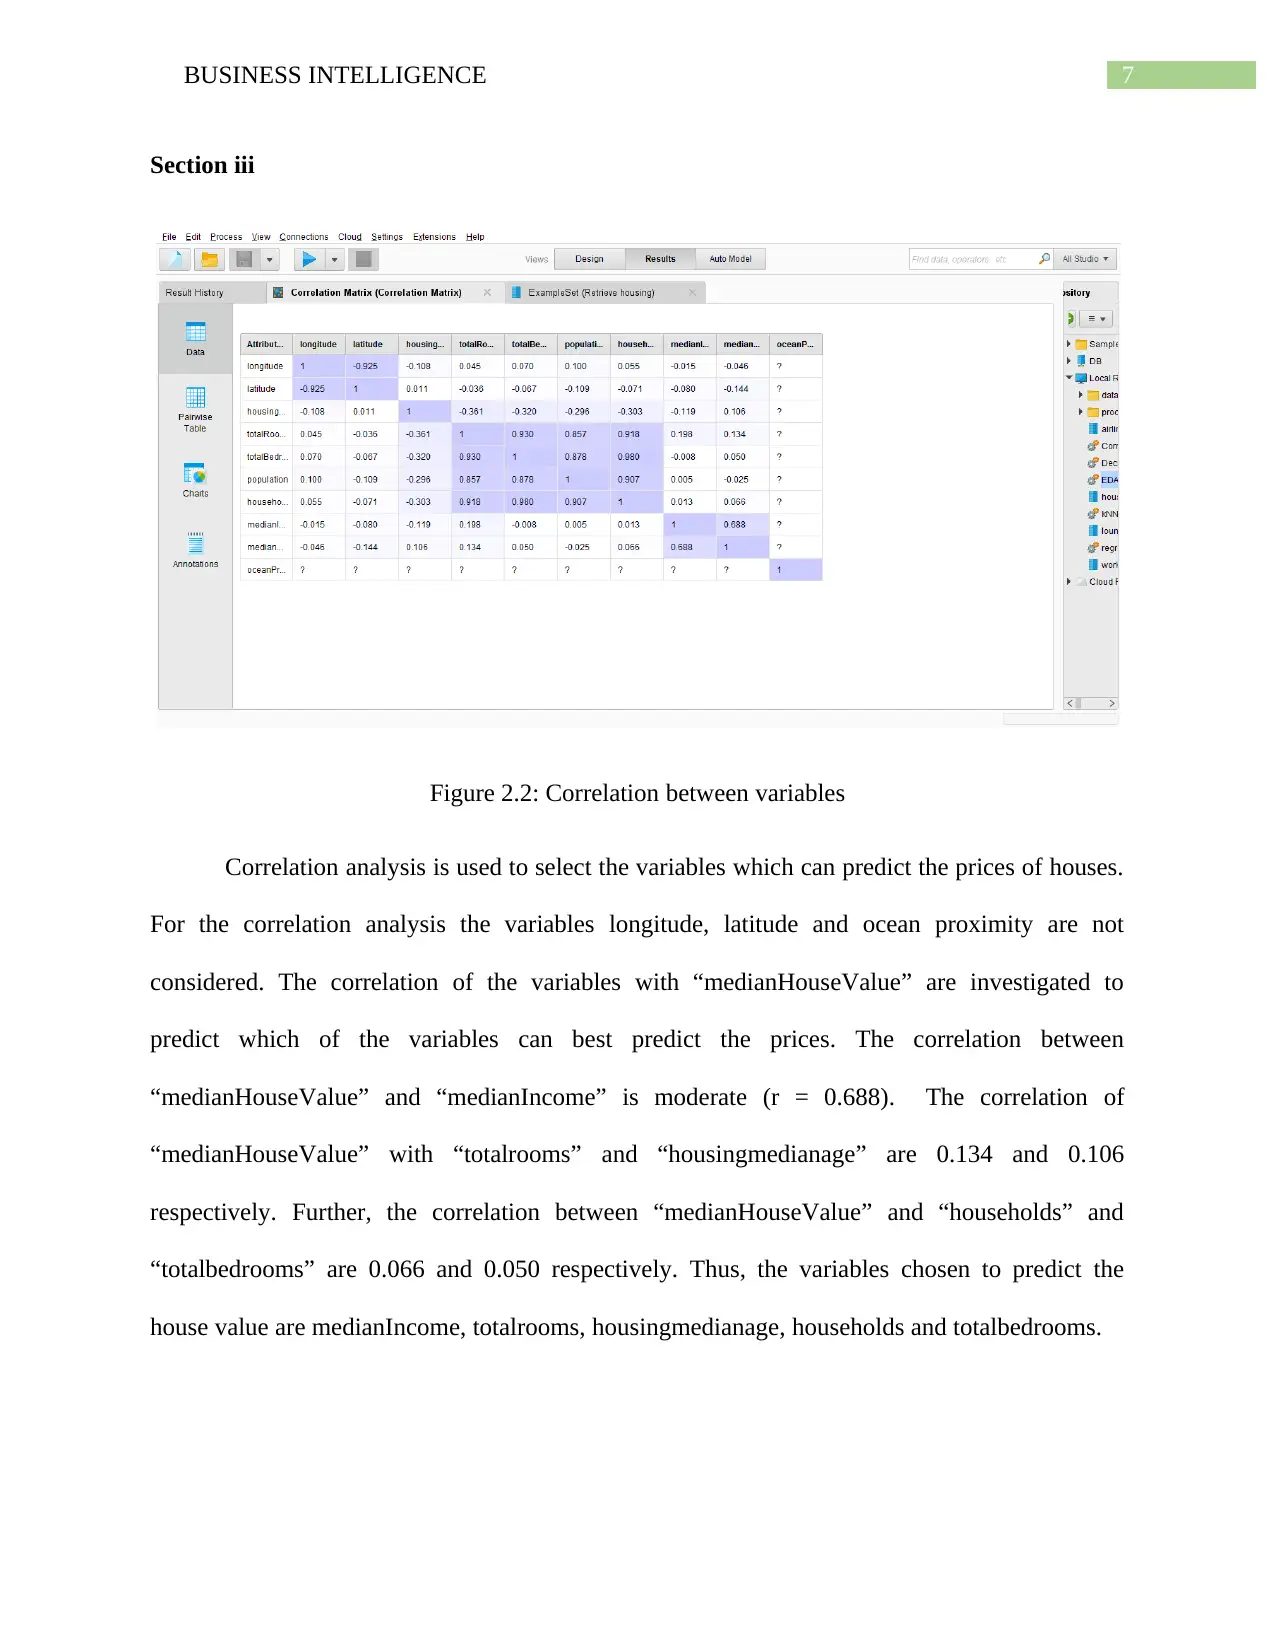
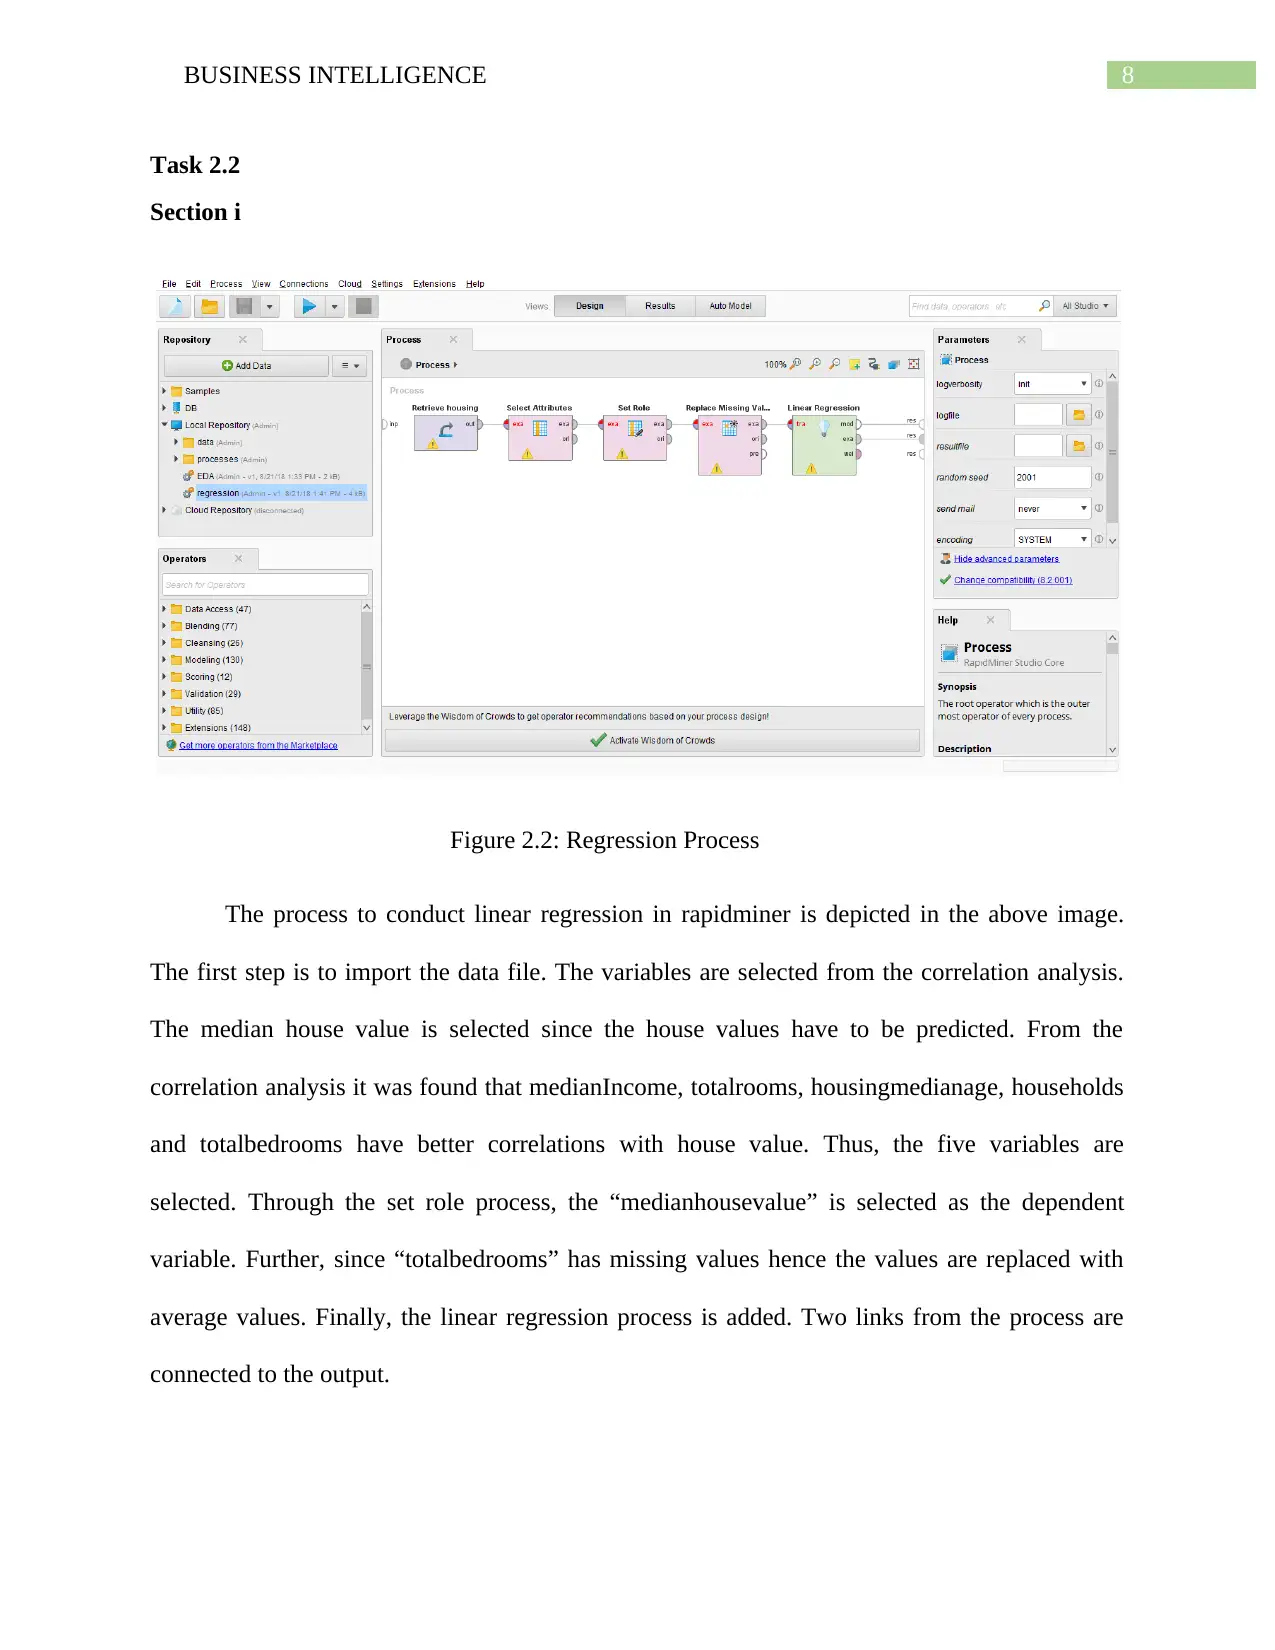
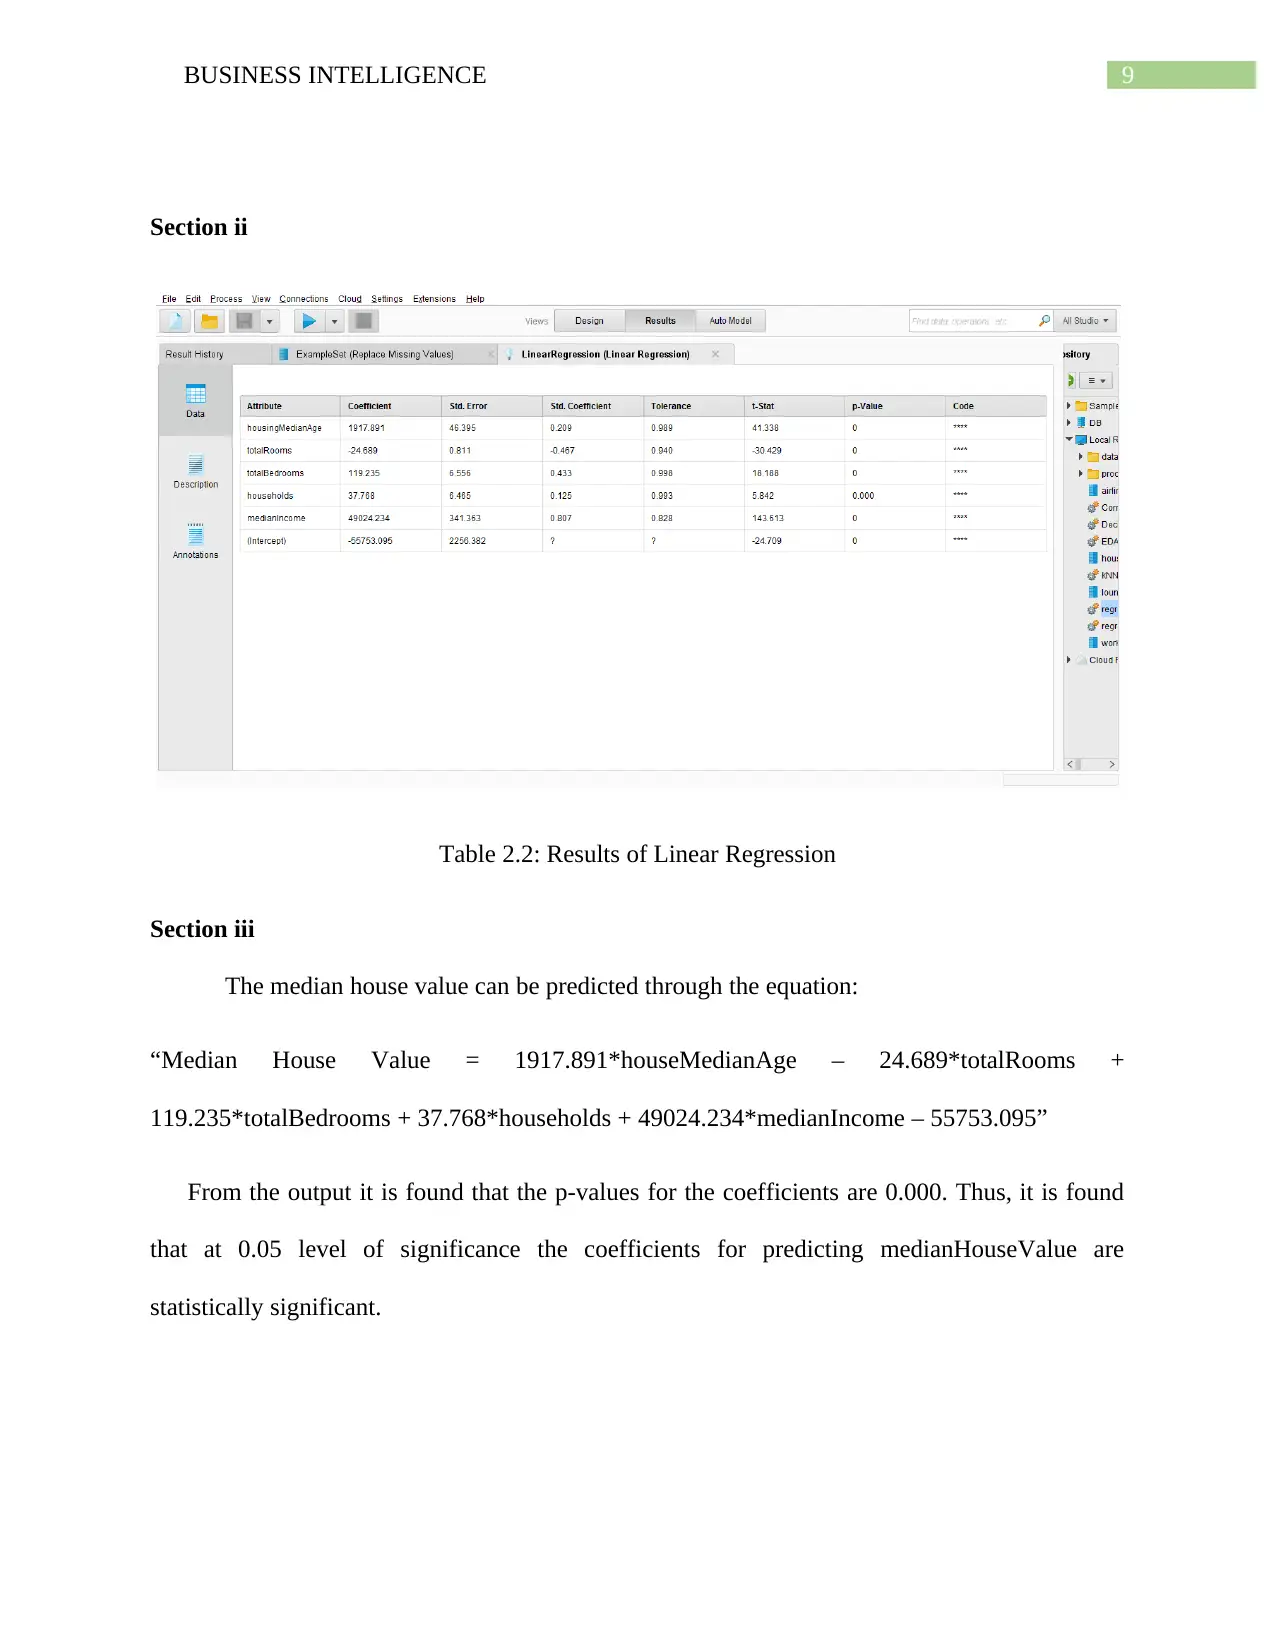
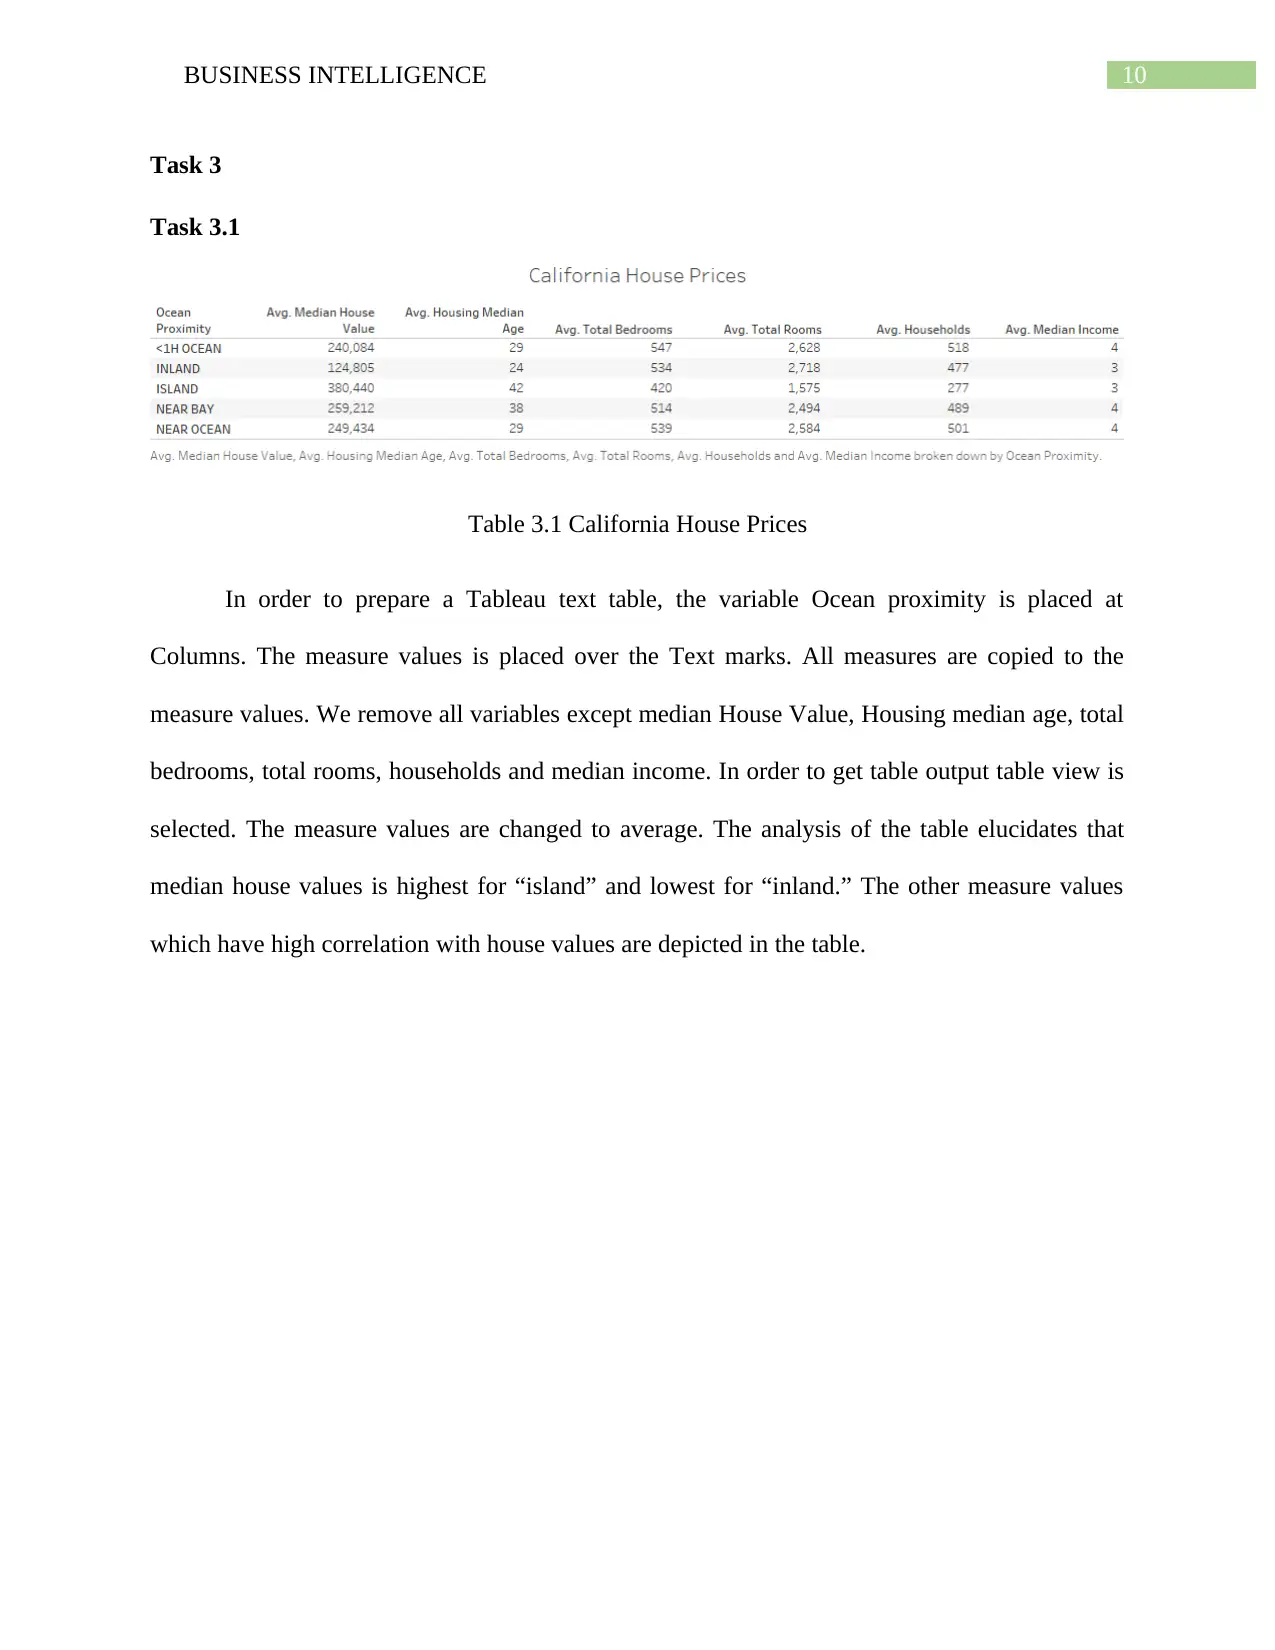
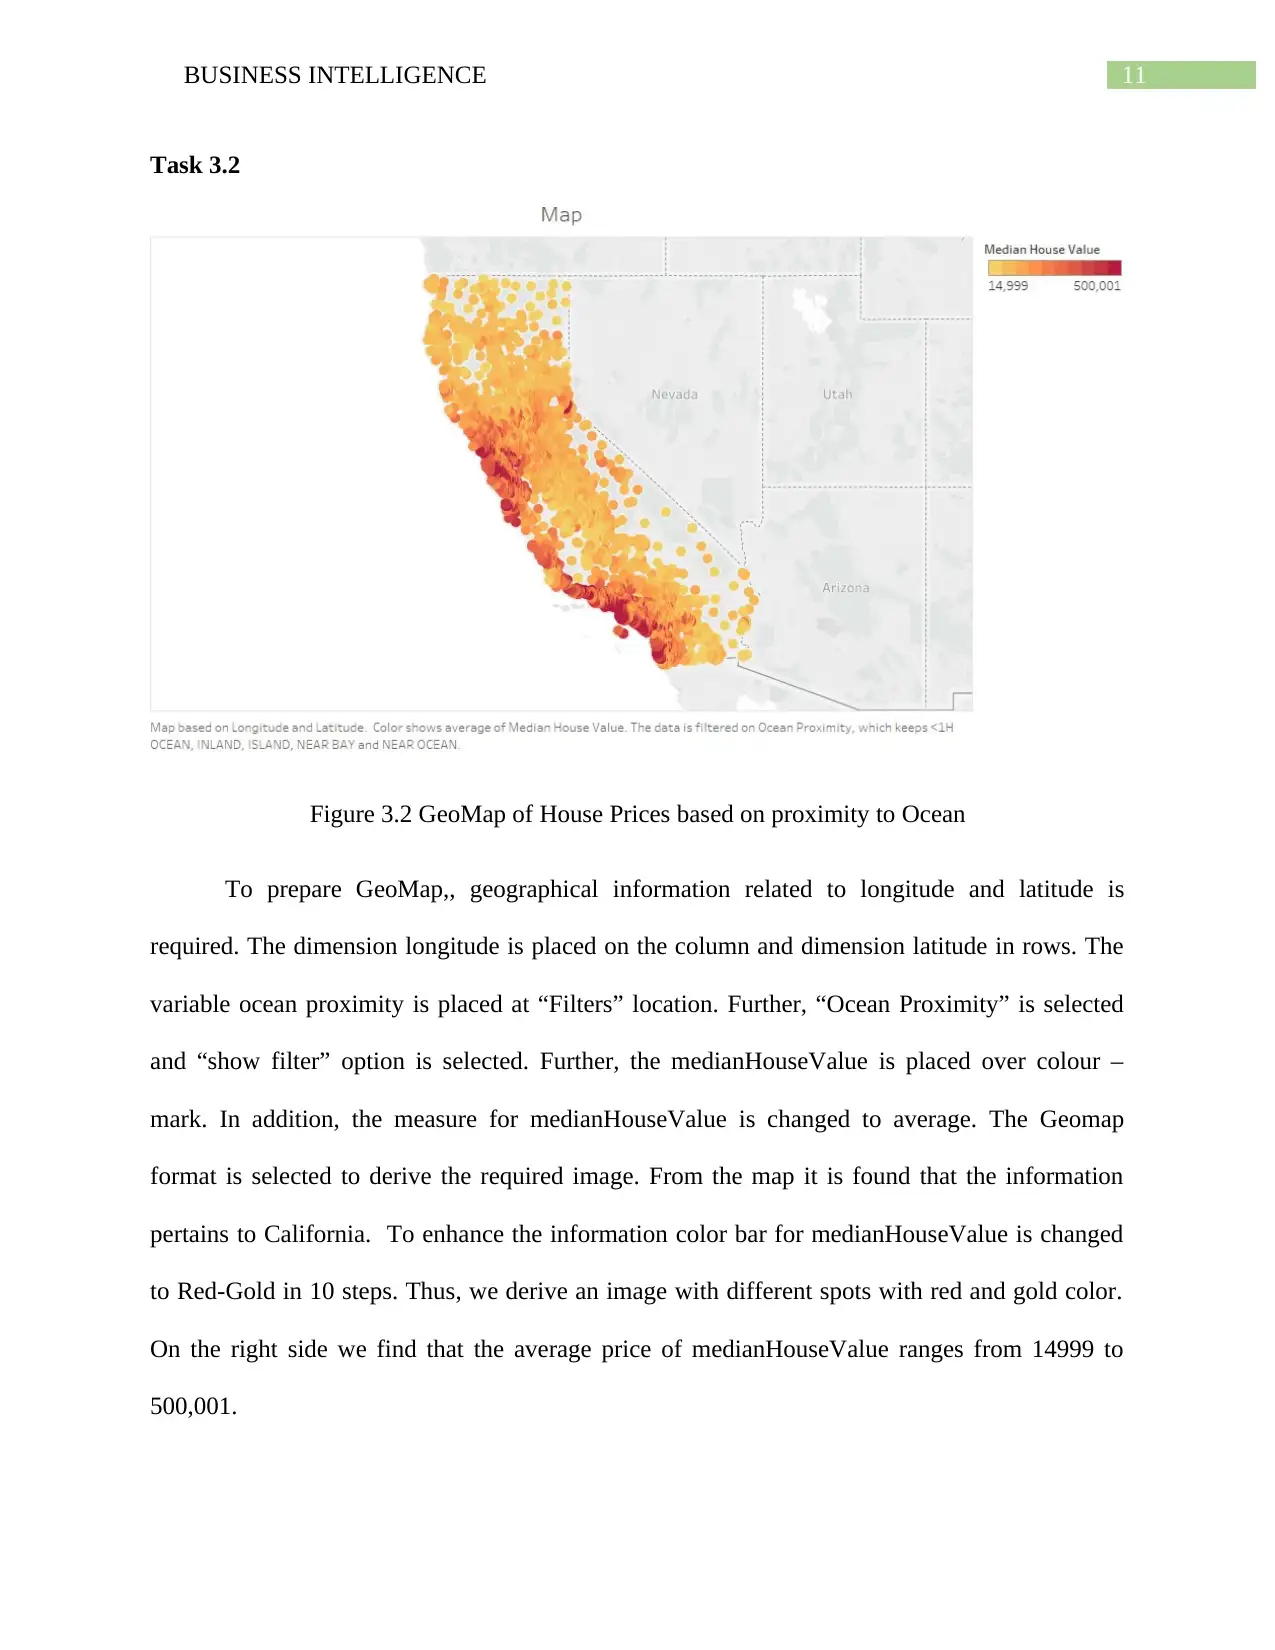
This report provides an overview of business intelligence and its impact on data-driven decision-making within organizations. It begins by defining organizational culture and data-driven decision-making, highlighting the significance of organizational culture in shaping employee interactions, providing direction, and fostering team contributions. The report then explores how organizational culture influences the adoption of data-driven decision-making by building data-driven leadership, promoting data-driven attitudes among employees, and embedding data in the overall culture. Furthermore, the report includes a practical analysis using RapidMiner Studio to perform exploratory data analysis (EDA) on housing data, identifying key variables for predicting house prices through correlation analysis and linear regression. Finally, the report demonstrates the use of Tableau to visualize California house prices based on ocean proximity, creating a text table and a GeoMap to analyze and present the data effectively. Desklib provides access to this and other solved assignments to aid students in their studies.
Document Page
Running Head: BUSINESS INTELLIGENCE
Business Intelligence
Name of the Student
Name of the University
Author Note
tabler-icon-diamond-filled.svg

Paraphrase This Document

Need a fresh take? Get an instant paraphrase of this document with our AI Paraphraser
Document Page
1BUSINESS INTELLIGENCE
Table of Contents
Task 1...............................................................................................................................................2
Task 1.1........................................................................................................................................2
Task 1.2........................................................................................................................................2
Task 2...............................................................................................................................................5
Task 2.1........................................................................................................................................5
Section i.......................................................................................................................................5
Section ii......................................................................................................................................6
Section iii.....................................................................................................................................8
Task 2.2........................................................................................................................................9
Section i.......................................................................................................................................9
Section ii....................................................................................................................................10
Section iii...................................................................................................................................10
Task 3.............................................................................................................................................11
Task 3.1......................................................................................................................................11
Task 3.2......................................................................................................................................12
References......................................................................................................................................13
Document Page
2BUSINESS INTELLIGENCE
Task 1
Task 1.1
Organizational Culture
In the contemporary global commercial and business scenario, with the increasing
integration and inclusiveness of businesses across the globe and with the occurrence of
internationally influencing phenomena like Globalisation, trade liberalisation as well as
technological and infrastructural innovations, the dynamics in the operational framework of the
organizations across the globe, especially the commercial ones, have been increasing both in
magnitude as well as in variety (Nica, 2013). In this case the organizational culture plays a vital
role in the overall operational framework as well as in determining the profitability, prospects
and overall competitiveness and sustainability of the organizations.
In this context, Alvesson and Sveningsson (2015), defines the term, “Organizational
Culture” as the underlying beliefs, values and assumptions and also the interacting patterns
within the organizations, which in turn contribute in building up the working as well social
environment of the same. Dauber, Fink and Yolles (2012), assert that the culture in an
organization include the vision, norms, values and habits and is based on the shared attitudes,
customs as well as rules (written or unwritten) which are present and are also observed by the
people in the organizations.
Data Driven Decision Making
On the other hand, another component of organizational framework in the contemporary
period is that of the aspects of Data Driven Decision Making. Diván (2017), highlights the same
as the method of organizational (productive and other operational) decision makings in an
Document Page
3BUSINESS INTELLIGENCE
institution or organization based on the statistical evidences and hard data. Over the years, with
the development of technology and computing operations, this method of decision making has
been becoming increasingly popular and is rapidly replacing those forms of decision making
which used to be intuitive or were based on personal assumptions and observations (McAfee et
al., 2012).
Task 1.2
The work of Hogan and Coote (2014), in this context, highlights the significance of
organizational culture and the roles played by the same in the overall operational framework of
the organizations, especially in the contemporary period, the primary ones of which can be
shown as follows:
a. Interactions- The organizational culture helps in designing the communicating and interaction
ways of the employees in the concerned organizations.
b. Sense of direction- Every organization has their own set of rules and guidelines (either written
or un-written) which in general depict the organizational behaviour. The presence of robust and
interactive organizational culture, in this context, helps the employees to receive proper guidance
regarding their job roles and expectations from them, which in turn facilitates in the aspects of
provision of a sense of direction to the employees (Scott, 2015).
c. Same platform for employees- As Scott (2015), argues, the presence of a robust and
productive organizational culture helps in incorporating all the diversities of different employees,
thereby helping to bringing them on the same platform by uniting the employees, which in turn
makes it easier for the organizations to provide instruction and guidance to the employees more
uniformly.
tabler-icon-diamond-filled.svg

Paraphrase This Document

Need a fresh take? Get an instant paraphrase of this document with our AI Paraphraser
Document Page
4BUSINESS INTELLIGENCE
d. Team contribution- The presence of organizational culture also helps to bring the highest
productivity and best of each member, thereby increasing the overall productivity of the
company (Hogan and Coote, 2014).
Impacts of organizational culture in Data Driven Decision Making
Spillane (2012), in this context, highlights the important roles which the presence of
different types of organizational culture play in the context of adoption of data driven decision-
making system. According to the author, the organizational culture helps in adoption of data
driven decision-making by emphasizing on the following aspects:
a. Building data driven leadership- As per the assertions of the author, the presence of a
productive and progressive organizational culture, helps in building up a data-driven leadership
in the same, where the managers and the top officials share their insights and ideas with their
teams with the help of data support, which in turn helps them in convincing the employees.
b. Data-driven attitudes among the employees- In the presence of a strong and flexible as well
as inclusive organizational culture, the implementation of data-driven attitudes and concepts are
easily percolated among the employees. The level of ease with which the same gets implemented
in the behaviours of the employees depend on the patterns of communication and interactions
present among the different employees in the organization, which is in turn determined by the
organizational culture present in the same (Mandinach, 2012).
c. Embedding data in the overall culture- Organizational culture, in the companies as a whole,
help in embedding the data driven and data reliant attitudes in all the operational frameworks,
thereby embedding it in all the aspects and ways of doing business, which can be reflected in the
Document Page
5BUSINESS INTELLIGENCE
meetings, interactions and also activities of decision-making regarding the various activities of
the concerned organizations.
Thus, from the above discussion it becomes evident that the presence of productive,
interactive and flexible organizational culture helps in easier implementation of data driven
decision making in the same.
Task 2
Task 2.1
Section i
Figure 1: EDA process
The first step towards carrying out any analysis using RapidMiner Studio is to import the
data file. Thus, the data file is linked to correlation process. The process is connected to the
output. In order to derive the output the process is executed.
Document Page
6BUSINESS INTELLIGENCE
Section ii
Table 2.1: EDA for housing
The key results of the housing data are displayed through the descriptive statistics. From
the results it is found that there are missing data for the variable “totalbedrooms” only. The
minimum and maxmimum values for “totalbedrooms” is 1 and 6445 respectively. The minimum
and maximum values for “housingmedianage” is 1 and 52 respectively. The minimum and
maximum values for “totalrooms” is 2 and 39320 respectively. There are five locations for which
he data has been presented. The “medianincome” has a range of 0.5 to 15.0.
tabler-icon-diamond-filled.svg

Paraphrase This Document

Need a fresh take? Get an instant paraphrase of this document with our AI Paraphraser
Document Page
7BUSINESS INTELLIGENCE
Section iii
Figure 2.2: Correlation between variables
Correlation analysis is used to select the variables which can predict the prices of houses.
For the correlation analysis the variables longitude, latitude and ocean proximity are not
considered. The correlation of the variables with “medianHouseValue” are investigated to
predict which of the variables can best predict the prices. The correlation between
“medianHouseValue” and “medianIncome” is moderate (r = 0.688). The correlation of
“medianHouseValue” with “totalrooms” and “housingmedianage” are 0.134 and 0.106
respectively. Further, the correlation between “medianHouseValue” and “households” and
“totalbedrooms” are 0.066 and 0.050 respectively. Thus, the variables chosen to predict the
house value are medianIncome, totalrooms, housingmedianage, households and totalbedrooms.
Document Page
8BUSINESS INTELLIGENCE
Task 2.2
Section i
Figure 2.2: Regression Process
The process to conduct linear regression in rapidminer is depicted in the above image.
The first step is to import the data file. The variables are selected from the correlation analysis.
The median house value is selected since the house values have to be predicted. From the
correlation analysis it was found that medianIncome, totalrooms, housingmedianage, households
and totalbedrooms have better correlations with house value. Thus, the five variables are
selected. Through the set role process, the “medianhousevalue” is selected as the dependent
variable. Further, since “totalbedrooms” has missing values hence the values are replaced with
average values. Finally, the linear regression process is added. Two links from the process are
connected to the output.
Document Page
9BUSINESS INTELLIGENCE
Section ii
Table 2.2: Results of Linear Regression
Section iii
The median house value can be predicted through the equation:
“Median House Value = 1917.891*houseMedianAge 24.689*totalRooms +
119.235*totalBedrooms + 37.768*households + 49024.234*medianIncome – 55753.095”
From the output it is found that the p-values for the coefficients are 0.000. Thus, it is found
that at 0.05 level of significance the coefficients for predicting medianHouseValue are
statistically significant.
tabler-icon-diamond-filled.svg

Paraphrase This Document

Need a fresh take? Get an instant paraphrase of this document with our AI Paraphraser
Document Page
10BUSINESS INTELLIGENCE
Task 3
Task 3.1
Table 3.1 California House Prices
In order to prepare a Tableau text table, the variable Ocean proximity is placed at
Columns. The measure values is placed over the Text marks. All measures are copied to the
measure values. We remove all variables except median House Value, Housing median age, total
bedrooms, total rooms, households and median income. In order to get table output table view is
selected. The measure values are changed to average. The analysis of the table elucidates that
median house values is highest for “island” and lowest for “inland.” The other measure values
which have high correlation with house values are depicted in the table.
Document Page
11BUSINESS INTELLIGENCE
Task 3.2
Figure 3.2 GeoMap of House Prices based on proximity to Ocean
To prepare GeoMap,, geographical information related to longitude and latitude is
required. The dimension longitude is placed on the column and dimension latitude in rows. The
variable ocean proximity is placed at “Filters” location. Further, “Ocean Proximity” is selected
and “show filter” option is selected. Further, the medianHouseValue is placed over colour –
mark. In addition, the measure for medianHouseValue is changed to average. The Geomap
format is selected to derive the required image. From the map it is found that the information
pertains to California. To enhance the information color bar for medianHouseValue is changed
to Red-Gold in 10 steps. Thus, we derive an image with different spots with red and gold color.
On the right side we find that the average price of medianHouseValue ranges from 14999 to
500,001.
chevron_up_icon
1 out of 13
circle_padding
hide_on_mobile
zoom_out_icon
[object Object]