ITECH7406 - BI & Data Warehousing: Environmental Analytics Report
VerifiedAdded on 2023/06/07
|20
|3833
|357
Report
AI Summary
This report addresses ecological issues using business intelligence tools, focusing on descriptive and prescriptive analysis. It highlights the impact of CO2 on the environment and proposes a BI reporting solution using analytics, including dashboards for visualization. The report examines energy consumption and its correlation with environmental degradation, aiming to inform students about applying SAP Business Object/Predictive Analytics for environmental problem-solving. It also touches upon potential mobile application designs for environmental monitoring and concludes with a justification for using BI reporting to mitigate environmental issues in organizations.

Data Warehouse and Business Analytics
Paraphrase This Document
Need a fresh take? Get an instant paraphrase of this document with our AI Paraphraser
Table of Contents
1. Introduction..........................................................................................................1
2. Problem Statement..............................................................................................2
3. Environment and related Issues........................................................................3
4. Impact of CO2 Use on Environment..................................................................4
5. BI Reporting Solution using Analytics..............................................................6
1.1 Prescriptive Analysis....................................................................................6
1.1.1 Dashboard...............................................................................................6
1.2 Descriptive Analysis.....................................................................................8
1.2.1 Dashboard...............................................................................................8
1.3 Dash board Prototype.................................................................................11
6. Design Mobile Application................................................................................12
7. Justification of BI Reporting Solution to deduct Environmental issues in
Organizations............................................................................................................13
8. Conclusion..........................................................................................................15
References................................................................................................................16
1
1. Introduction
This report isolates the ecological issues by utilizing business Intelligence
wisdom gadget, for example, Dashboard. This report will facilitate two exceptional
sorts of investigation and they are Descriptive examination and Prescriptive
examination. Generally, this is a business examination undertaking which produces
inventive investigation plans. The essential idea of this report is to educate the
understudies to address their capacities to the extent headway and innovativeness
for SAP Business Object or Predictive Analytics application, as it requires illustrating
the beneficial recognition reactions for exhibiting the judicious models to perceive
precise issues. The examination here is related with ecological issues with help of
Dashboard. Moreover, the report solicitations to execute logical instruments to make
inventive examination discernment courses of action and insightful models for the
issues of condition. The issue that is stress in this report is imperativeness use. In
any case, there are diverse ecological issues like, water diminish, ozone draining
substance transmission, natural change, essentialness usage, defilement et cetera.
At present, the major ecological issues are sullying, Loss of Biodiversity, a perilous
air deviation, Climate Change, overpopulation, Waste Disposal, Environmental
Resource Depletion, Deforestation, Ozone Layer Depletion, Ocean Acidification,
Acid Rain, water pollution, general medicinal issues and so forth. Today it is
unquestionable that the earth is changing dependably and it can't be denied.
According to the alteration in the earth, it is vital to wind up aware of its related
issues in our including. Distinctive climatic changes are happening a direct result of
warming and cooling periods, which are the delayed consequences of calamitous
occasions. It is required that people know the natural risks our planet is standing up
to. The objective of this report is to choose how high imperativeness usage can
2
⊘ This is a preview!⊘
Do you want full access?
Subscribe today to unlock all pages.
Trusted by 1+ million students worldwide
cause natural corruption. Regarding confirmation, descriptive investigation and
prescriptive investigation will be destitute down in this report, using a dashboard.
With the help of the dashboard, the essential execution markers will be perceived.
2. Problem Statement
As determined in the introduction, the provided topic is about ecological issues.
The issue is the establishments for the ecological issues are not recognized. CO2
causes main problem is debasing our condition. This examination requires through
examination for choosing how high use of CO2 can cause ecological sullying. The
association between imperativeness use and ecological issues must be addressed,
for upgrading the earth. The examination is difficult to find along these lines, the
business Intelligence gadget for instance Dashboard is prescribed for clear view of
data("3 Biggest Ways to Reduce Your Environmental Impact", 2018).
3. Environment and related Issues
With the extension in a Global warming, the present natural capacity are in
peril. Despite the way that it isn't the principle natural issue which should be locked
in. Around the world, testing natural issues are looked by each one of the all-
inclusive community once every day. One such issue is imperativeness usage.
Certain issues are little which can barely affect the ecological framework, anyway
there exists certain ecological issues which unquestionably change nature. Planet
Earth is on the plain edge of various natural catastrophes. The current ecological
issues assembles the vulnerabilities to catastrophes and tragedies. If these issues
are not tended to painstakingly, the planet is destined for a disaster. The current
ecological issues must be gone to frantically. The all in community on this planet are
possessed in their own specific world and have no chance to consider the future
3
Paraphrase This Document
Need a fresh take? Get an instant paraphrase of this document with our AI Paraphraser
age, in light of the way that their little rashness can provoke troublesome issue,
which can't be exchanged later on. Without a doubt, even there might be no future
using any and all means. The indispensable point is that it is hard to physically stop
the damages caused to the ozone layer, yet there are distinctive advances which
can be taken for instance, growing the care in the area systems and families will
have a little responsibility towards nature("Business Intelligence Dashboard", 2018).
Correspondingly, if little get-togethers clasp hands it can transform into a significant
social affair and broad duty, which will have neighbourly place to live.
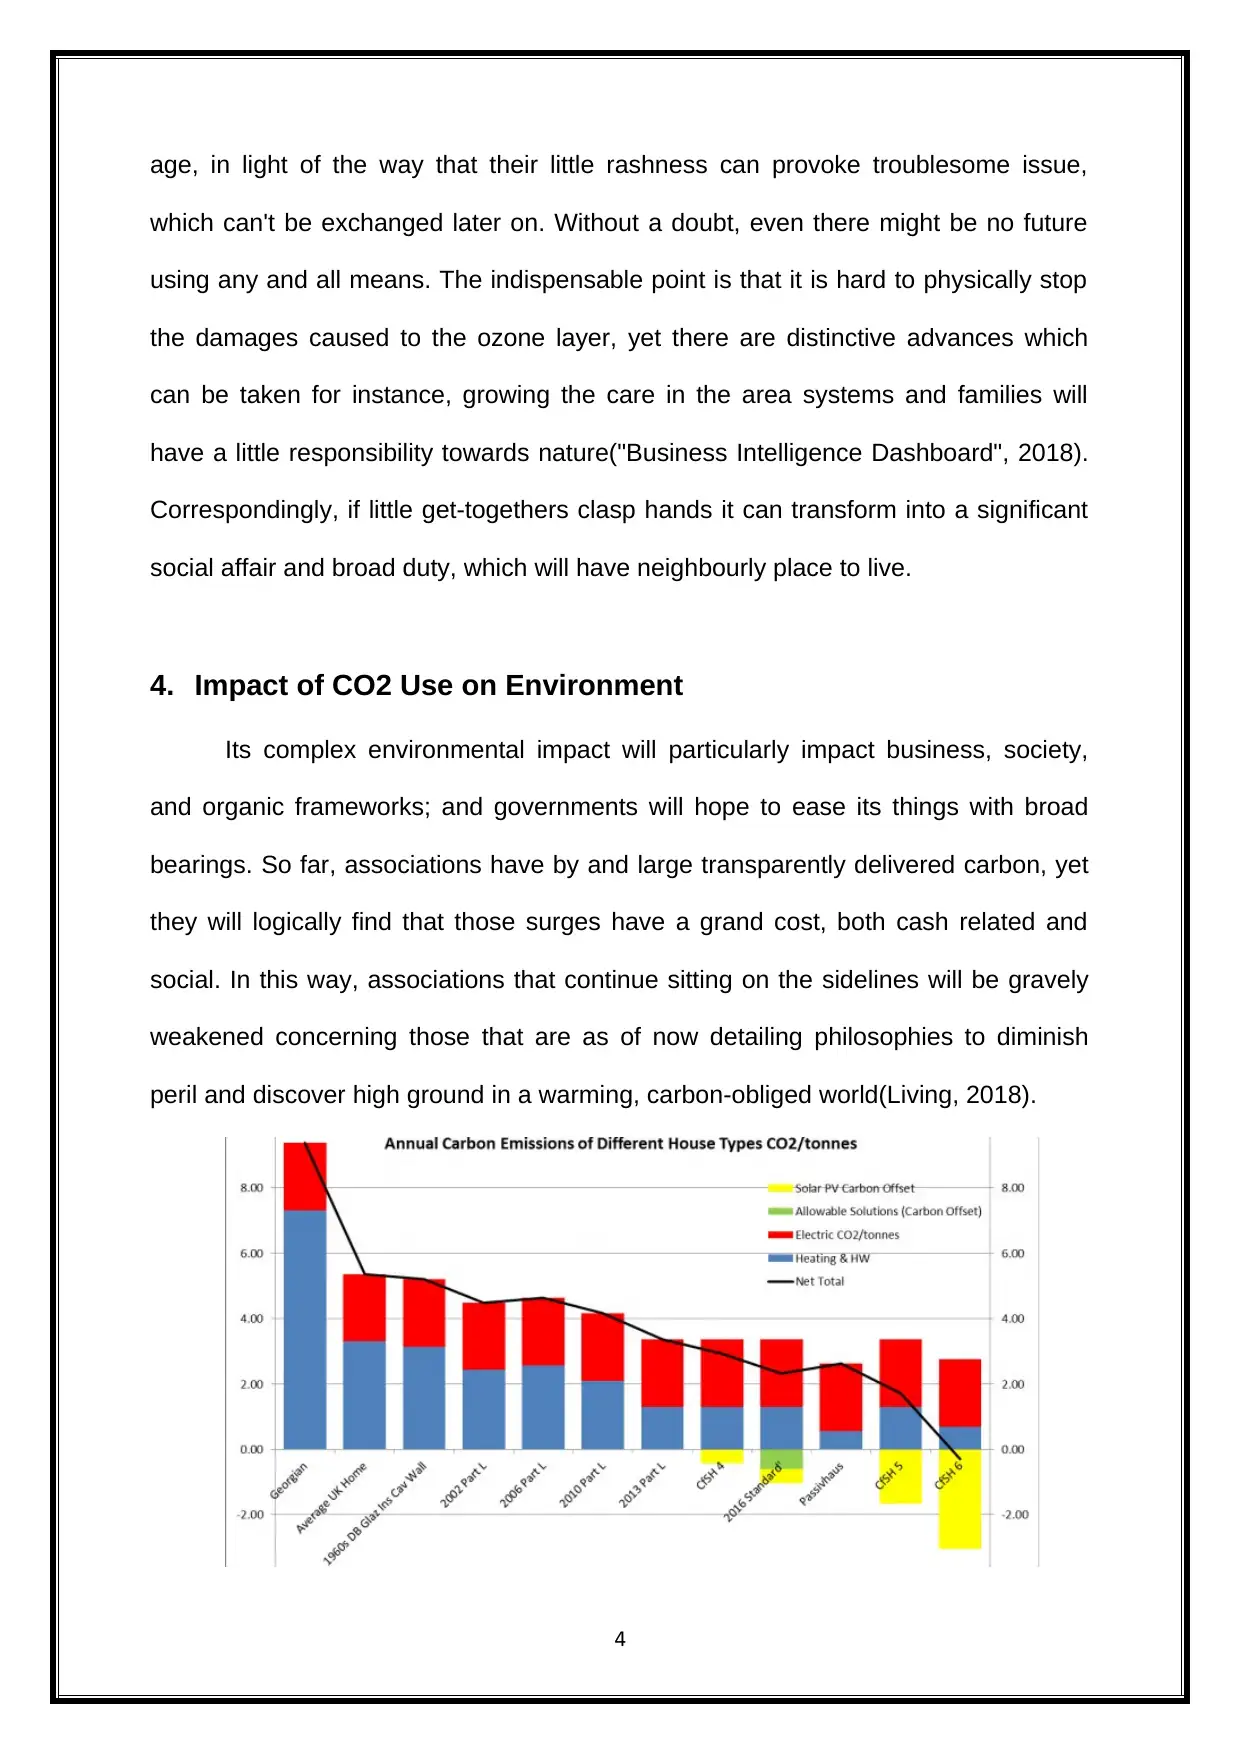
4. Impact of CO2 Use on Environment
Its complex environmental impact will particularly impact business, society,
and organic frameworks; and governments will hope to ease its things with broad
bearings. So far, associations have by and large transparently delivered carbon, yet
they will logically find that those surges have a grand cost, both cash related and
social. In this way, associations that continue sitting on the sidelines will be gravely
weakened concerning those that are as of now detailing philosophies to diminish
peril and discover high ground in a warming, carbon-obliged world(Living, 2018).
4
which can't be exchanged later on. Without a doubt, even there might be no future
using any and all means. The indispensable point is that it is hard to physically stop
the damages caused to the ozone layer, yet there are distinctive advances which
can be taken for instance, growing the care in the area systems and families will
have a little responsibility towards nature("Business Intelligence Dashboard", 2018).
Correspondingly, if little get-togethers clasp hands it can transform into a significant
social affair and broad duty, which will have neighbourly place to live.
4. Impact of CO2 Use on Environment
Its complex environmental impact will particularly impact business, society,
and organic frameworks; and governments will hope to ease its things with broad
bearings. So far, associations have by and large transparently delivered carbon, yet
they will logically find that those surges have a grand cost, both cash related and
social. In this way, associations that continue sitting on the sidelines will be gravely
weakened concerning those that are as of now detailing philosophies to diminish
peril and discover high ground in a warming, carbon-obliged world(Living, 2018).
4
To understand the back to front impact, heads need to consider the
organization's regard chain. Any regard chain development—inbound coordination,
assignments, outbound coordination's, publicizing, a considerable number of offers
advantage can make releases. The fundamental extent of advantages to mean
outpourings in the regard chain can be a great degree telling proportion of potential
climate influence. If new headings put a cost of, say, $10 a ton on releases, would
that put a vital scratch in the advantages or even swallow them unmitigated?
"Carbon presentation" climbs with the impact of carbon costs on benefits. Like
distinctive threats, carbon presentation passes on open entryways and also
challenges: Forestry associations, for example, may find that removing carbon
dioxide from the air by planting trees may be as beneficial as slashing them down
and conveying paper or compressed wood.
The releases impact of activities in the regard chain can be prompt or
distorted. Releases can be made by a development under the affiliation's quick
control or incited by the firm in the activities of suppliers, channels, and customers.
An association needs to understand the surges it makes its business accessories
convey, and furthermore those it makes itself: Both composes are indispensable
concentrations for diminishment.
These advancing back to front impacts have possibly dynamic implications.
For example, introduce day supply chains, with their transportation-concentrated,
just under the wire stock organization structures, may never again be perfect in a
world with simply more extravagant releases. Additionally, electronic business, with
its duplication of little shipments, may go up against honest to goodness limits.
Likewise, every so often offshoring, which drives up releases by expanding
5
⊘ This is a preview!⊘
Do you want full access?
Subscribe today to unlock all pages.
Trusted by 1+ million students worldwide
transportation pulls, may be supplanted by cut down surges on shoring to near to
gatherings of suppliers
Diverse procedures are accessible for reducing the normal impacts of
imperativeness usage. A part of the procedures are recorded underneath:
Ensure to save essentialness capably.
Change to the sources like cleaner essentialness.
Clean essentialness implies imperativeness capability, maintainable power source,
viable joined warmth and power. The going with centres must be recalled when the
ideal essentialness is seen as:
It contributes for diminishing air pollution.
It add to decrease ozone exhausting substance releases.
Decrease your essentialness usage which will in like manner lessen the
power bills.
It upgrades the imperativeness structure's relentless quality and security.
The clean imperativeness will update the monetary change of a state or an
area with growing the openings for work.
5. BI Reporting Solution using Analytics
1.1 Prescriptive Analysis
The prescriptive Analytics uses the figuring’s like rebuilding and modifying, to
give fruitful interest on the results. The examination finds the required arrangements
like what must be done further. The possible exercises are perceived by this
examination. The specified remedies fill in as course, which prompts the right plan.
The advantages of this examination are great and sensible. Further, it furthermore
helps in essential authority. Notwithstanding the way that it can't predict what may
6
Paraphrase This Document
Need a fresh take? Get an instant paraphrase of this document with our AI Paraphraser
happen in future, anyway it beyond question chooses why it happened and in like
way prescribes some beneficial proposition. The proposition are extraordinary and
can settle the issue.
1.1.1 Dashboard
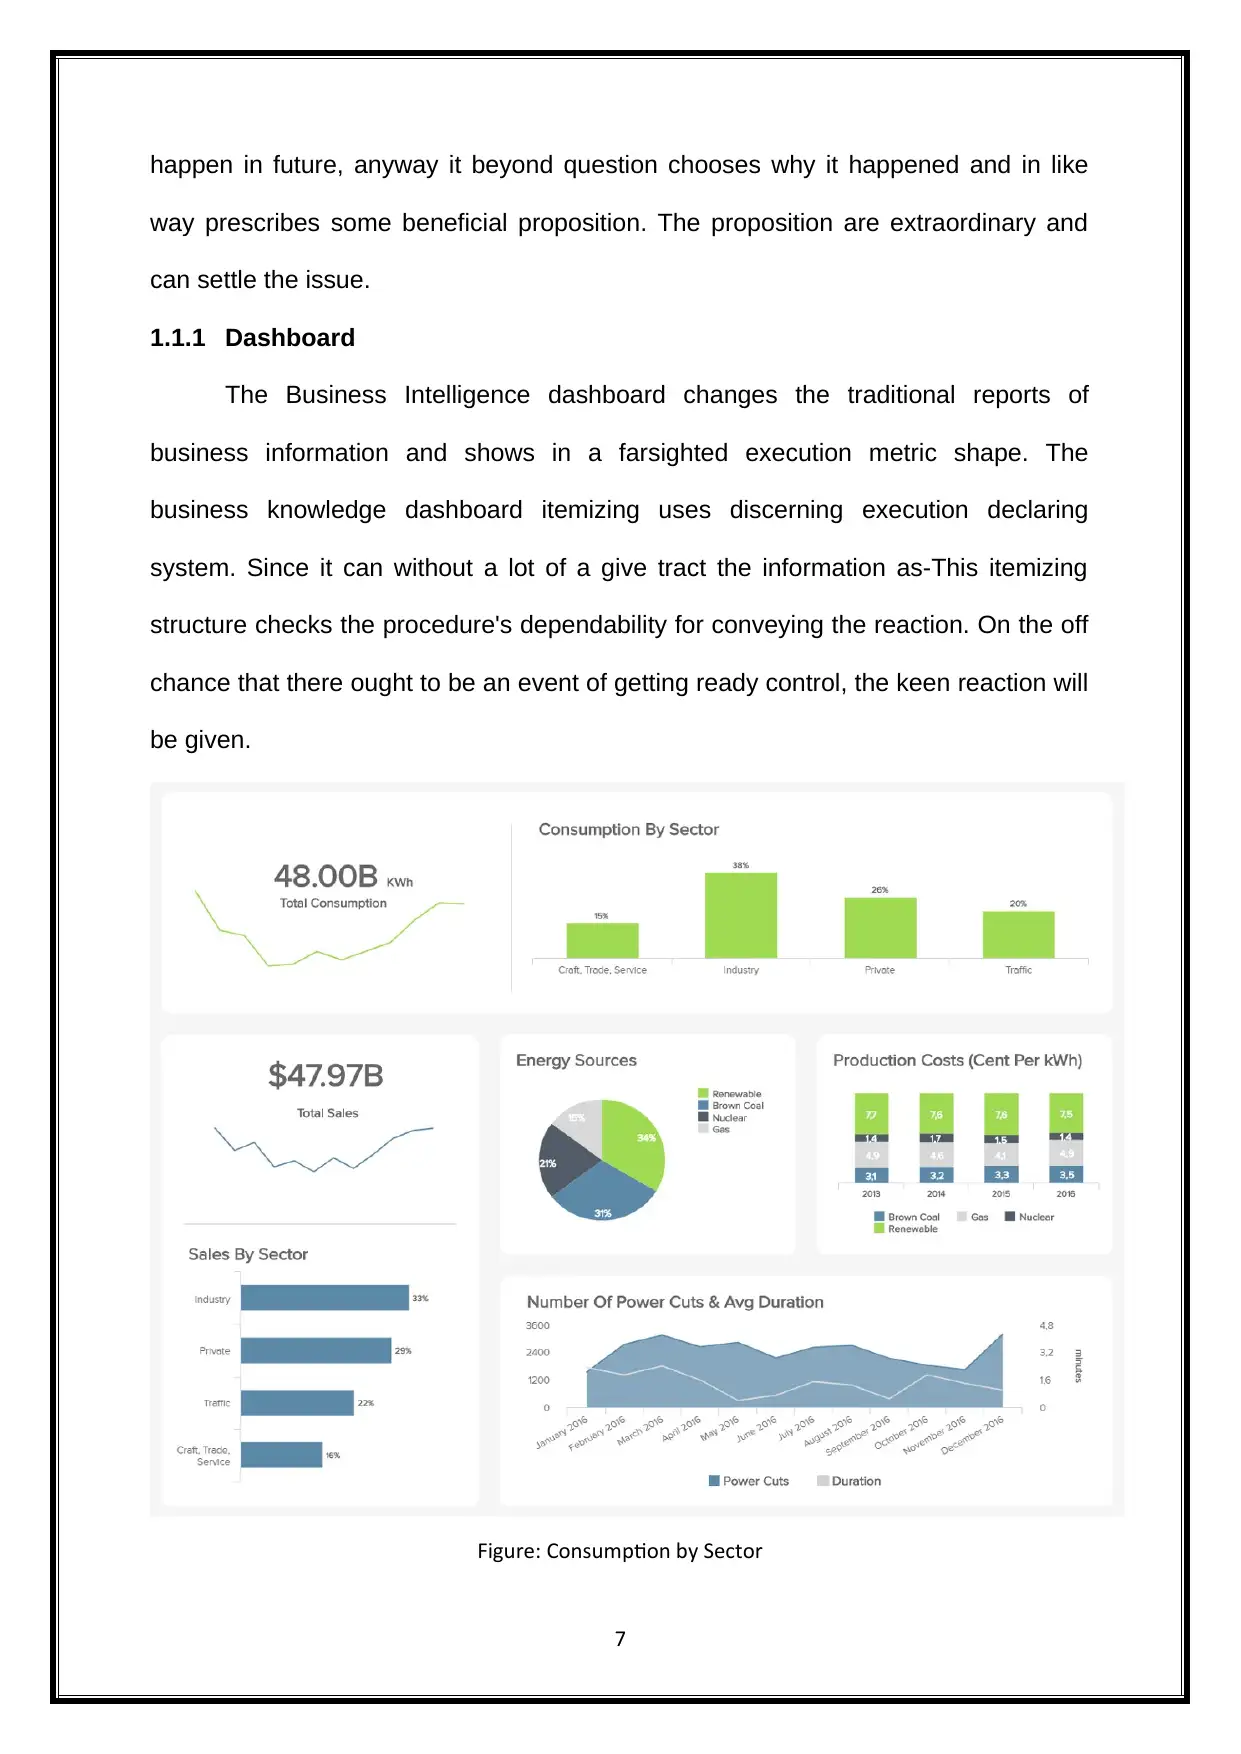
The Business Intelligence dashboard changes the traditional reports of
business information and shows in a farsighted execution metric shape. The
business knowledge dashboard itemizing uses discerning execution declaring
system. Since it can without a lot of a give tract the information as-This itemizing
structure checks the procedure's dependability for conveying the reaction. On the off
chance that there ought to be an event of getting ready control, the keen reaction will
be given.
Figure: Consumption by Sector
7
way prescribes some beneficial proposition. The proposition are extraordinary and
can settle the issue.
1.1.1 Dashboard
The Business Intelligence dashboard changes the traditional reports of
business information and shows in a farsighted execution metric shape. The
business knowledge dashboard itemizing uses discerning execution declaring
system. Since it can without a lot of a give tract the information as-This itemizing
structure checks the procedure's dependability for conveying the reaction. On the off
chance that there ought to be an event of getting ready control, the keen reaction will
be given.
Figure: Consumption by Sector
7
The above figure shows the developed dashboard. The total usage is 48.00B
KWh and the total arrangements is $47.97B. The arrangements by division are
showed up in the dashboard. By then, the amount of force cuts and ordinary length
of power cut can in like manner be settled, as showed up in the figure. The outcomes
of a year are imagined i.e., from January 2016 to December 2016.Followed by
imperativeness sources, i.e., the proportion of practical power source, dull caught
coal, nuclear essentialness and gas are ostensibly addressed using a pie chart. The
zones considered are make, trade, advantage, industry, private division and
development.
1.2 Descriptive Analysis
The Descriptive Analytics is a technique which sponsorships to see the
encounters that happened already("Descriptive, Predictive, and Prescriptive
Analytics Explained", 2018). This examination is demonstrated as an estimation
examination, since it clears up the rough data and assists with deciphering the data
easily. The benefits of this approach is it gives comprehend capacity and clarity. The
sensible data can without quite a bit of a stretch help to isolate the over a wide range
of time, which makes the investigations successfully complete the results of the data
examination. This examination specifies "A minute" time which is passed as past,
similar to "A year." This sort of examination contains diverse purposes of premium
which help the customers with learning fundamental unobtrusive components, when
differentiated and the past direct. It moreover effectively acknowledges the
clarification behind the lead and how it has impact on the future impacts("Designing
and Building Great Dashboards - 6 Golden Rules to Successful Dashboard Design |
Geckoboard", 2018).
8
⊘ This is a preview!⊘
Do you want full access?
Subscribe today to unlock all pages.
Trusted by 1+ million students worldwide
1.2.1 Dashboard
The underneath explanation shows to the dashboard:
The Dashboard is addressed in the underneath figure.
The bar layout is seemed to take a gander at the data.
The option of filtering the data is accessible, where filtration is done
depending upon date, country, state and city.
The site's purposes of intrigue are successfully observed It primarily shows
name, type, country, address and the zone's region, to the extent square
feet.
The dashboard addresses the imperativeness use.
It depicts the outline which exhibits the benchmarks, multi month back and
current month's use and typical temperature.
Calendar is open in the dashboard.
The atmosphere conditions of the region is given.
The essentialness ate up in addressed in kilowatt hour (Kwh).
The key markers could be picked.
Whenever required the atmosphere conditions can be seen, in the
dashboard.
Real time uncovering is given by the dashboard.
It gets to the steady information of the picked site, using the web program.
The required information is given to any contraption, for instance,
convenient or a work region.
9
Paraphrase This Document
Need a fresh take? Get an instant paraphrase of this document with our AI Paraphraser
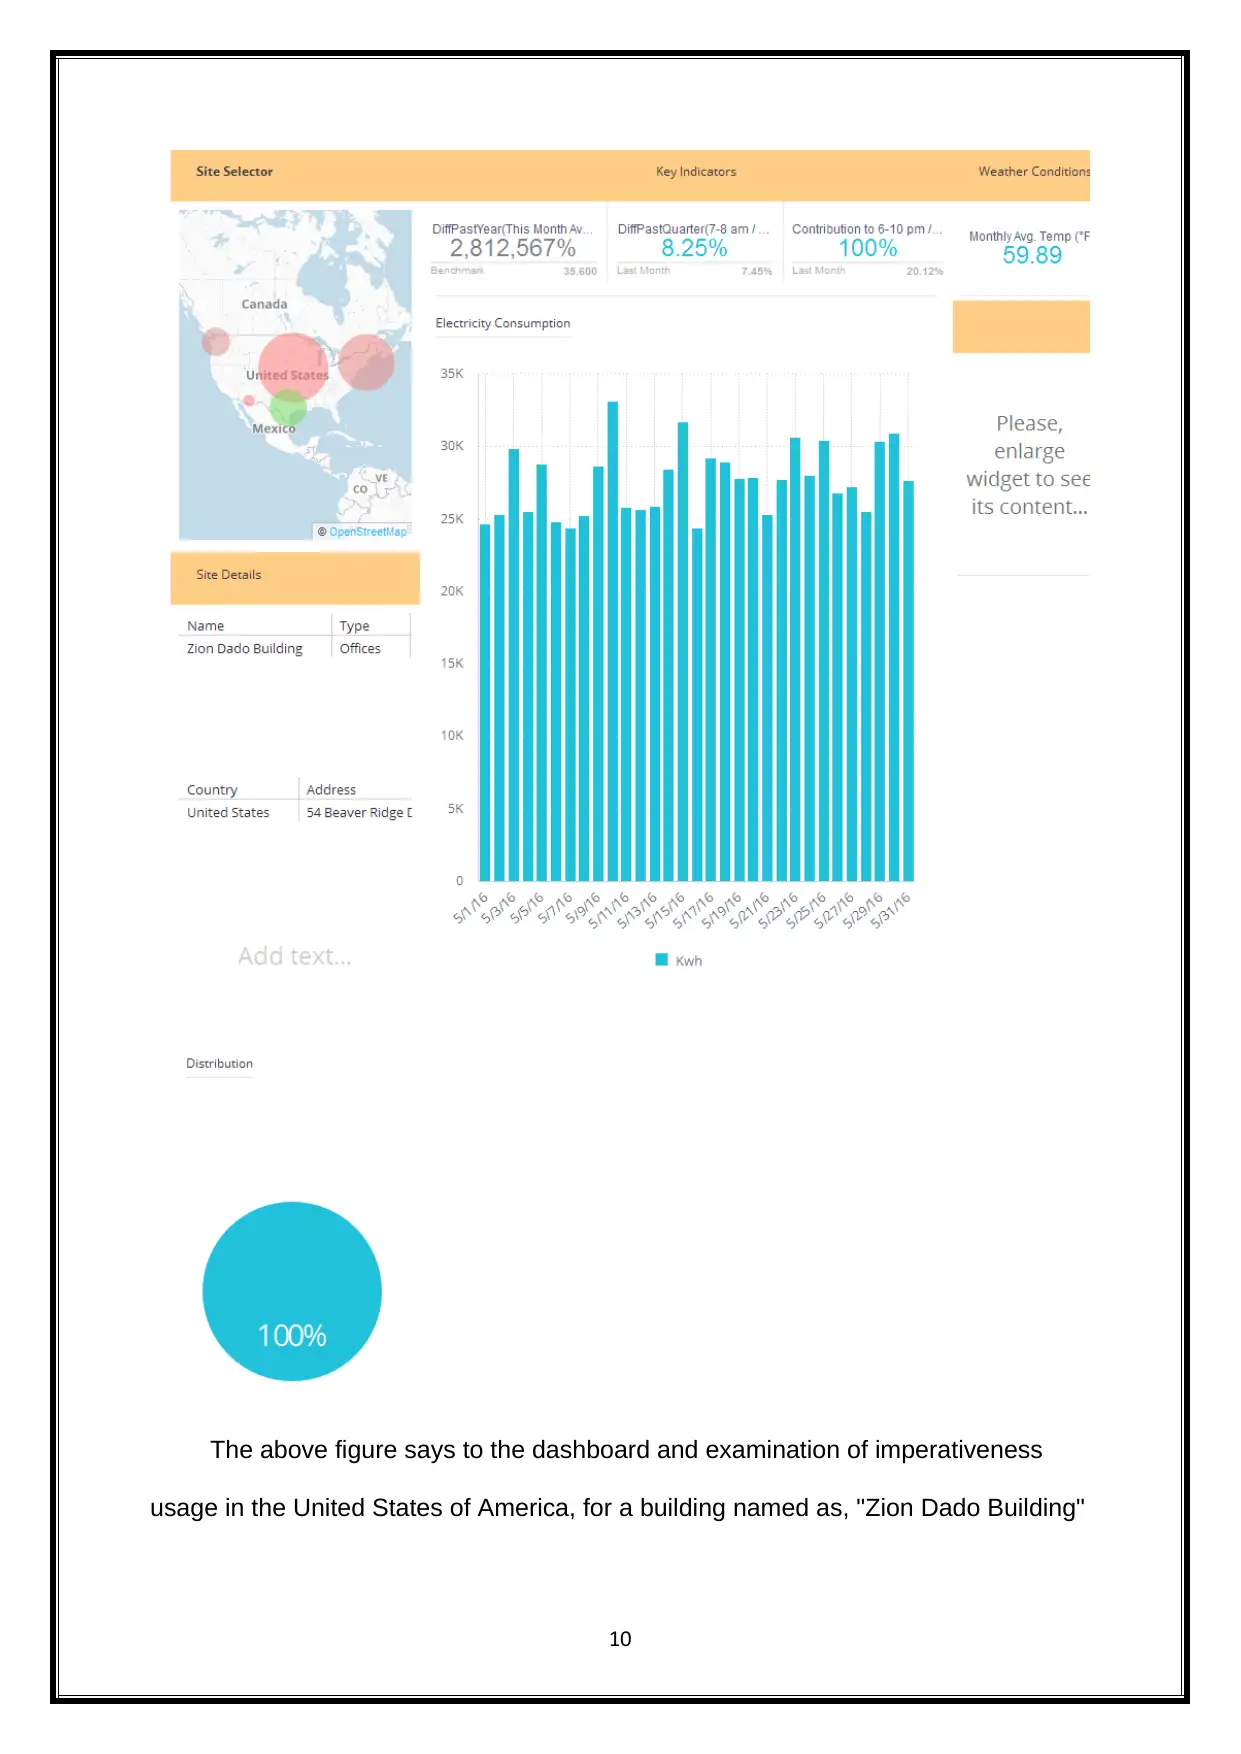
The above figure says to the dashboard and examination of imperativeness
usage in the United States of America, for a building named as, "Zion Dado Building"
10
usage in the United States of America, for a building named as, "Zion Dado Building"
10
The benchmarking in the dashboard is 35.600, anyway it has accomplished 2,
812, 5675. Multi month prior the imperativeness usage was 7.45% in the midst of 7
to 8 am and in the midst of 6 to 10 pm the essentialness use was 20.12% ("Causes
and Effects of Environmental Pollution", 2018). While, the present characteristics for
7 to 8 am shows 8.25% and for 6 to 10 pm it exhibits 100%. The month to month
typical temperature is showed up as 59.89 0F("Getting Started: Introduction to the
Business Intelligence Center", 2018).
1.3 Dash board Prototype
The model of the Design takes after the dashboard. This dashboard is used to
develop the reaction for the normal issues. The dashboard is well known for
addressing the graphical structure with appropriate making gadget. This device is
used for managing the data and moreover for data understanding. The major focus
of using dashboard is to track, show up and separate the general execution of the
specific methodology in any affiliation. It is possible to see the execution on a step by
step, week after week, month to month, quarterly or on yearly preface. The
dashboard contains key execution markers. These pointers are related to the
affiliation's key necessities. The underneath explanation shows to the
dashboard("Ten key elements for effective dashboard design", 2018):
The Dashboard is addressed in the underneath figure.
The bar layout is seemed to take a gander at the data.
The option of filtering the data is accessible, where filtration is done
depending upon date, country, state and city.
11
⊘ This is a preview!⊘
Do you want full access?
Subscribe today to unlock all pages.
Trusted by 1+ million students worldwide
1 out of 20
Related Documents


Your All-in-One AI-Powered Toolkit for Academic Success.
+13062052269
info@desklib.com
Available 24*7 on WhatsApp / Email
![[object Object]](/_next/static/media/star-bottom.7253800d.svg)
Unlock your academic potential
Copyright © 2020–2026 A2Z Services. All Rights Reserved. Developed and managed by ZUCOL.