Tesla's Business Intelligence: Analysis, Decisions, and Software
VerifiedAdded on 2023/05/09
|16
|4784
|135
Report
AI Summary
This report delves into the application of business intelligence (BI) within Tesla Inc., an automotive and energy company. It elucidates various business and support processes, distinguishing between unstructured and semi-structured data, and evaluates the benefits and limitations of BI software like Tableau, comparing it with alternatives such as Microsoft Power BI and QlikView. The report discusses Tesla's decision to launch a Full Self-Driving (FSD) subscription service, examining the support provided by stakeholders at different levels. It further explains BI tools and techniques, proposes an improved interface for Tesla's BI software to aid the CEO's decision-making, and explores legal issues related to the secure exploitation of BI tools. This analysis showcases how BI contributes to effective decision-making within Tesla's innovative business environment.
PROGRAM TITLE: BTEC in Computing
UNIT TITLE:
ASSIGNMENT NUMBER: 1
ASSIGNMENT NAME:
SUBMISSION DATE:
DATE RECEIVED:
TUTORIAL LECTURER:
WORD COUNT:
STUDENT NAME: Bùi Minh Quân
STUDENT ID: BKC12107
MOBILE NUMBER: 0972256665
Summative Feedback:
UNIT TITLE:
ASSIGNMENT NUMBER: 1
ASSIGNMENT NAME:
SUBMISSION DATE:
DATE RECEIVED:
TUTORIAL LECTURER:
WORD COUNT:
STUDENT NAME: Bùi Minh Quân
STUDENT ID: BKC12107
MOBILE NUMBER: 0972256665
Summative Feedback:
Paraphrase This Document
Need a fresh take? Get an instant paraphrase of this document with our AI Paraphraser

Internal verification:
Contents
I. Introduce Company...............................................................................................................................3
II. Explain with examples of Business Process and Support Process in the company..........................3
III. Use examples to distinguish unstructured and semi-structured data.............................................3
IV. Evaluate the benefits and limitations of business intelligence software the company is using or
will use and explain with examples the key features of business intelligence software........................3
V. Compare and contrast the software (mentioned above) with at least TWO other business
intelligence tools/systems/technology/software........................................................................................4
VI. Introduce a recent business decision of the company.......................................................................5
VII. Compare the types of support provided by several key stakeholders at different levels to the decision.
.................................................................................................................................................................... 5
VIII. Business intelligence definition. Explain some of the tools and techniques involved in business
intelligence..................................................................................................................................................5
1. Business intelligence definition..........................................................................................................5
2. Explain some of the tools and techniques involved in business intelligence.....................................5
IX. Briefly explain ONE problem or ONE decision of the new CEO in your chosen company...........6
X. Based on the business intelligence software that your company is using or will use, design an
improved interface for the software so that it can work better to help the new CEO solve the above
problem or exit. decision...........................................................................................................................6
XI. Thoroughly explain how you would customize the design to make it more user-friendly with a
better functional look and feel..................................................................................................................7
XII. Seriously consider the new design for how it helps the CEO solve problems or make decisions.7
XIII. Discuss how business intelligence software can contribute to effective decision making............7
XIV. Explore legal issues related to the secure exploitation of business intelligence tools...................8
⊘ This is a preview!⊘
Do you want full access?
Subscribe today to unlock all pages.
Trusted by 1+ million students worldwide
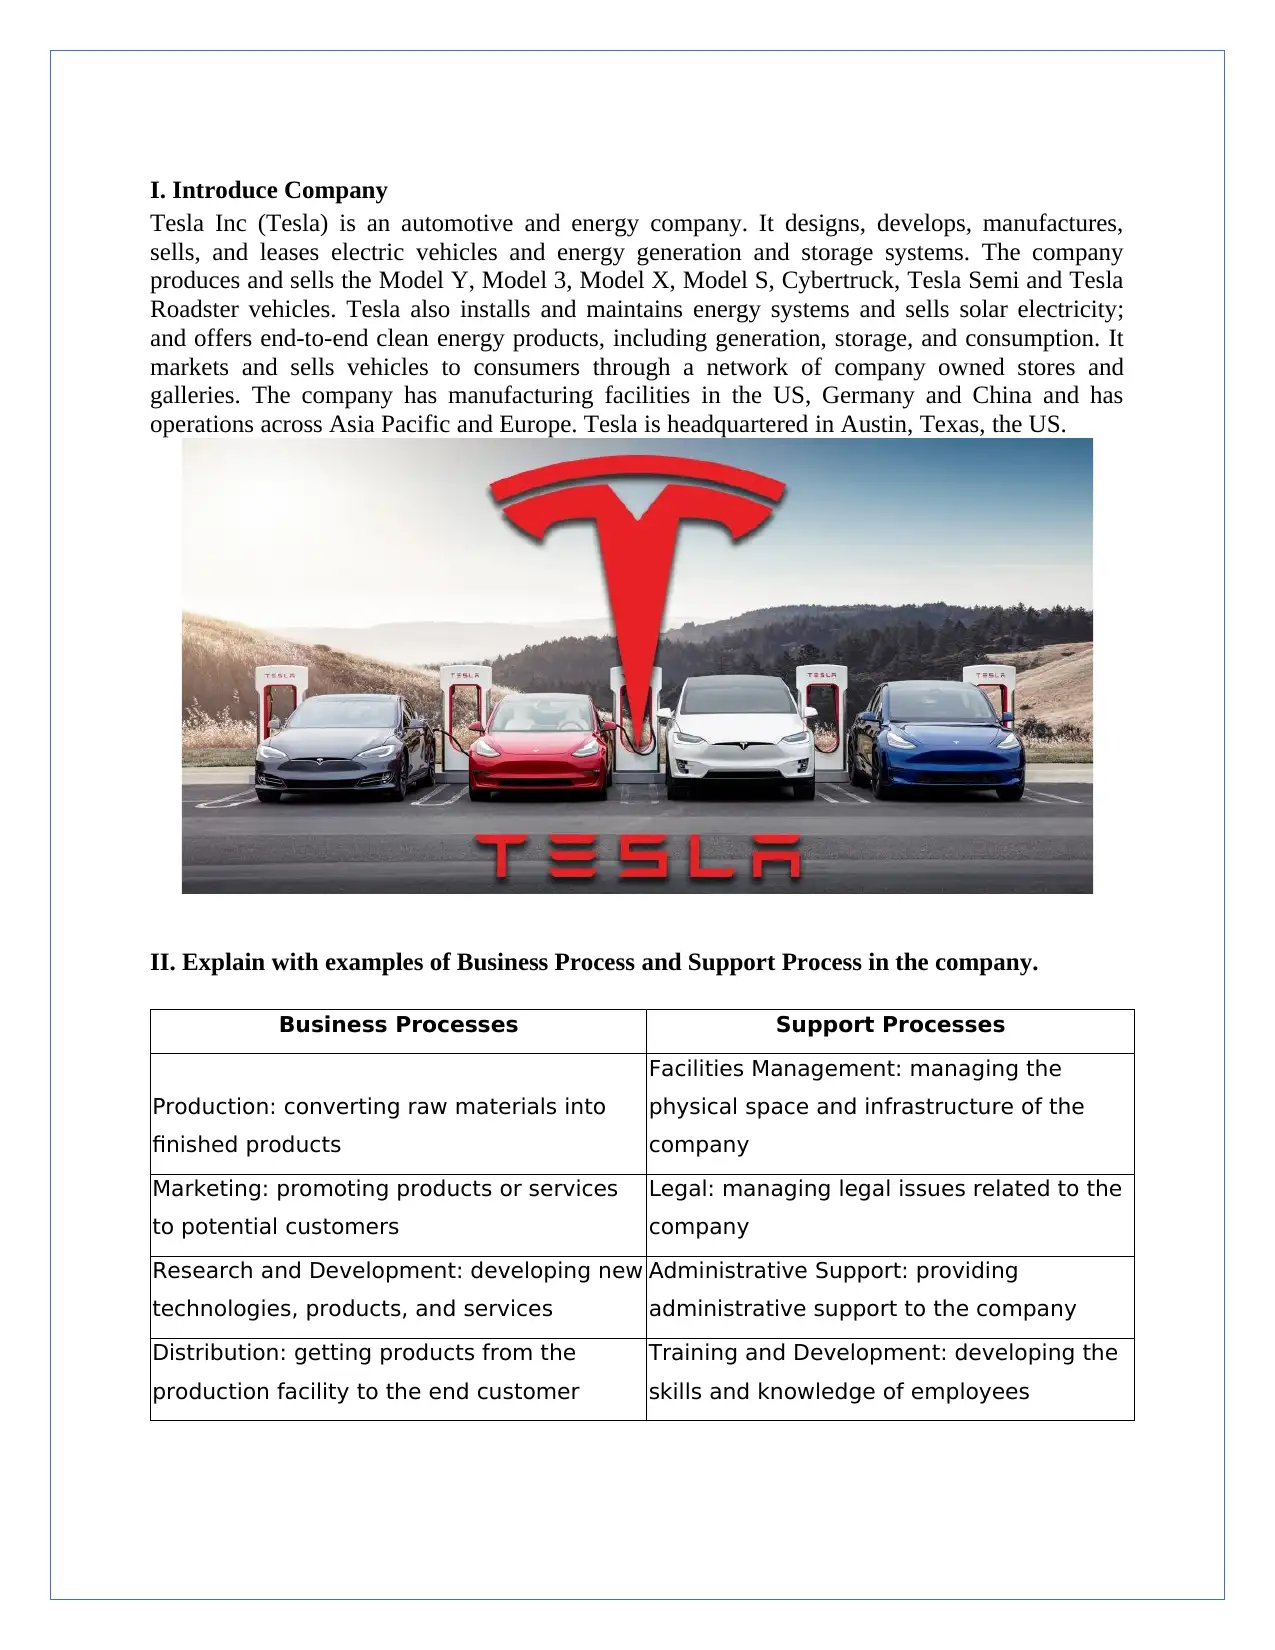
I. Introduce Company
Tesla Inc (Tesla) is an automotive and energy company. It designs, develops, manufactures,
sells, and leases electric vehicles and energy generation and storage systems. The company
produces and sells the Model Y, Model 3, Model X, Model S, Cybertruck, Tesla Semi and Tesla
Roadster vehicles. Tesla also installs and maintains energy systems and sells solar electricity;
and offers end-to-end clean energy products, including generation, storage, and consumption. It
markets and sells vehicles to consumers through a network of company owned stores and
galleries. The company has manufacturing facilities in the US, Germany and China and has
operations across Asia Pacific and Europe. Tesla is headquartered in Austin, Texas, the US.
II. Explain with examples of Business Process and Support Process in the company.
Business Processes Support Processes
Production: converting raw materials into
finished products
Facilities Management: managing the
physical space and infrastructure of the
company
Marketing: promoting products or services
to potential customers
Legal: managing legal issues related to the
company
Research and Development: developing new
technologies, products, and services
Administrative Support: providing
administrative support to the company
Distribution: getting products from the
production facility to the end customer
Training and Development: developing the
skills and knowledge of employees
Paraphrase This Document
Need a fresh take? Get an instant paraphrase of this document with our AI Paraphraser
Business Processes Support Processes
Sales: selling products or services to
customers
Human Resources: recruiting, hiring, and
training employees
Customer Service: providing assistance to
customers before, during, and after a
purchase
Finance and Accounting: managing
financial resources, including accounting,
budgeting, and financial reporting
Supply Chain Management: managing the
flow of goods and services, from the
sourcing of raw materials to the delivery of
finished products
Information Technology: managing the
company's technology infrastructure,
including hardware, software, and networks
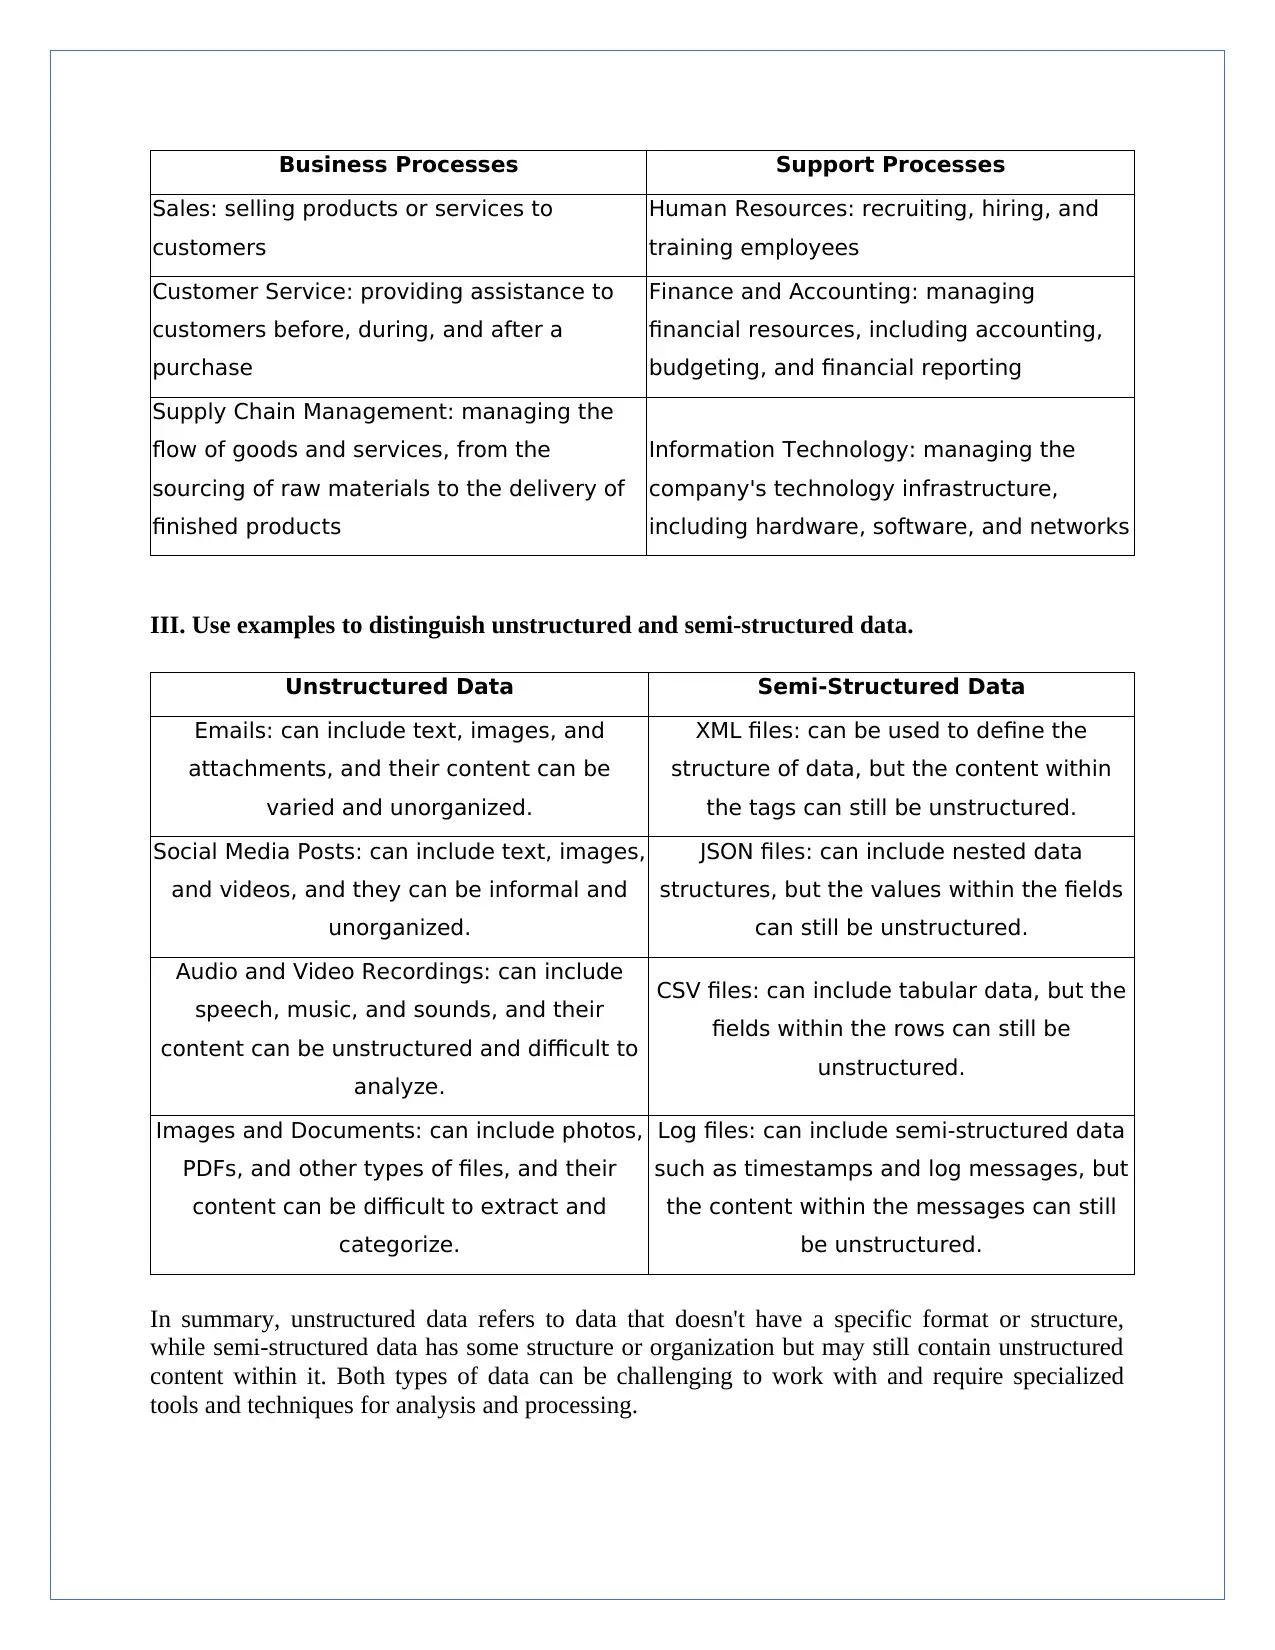
III. Use examples to distinguish unstructured and semi-structured data.
Unstructured Data Semi-Structured Data
Emails: can include text, images, and
attachments, and their content can be
varied and unorganized.
XML files: can be used to define the
structure of data, but the content within
the tags can still be unstructured.
Social Media Posts: can include text, images,
and videos, and they can be informal and
unorganized.
JSON files: can include nested data
structures, but the values within the fields
can still be unstructured.
Audio and Video Recordings: can include
speech, music, and sounds, and their
content can be unstructured and difficult to
analyze.
CSV files: can include tabular data, but the
fields within the rows can still be
unstructured.
Images and Documents: can include photos,
PDFs, and other types of files, and their
content can be difficult to extract and
categorize.
Log files: can include semi-structured data
such as timestamps and log messages, but
the content within the messages can still
be unstructured.
In summary, unstructured data refers to data that doesn't have a specific format or structure,
while semi-structured data has some structure or organization but may still contain unstructured
content within it. Both types of data can be challenging to work with and require specialized
tools and techniques for analysis and processing.
Sales: selling products or services to
customers
Human Resources: recruiting, hiring, and
training employees
Customer Service: providing assistance to
customers before, during, and after a
purchase
Finance and Accounting: managing
financial resources, including accounting,
budgeting, and financial reporting
Supply Chain Management: managing the
flow of goods and services, from the
sourcing of raw materials to the delivery of
finished products
Information Technology: managing the
company's technology infrastructure,
including hardware, software, and networks
III. Use examples to distinguish unstructured and semi-structured data.
Unstructured Data Semi-Structured Data
Emails: can include text, images, and
attachments, and their content can be
varied and unorganized.
XML files: can be used to define the
structure of data, but the content within
the tags can still be unstructured.
Social Media Posts: can include text, images,
and videos, and they can be informal and
unorganized.
JSON files: can include nested data
structures, but the values within the fields
can still be unstructured.
Audio and Video Recordings: can include
speech, music, and sounds, and their
content can be unstructured and difficult to
analyze.
CSV files: can include tabular data, but the
fields within the rows can still be
unstructured.
Images and Documents: can include photos,
PDFs, and other types of files, and their
content can be difficult to extract and
categorize.
Log files: can include semi-structured data
such as timestamps and log messages, but
the content within the messages can still
be unstructured.
In summary, unstructured data refers to data that doesn't have a specific format or structure,
while semi-structured data has some structure or organization but may still contain unstructured
content within it. Both types of data can be challenging to work with and require specialized
tools and techniques for analysis and processing.
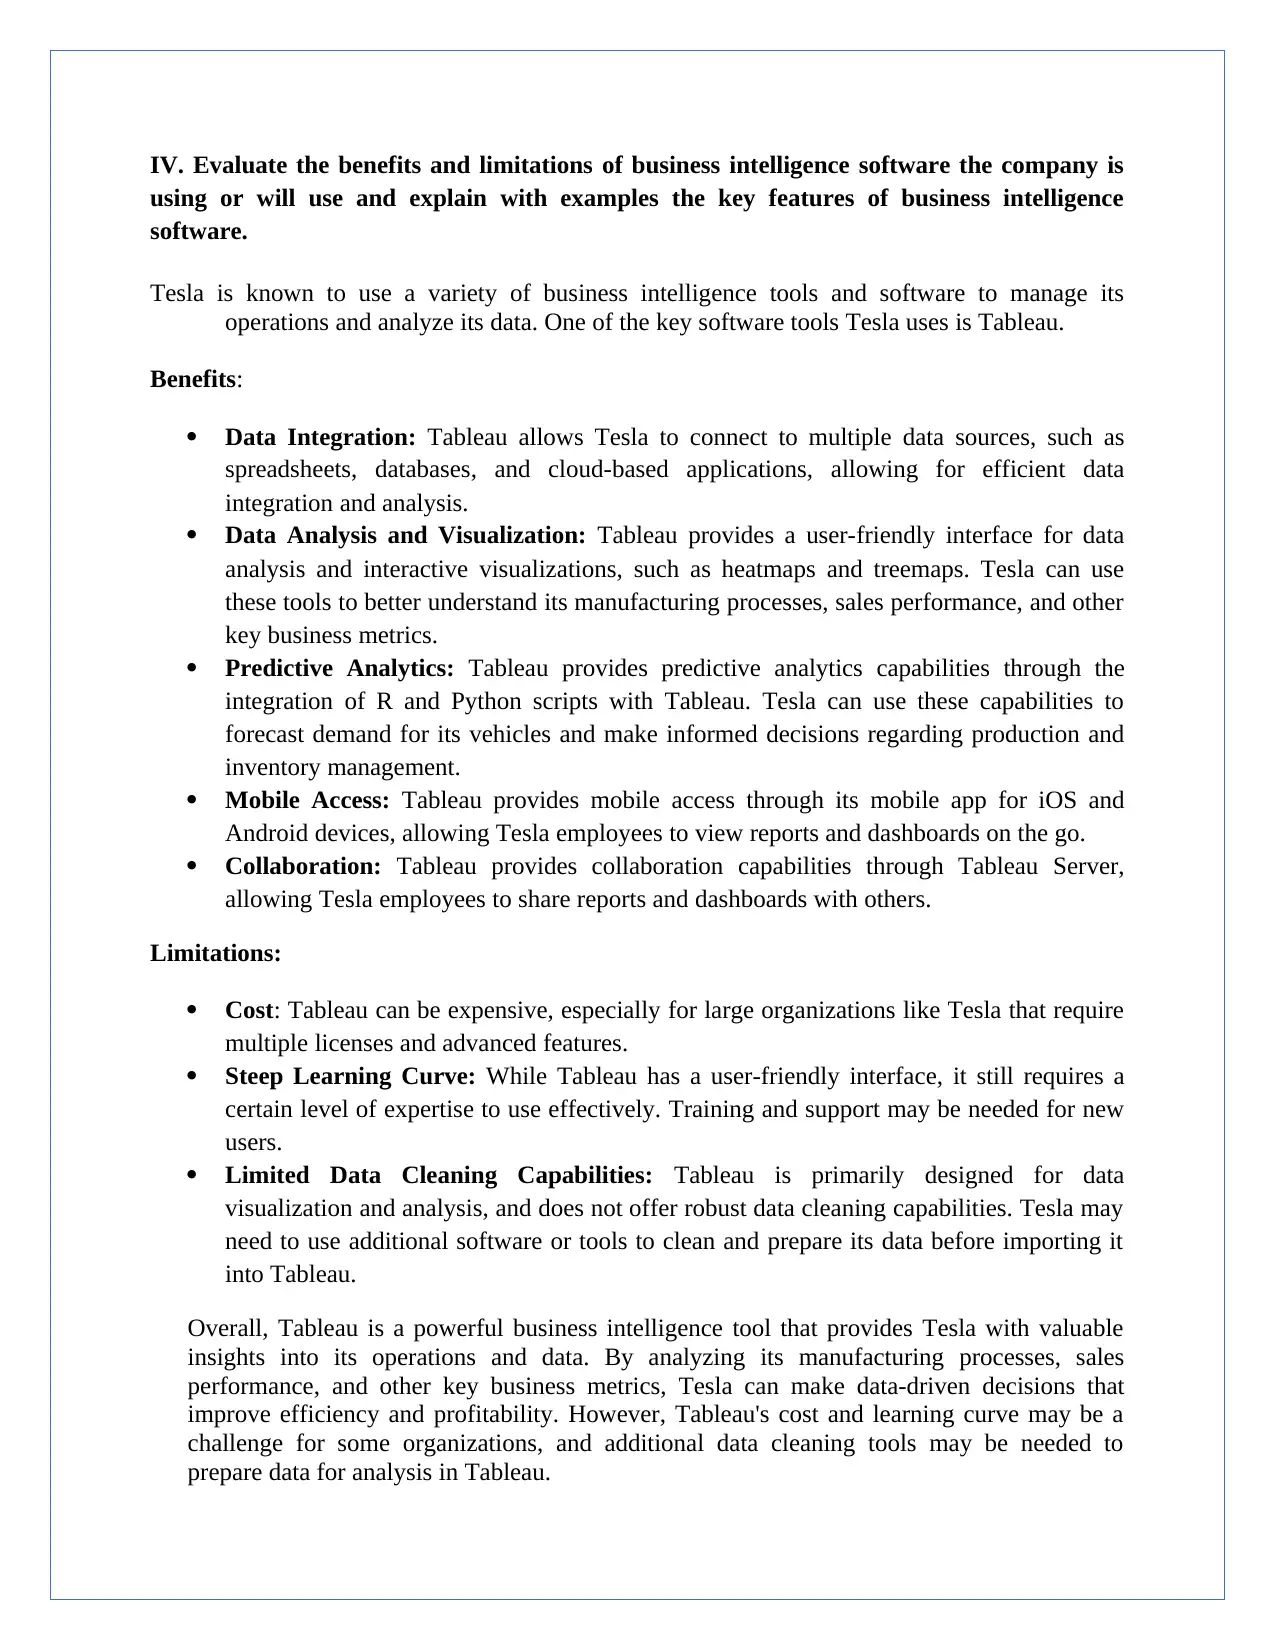
IV. Evaluate the benefits and limitations of business intelligence software the company is
using or will use and explain with examples the key features of business intelligence
software.
Tesla is known to use a variety of business intelligence tools and software to manage its
operations and analyze its data. One of the key software tools Tesla uses is Tableau.
Benefits:
Data Integration: Tableau allows Tesla to connect to multiple data sources, such as
spreadsheets, databases, and cloud-based applications, allowing for efficient data
integration and analysis.
Data Analysis and Visualization: Tableau provides a user-friendly interface for data
analysis and interactive visualizations, such as heatmaps and treemaps. Tesla can use
these tools to better understand its manufacturing processes, sales performance, and other
key business metrics.
Predictive Analytics: Tableau provides predictive analytics capabilities through the
integration of R and Python scripts with Tableau. Tesla can use these capabilities to
forecast demand for its vehicles and make informed decisions regarding production and
inventory management.
Mobile Access: Tableau provides mobile access through its mobile app for iOS and
Android devices, allowing Tesla employees to view reports and dashboards on the go.
Collaboration: Tableau provides collaboration capabilities through Tableau Server,
allowing Tesla employees to share reports and dashboards with others.
Limitations:
Cost: Tableau can be expensive, especially for large organizations like Tesla that require
multiple licenses and advanced features.
Steep Learning Curve: While Tableau has a user-friendly interface, it still requires a
certain level of expertise to use effectively. Training and support may be needed for new
users.
Limited Data Cleaning Capabilities: Tableau is primarily designed for data
visualization and analysis, and does not offer robust data cleaning capabilities. Tesla may
need to use additional software or tools to clean and prepare its data before importing it
into Tableau.
Overall, Tableau is a powerful business intelligence tool that provides Tesla with valuable
insights into its operations and data. By analyzing its manufacturing processes, sales
performance, and other key business metrics, Tesla can make data-driven decisions that
improve efficiency and profitability. However, Tableau's cost and learning curve may be a
challenge for some organizations, and additional data cleaning tools may be needed to
prepare data for analysis in Tableau.
⊘ This is a preview!⊘
Do you want full access?
Subscribe today to unlock all pages.
Trusted by 1+ million students worldwide
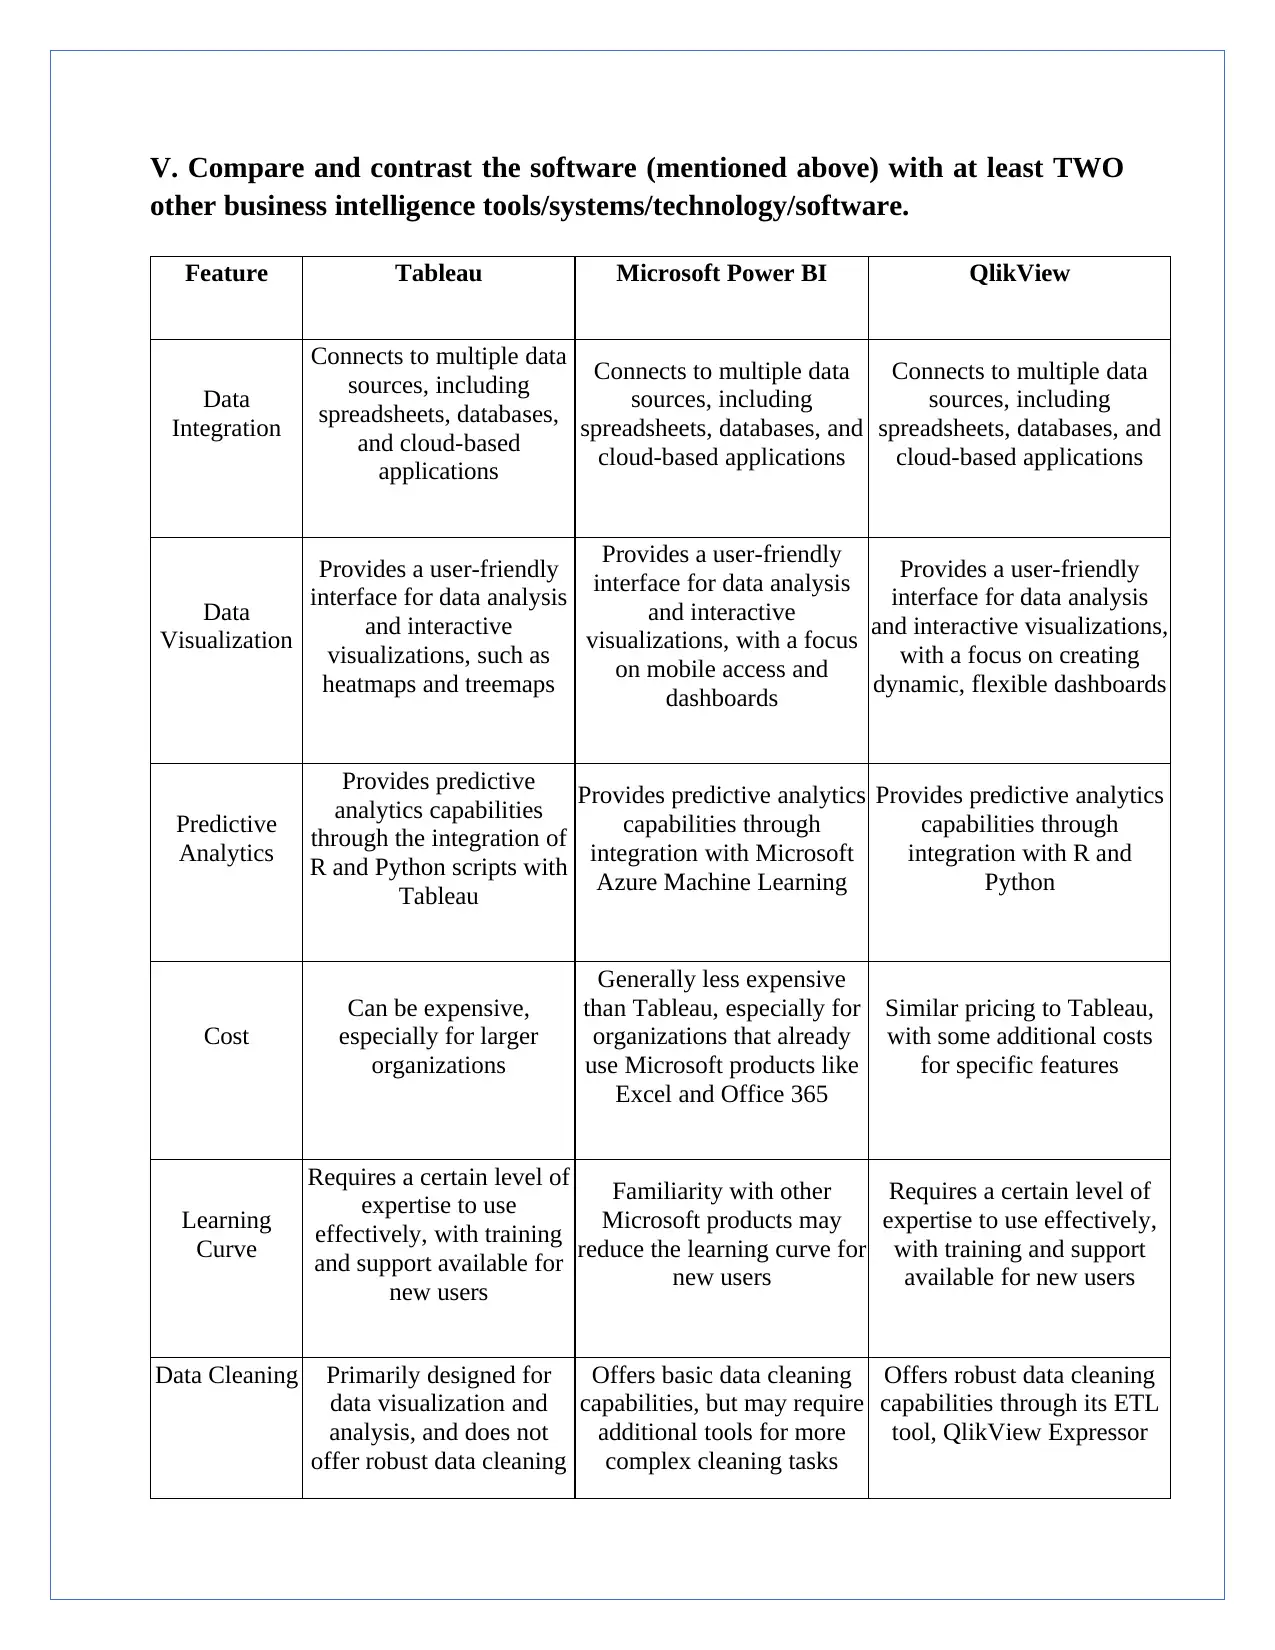
V. Compare and contrast the software (mentioned above) with at least TWO
other business intelligence tools/systems/technology/software.
Feature Tableau Microsoft Power BI QlikView
Data
Integration
Connects to multiple data
sources, including
spreadsheets, databases,
and cloud-based
applications
Connects to multiple data
sources, including
spreadsheets, databases, and
cloud-based applications
Connects to multiple data
sources, including
spreadsheets, databases, and
cloud-based applications
Data
Visualization
Provides a user-friendly
interface for data analysis
and interactive
visualizations, such as
heatmaps and treemaps
Provides a user-friendly
interface for data analysis
and interactive
visualizations, with a focus
on mobile access and
dashboards
Provides a user-friendly
interface for data analysis
and interactive visualizations,
with a focus on creating
dynamic, flexible dashboards
Predictive
Analytics
Provides predictive
analytics capabilities
through the integration of
R and Python scripts with
Tableau
Provides predictive analytics
capabilities through
integration with Microsoft
Azure Machine Learning
Provides predictive analytics
capabilities through
integration with R and
Python
Cost
Can be expensive,
especially for larger
organizations
Generally less expensive
than Tableau, especially for
organizations that already
use Microsoft products like
Excel and Office 365
Similar pricing to Tableau,
with some additional costs
for specific features
Learning
Curve
Requires a certain level of
expertise to use
effectively, with training
and support available for
new users
Familiarity with other
Microsoft products may
reduce the learning curve for
new users
Requires a certain level of
expertise to use effectively,
with training and support
available for new users
Data Cleaning Primarily designed for
data visualization and
analysis, and does not
offer robust data cleaning
Offers basic data cleaning
capabilities, but may require
additional tools for more
complex cleaning tasks
Offers robust data cleaning
capabilities through its ETL
tool, QlikView Expressor
Paraphrase This Document
Need a fresh take? Get an instant paraphrase of this document with our AI Paraphraser
Feature Tableau Microsoft Power BI QlikView
capabilities
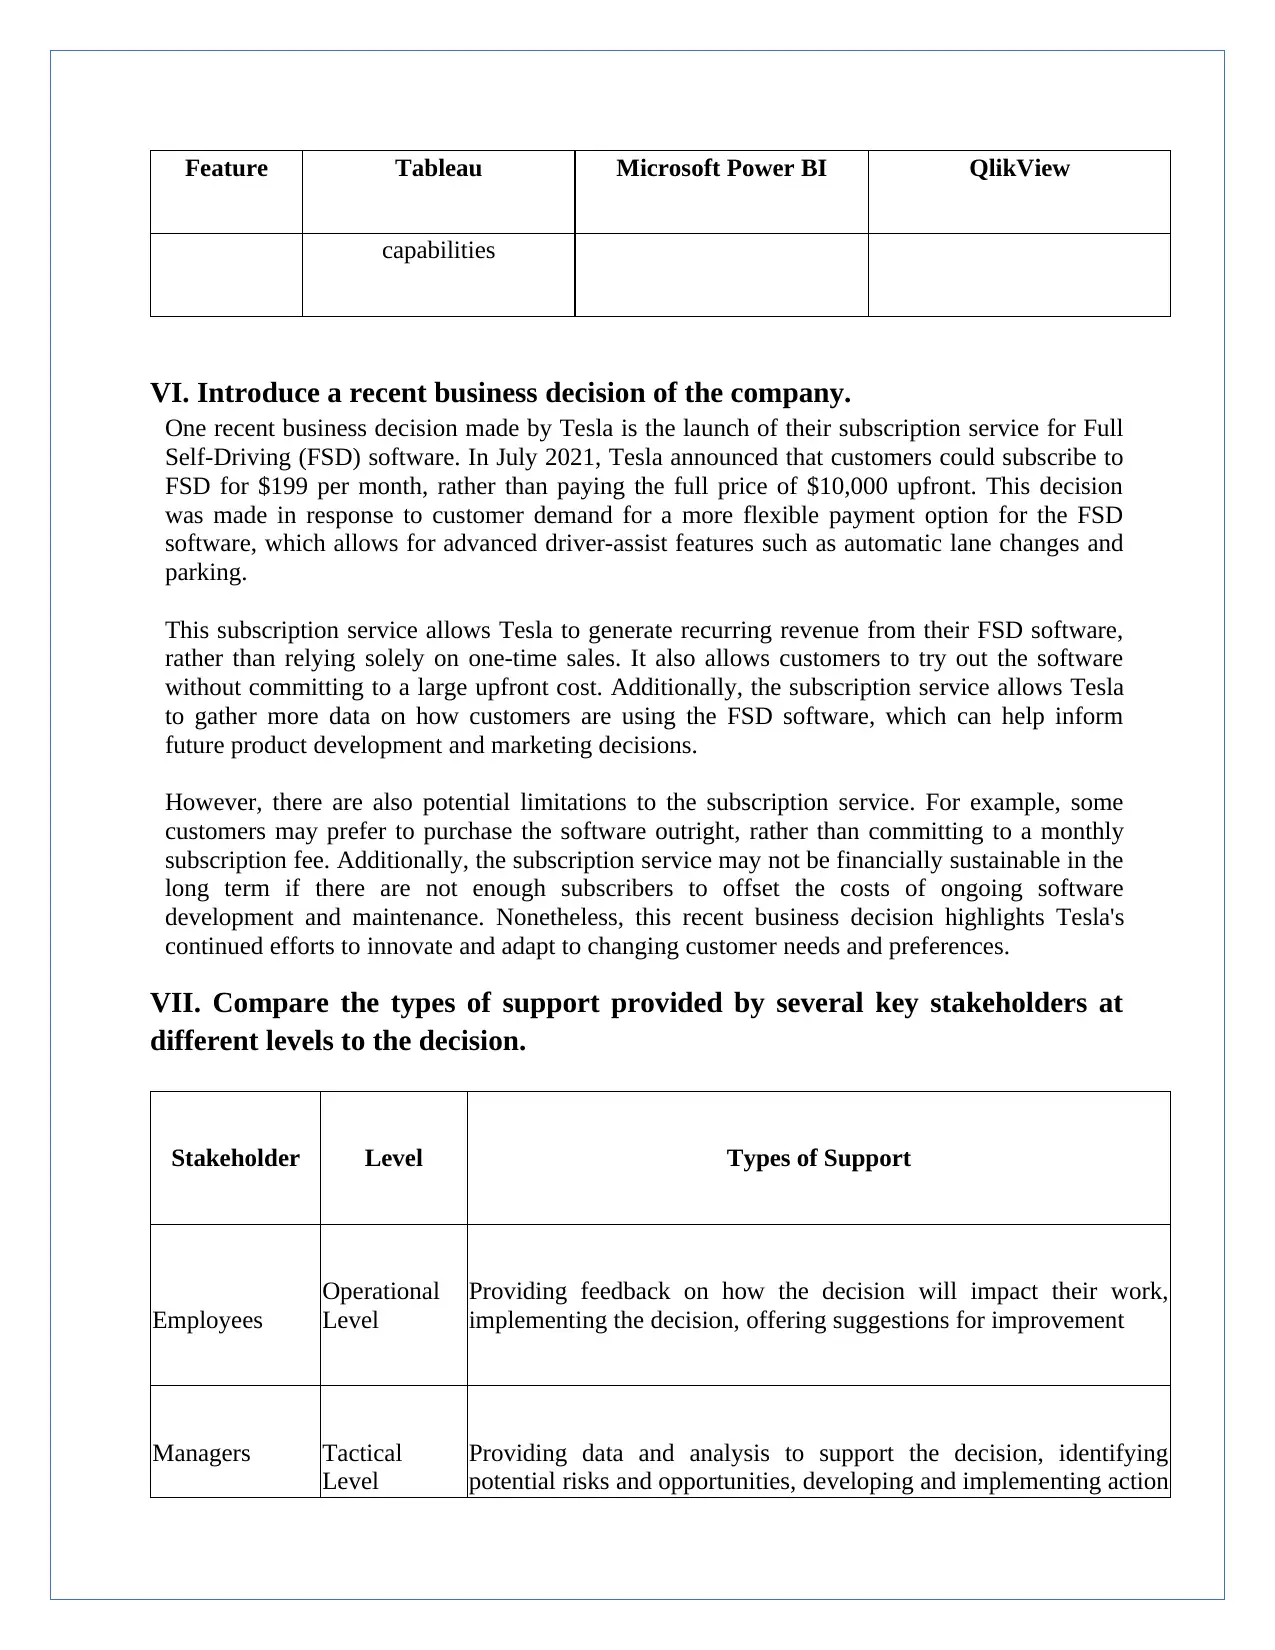
VI. Introduce a recent business decision of the company.
One recent business decision made by Tesla is the launch of their subscription service for Full
Self-Driving (FSD) software. In July 2021, Tesla announced that customers could subscribe to
FSD for $199 per month, rather than paying the full price of $10,000 upfront. This decision
was made in response to customer demand for a more flexible payment option for the FSD
software, which allows for advanced driver-assist features such as automatic lane changes and
parking.
This subscription service allows Tesla to generate recurring revenue from their FSD software,
rather than relying solely on one-time sales. It also allows customers to try out the software
without committing to a large upfront cost. Additionally, the subscription service allows Tesla
to gather more data on how customers are using the FSD software, which can help inform
future product development and marketing decisions.
However, there are also potential limitations to the subscription service. For example, some
customers may prefer to purchase the software outright, rather than committing to a monthly
subscription fee. Additionally, the subscription service may not be financially sustainable in the
long term if there are not enough subscribers to offset the costs of ongoing software
development and maintenance. Nonetheless, this recent business decision highlights Tesla's
continued efforts to innovate and adapt to changing customer needs and preferences.
VII. Compare the types of support provided by several key stakeholders at
different levels to the decision.
Stakeholder Level Types of Support
Employees
Operational
Level
Providing feedback on how the decision will impact their work,
implementing the decision, offering suggestions for improvement
Managers Tactical
Level
Providing data and analysis to support the decision, identifying
potential risks and opportunities, developing and implementing action
capabilities
VI. Introduce a recent business decision of the company.
One recent business decision made by Tesla is the launch of their subscription service for Full
Self-Driving (FSD) software. In July 2021, Tesla announced that customers could subscribe to
FSD for $199 per month, rather than paying the full price of $10,000 upfront. This decision
was made in response to customer demand for a more flexible payment option for the FSD
software, which allows for advanced driver-assist features such as automatic lane changes and
parking.
This subscription service allows Tesla to generate recurring revenue from their FSD software,
rather than relying solely on one-time sales. It also allows customers to try out the software
without committing to a large upfront cost. Additionally, the subscription service allows Tesla
to gather more data on how customers are using the FSD software, which can help inform
future product development and marketing decisions.
However, there are also potential limitations to the subscription service. For example, some
customers may prefer to purchase the software outright, rather than committing to a monthly
subscription fee. Additionally, the subscription service may not be financially sustainable in the
long term if there are not enough subscribers to offset the costs of ongoing software
development and maintenance. Nonetheless, this recent business decision highlights Tesla's
continued efforts to innovate and adapt to changing customer needs and preferences.
VII. Compare the types of support provided by several key stakeholders at
different levels to the decision.
Stakeholder Level Types of Support
Employees
Operational
Level
Providing feedback on how the decision will impact their work,
implementing the decision, offering suggestions for improvement
Managers Tactical
Level
Providing data and analysis to support the decision, identifying
potential risks and opportunities, developing and implementing action
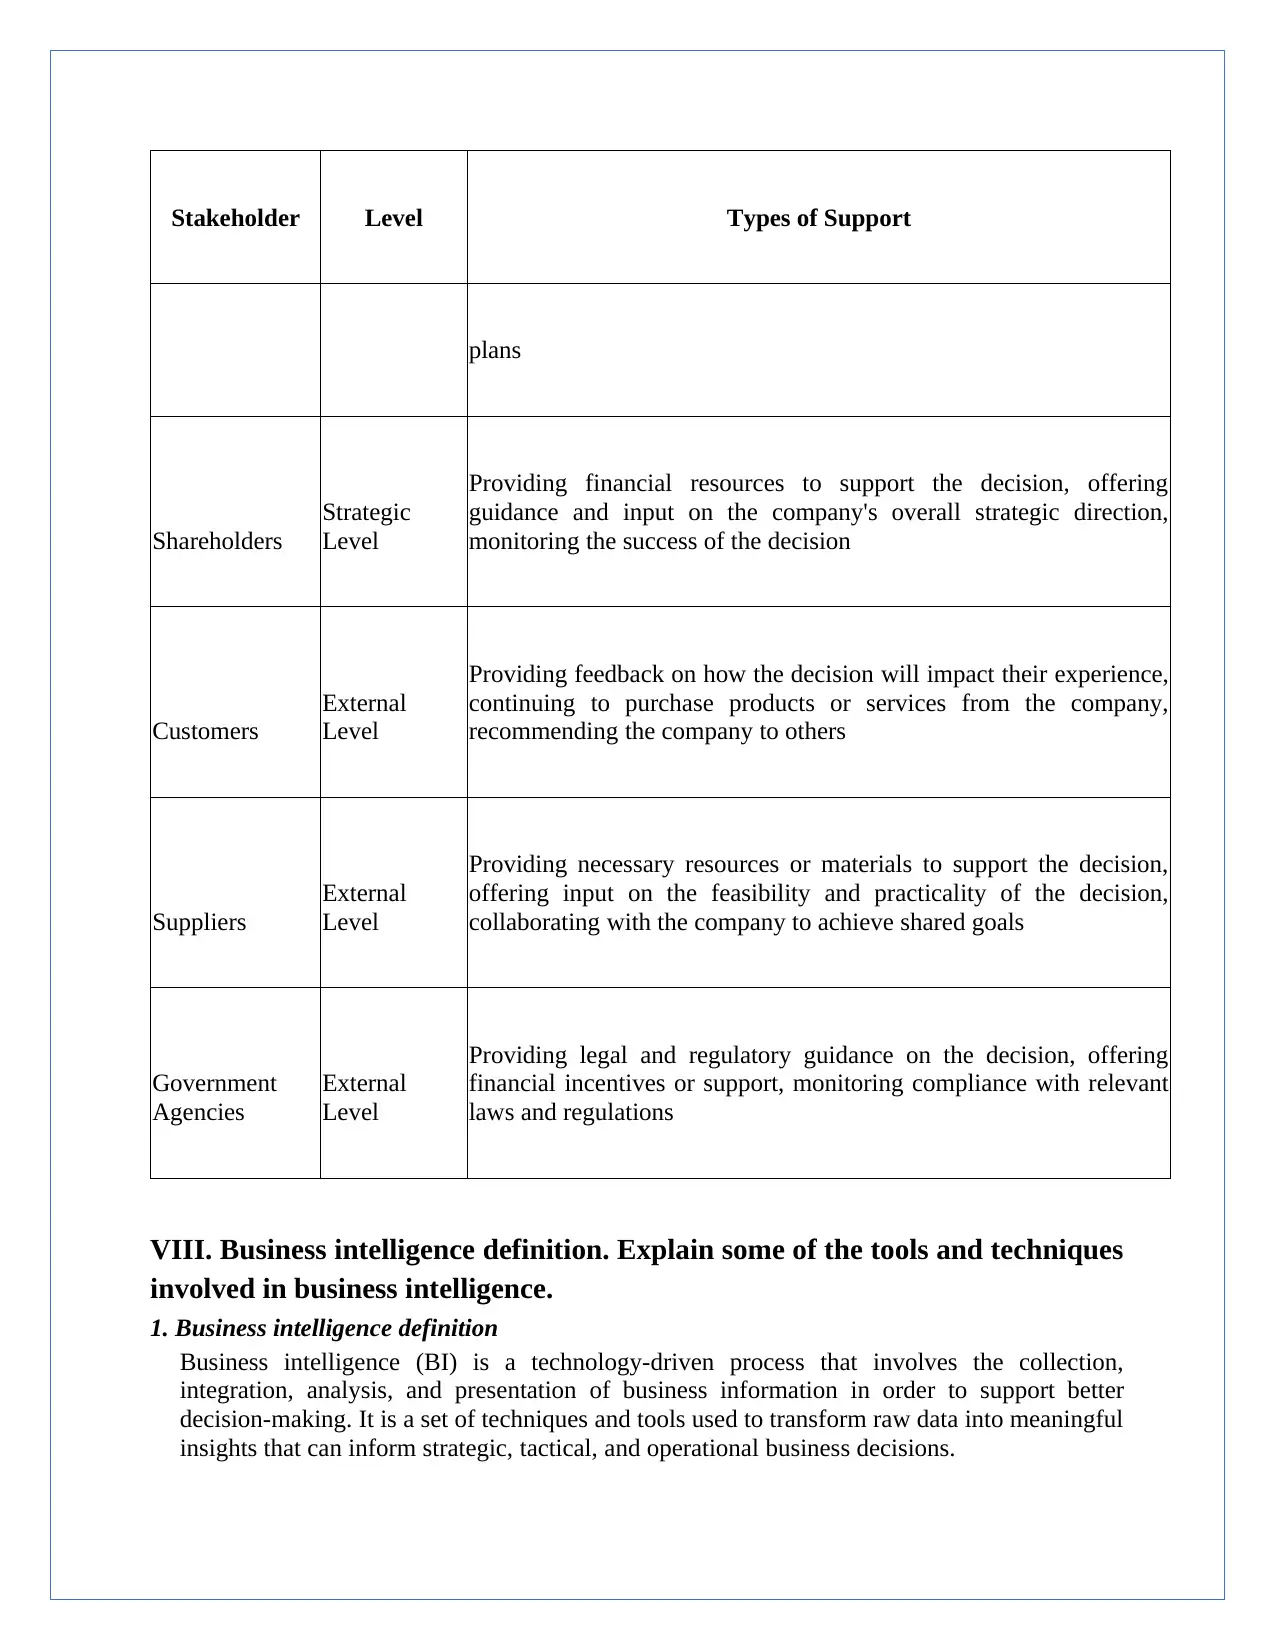
Stakeholder Level Types of Support
plans
Shareholders
Strategic
Level
Providing financial resources to support the decision, offering
guidance and input on the company's overall strategic direction,
monitoring the success of the decision
Customers
External
Level
Providing feedback on how the decision will impact their experience,
continuing to purchase products or services from the company,
recommending the company to others
Suppliers
External
Level
Providing necessary resources or materials to support the decision,
offering input on the feasibility and practicality of the decision,
collaborating with the company to achieve shared goals
Government
Agencies
External
Level
Providing legal and regulatory guidance on the decision, offering
financial incentives or support, monitoring compliance with relevant
laws and regulations
VIII. Business intelligence definition. Explain some of the tools and techniques
involved in business intelligence.
1. Business intelligence definition
Business intelligence (BI) is a technology-driven process that involves the collection,
integration, analysis, and presentation of business information in order to support better
decision-making. It is a set of techniques and tools used to transform raw data into meaningful
insights that can inform strategic, tactical, and operational business decisions.
⊘ This is a preview!⊘
Do you want full access?
Subscribe today to unlock all pages.
Trusted by 1+ million students worldwide
Business intelligence includes a variety of data analysis methods, such as data mining,
predictive analytics, and statistical analysis. These methods help organizations to identify
patterns, trends, and opportunities in their data, and to gain a deeper understanding of their
customers, products, and markets. The results of these analyses are typically presented in the
form of reports, dashboards, and other visualizations that are easy to interpret and use.
Overall, the goal of business intelligence is to help organizations make data-driven decisions
that improve their performance and competitiveness. It can be used in a wide range of
industries, including finance, healthcare, retail, and manufacturing, among others.
2. Explain some of the tools and techniques involved in business intelligence.
Some of the common tools and techniques involved in business intelligence:
Data Warehousing: A data warehouse is a large, centralized repository of data that is
specifically designed to support business intelligence. It typically stores historical data
from a variety of sources in a standardized format, making it easier to analyze and extract
insights.
Data Mining: Data mining is a technique used to analyze large amounts of data in order
to discover hidden patterns, trends, and insights. It involves applying statistical and
mathematical algorithms to data sets to identify relationships and correlations that might
not be immediately apparent.
Dashboarding and Reporting: Dashboards and reports are visual representations of data
that help users to quickly and easily understand key performance indicators (KPIs) and
other metrics. They often include charts, graphs, and other visualizations that allow users
to quickly identify trends and patterns.
Data Visualization: Data visualization is the practice of representing data in a visual
format, such as charts, graphs, or maps. It is a powerful technique for communicating
complex data in a way that is easy to understand.
Predictive Analytics: Predictive analytics involves using statistical and machine learning
algorithms to analyze historical data and make predictions about future outcomes. It is
used in a wide range of applications, such as forecasting sales, predicting customer
behavior, and identifying fraud.
Data Integration: Data integration involves combining data from multiple sources and
transforming it into a standardized format that can be used for analysis. This can involve
processes such as data cleaning, data transformation, and data enrichment.
Overall, these tools and techniques are used to help organizations collect, integrate, analyze, and
present data in a way that supports better decision-making.
Paraphrase This Document
Need a fresh take? Get an instant paraphrase of this document with our AI Paraphraser
IX. Briefly explain ONE problem or ONE decision of the new CEO in your
chosen company.
One problem that the new CEO of Tesla, Inc. (Elon Musk) faced was related to production and
delivery delays of the company's Model 3 electric vehicle. In 2018, the company faced
significant challenges in meeting its production targets for the Model 3, which is intended to be a
more affordable electric car that could be produced at scale.
The company had initially set ambitious targets to produce 5,000 Model 3s per week by the end
of 2017, but faced numerous production bottlenecks and delays that made it difficult to meet this
goal. As a result, the company had to revise its production targets several times, which resulted
in significant delays in delivering the vehicles to customers.
To address this problem, the new CEO had to make a number of strategic decisions related to
production processes, supply chain management, and quality control. He implemented new
production processes and technologies, such as the use of more automated production lines and
advanced robotics, in order to increase efficiency and reduce production bottlenecks. He also
worked to improve the company's supply chain management, by increasing its partnerships with
suppliers and expanding its production capacity.
Ultimately, these efforts helped the company to increase its production and delivery of the Model
3, although there were still some ongoing challenges in meeting demand and ensuring quality
control. Nevertheless, this problem highlighted the importance of effective production and
supply chain management in the electric vehicle industry, and the role that strategic decision-
making can play in addressing these challenges.
X. Based on the business intelligence software that your company is using or
will use, design an improved interface for the software so that it can work
better to help the new CEO solve the above problem or exit. decision.
I can provide some general recommendations for improving the interface of a business
intelligence software to help address the problem that the new CEO of Tesla faced in relation to
production and delivery delays of the Model 3 electric vehicle.
Here are some key features that an improved interface for the software could include:
Real-time production tracking: An improved interface could include a real-time
dashboard that displays production data, such as the number of vehicles being produced
per day, production bottlenecks, and other key metrics. This would allow the CEO and
other stakeholders to quickly identify any issues that are slowing down production, and
take corrective action as needed.
Supply chain visibility: The software could also include a supply chain management
module that provides visibility into the company's supply chain, including supplier
performance, inventory levels, and delivery times. This would allow the CEO to better
manage the company's suppliers and ensure that the necessary parts and components are
available to keep production running smoothly.
Predictive analytics: The software could leverage predictive analytics to forecast future
demand for the Model 3, as well as identify potential production bottlenecks or quality
control issues before they occur. This would allow the CEO to proactively address these
issues and ensure that the company is able to meet its production targets.
Mobile access: An improved interface could also include a mobile app that allows the
CEO and other stakeholders to access production and supply chain data on the go. This
would enable them to stay informed about production progress and take action if needed,
even when they are not in the office.
Overall, an improved interface for a business intelligence software could provide the new CEO
of Tesla with the real-time data and insights needed to make strategic decisions and address
production and delivery delays for the Model 3 electric vehicle.
XI. Thoroughly explain how you would customize the design to make it more
user-friendly with a better functional look and feel.
To make the design of a business intelligence software interface for Tesla more user-friendly
with a better functional look and feel, the following steps can be taken:
Use a clean and modern design: The design of the interface should be clean and
modern, using a minimalistic approach with clear and concise text, easy to read fonts, and
a consistent color scheme. This will create a more professional look and feel and improve
the user experience.
Improve the navigation: The navigation of the interface should be intuitive and easy to
use. This can be achieved by using clear labels and categories, breadcrumb trails, and a
search function. It's also important to make sure that the most important features are
easily accessible from the main dashboard.
Customize the dashboard: The dashboard should be customizable, allowing users to
select the data and metrics that are most relevant to them. This can be achieved by using
widgets or drag-and-drop functionality to allow users to create their own customized
dashboards.
Incorporate visualizations: To make the data more accessible and easier to understand,
visualizations such as charts, graphs, and heat maps should be used. This will help users
quickly identify trends and patterns and make more informed decisions.
Provide clear and concise feedback: The interface should provide clear and concise
feedback to users when they take actions or interact with the software. For example,
when a report is generated or a query is executed, a message should be displayed to
confirm that the action has been completed successfully.
⊘ This is a preview!⊘
Do you want full access?
Subscribe today to unlock all pages.
Trusted by 1+ million students worldwide
1 out of 16
Related Documents


Your All-in-One AI-Powered Toolkit for Academic Success.
+13062052269
info@desklib.com
Available 24*7 on WhatsApp / Email
![[object Object]](/_next/static/media/star-bottom.7253800d.svg)
Unlock your academic potential
Copyright © 2020–2026 A2Z Services. All Rights Reserved. Developed and managed by ZUCOL.