Business Intelligence Tools, Techniques, and Implementation: A Report
VerifiedAdded on  2023/04/17
|11
|843
|406
Report
AI Summary
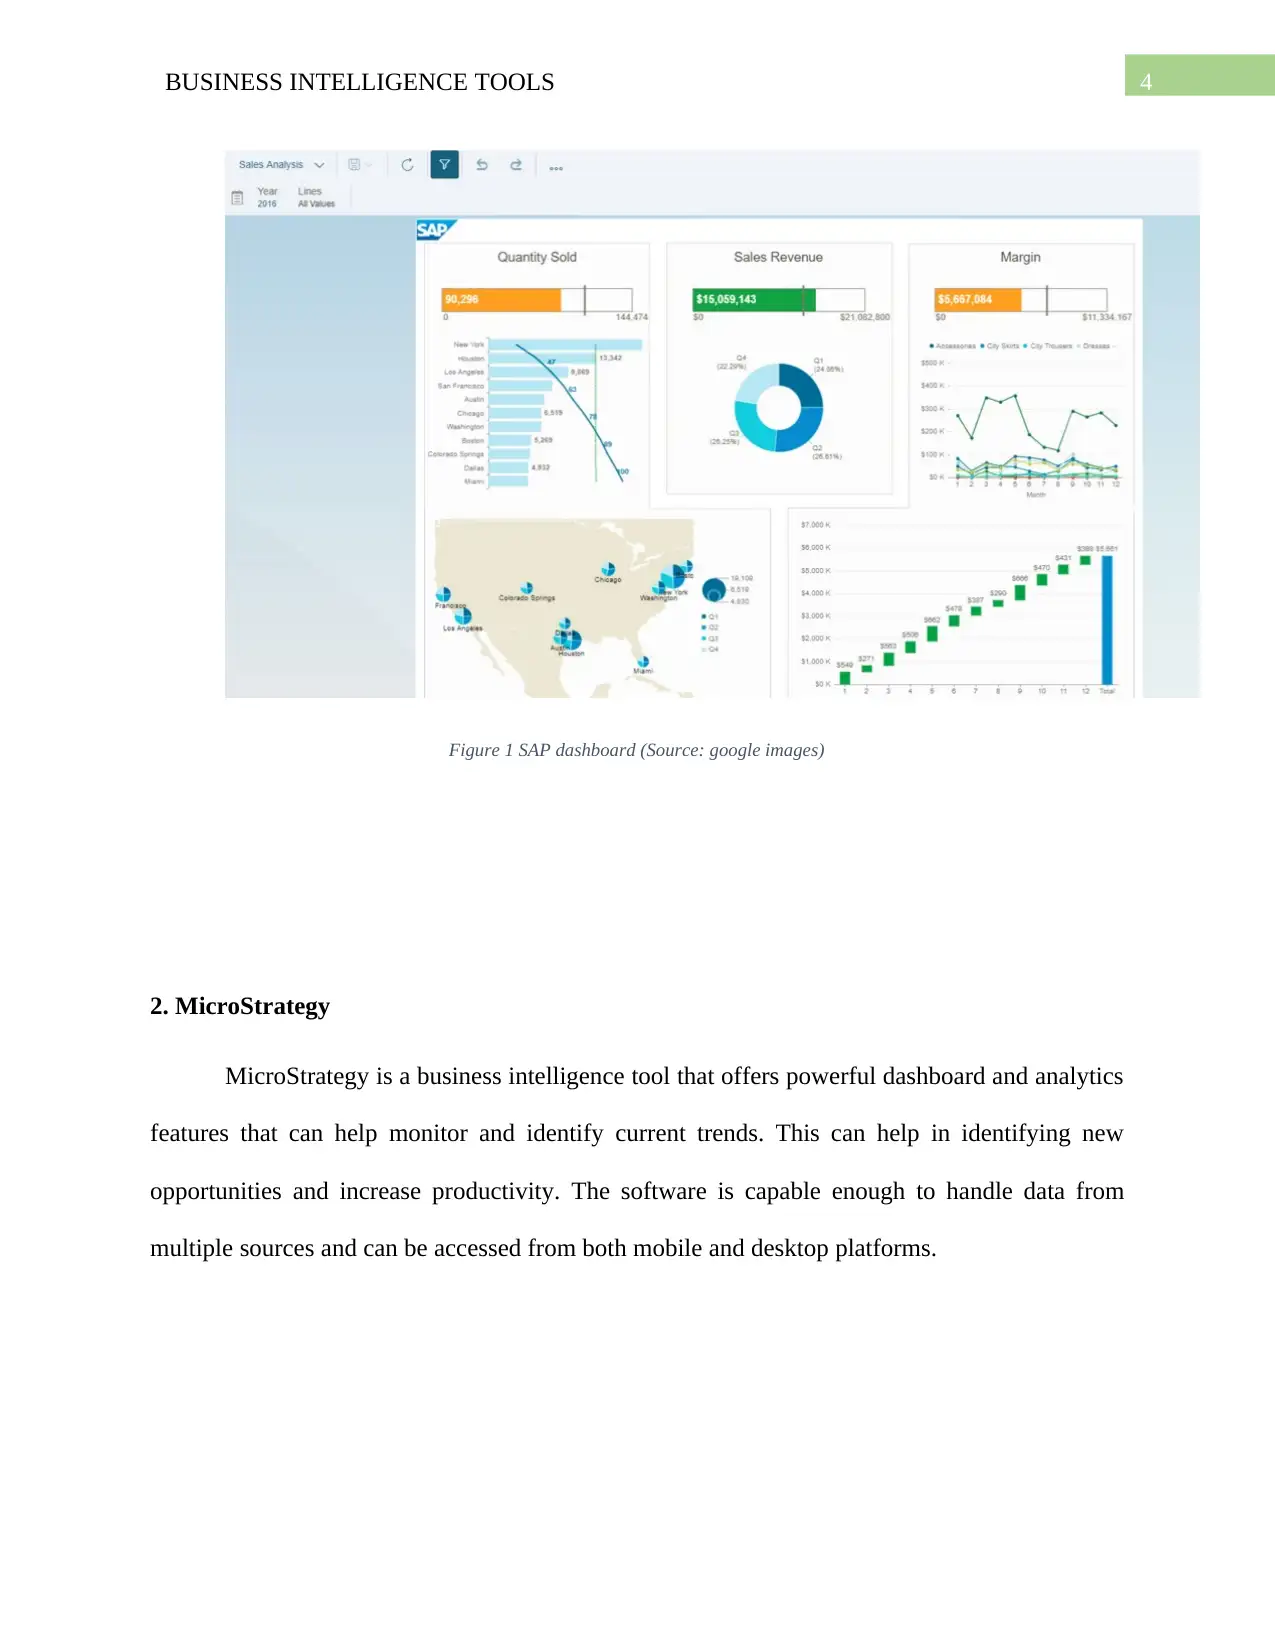
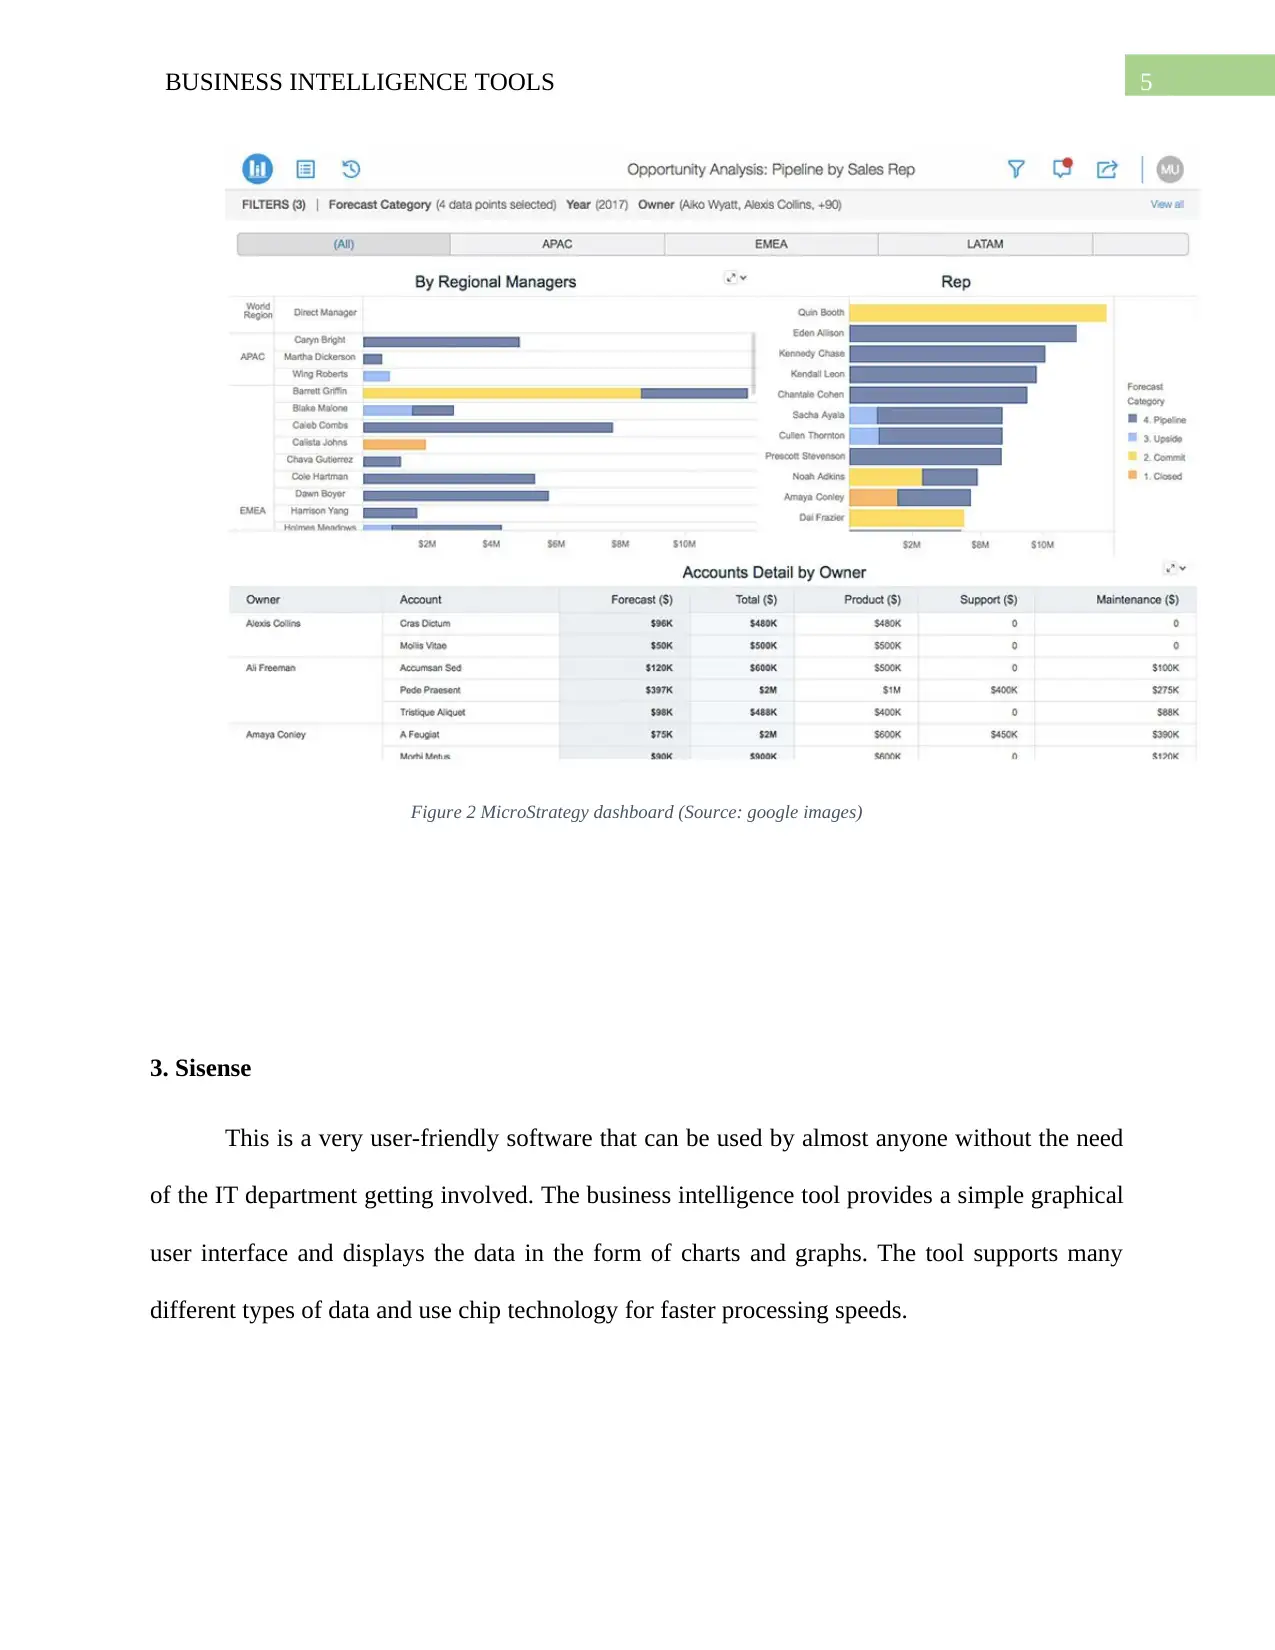
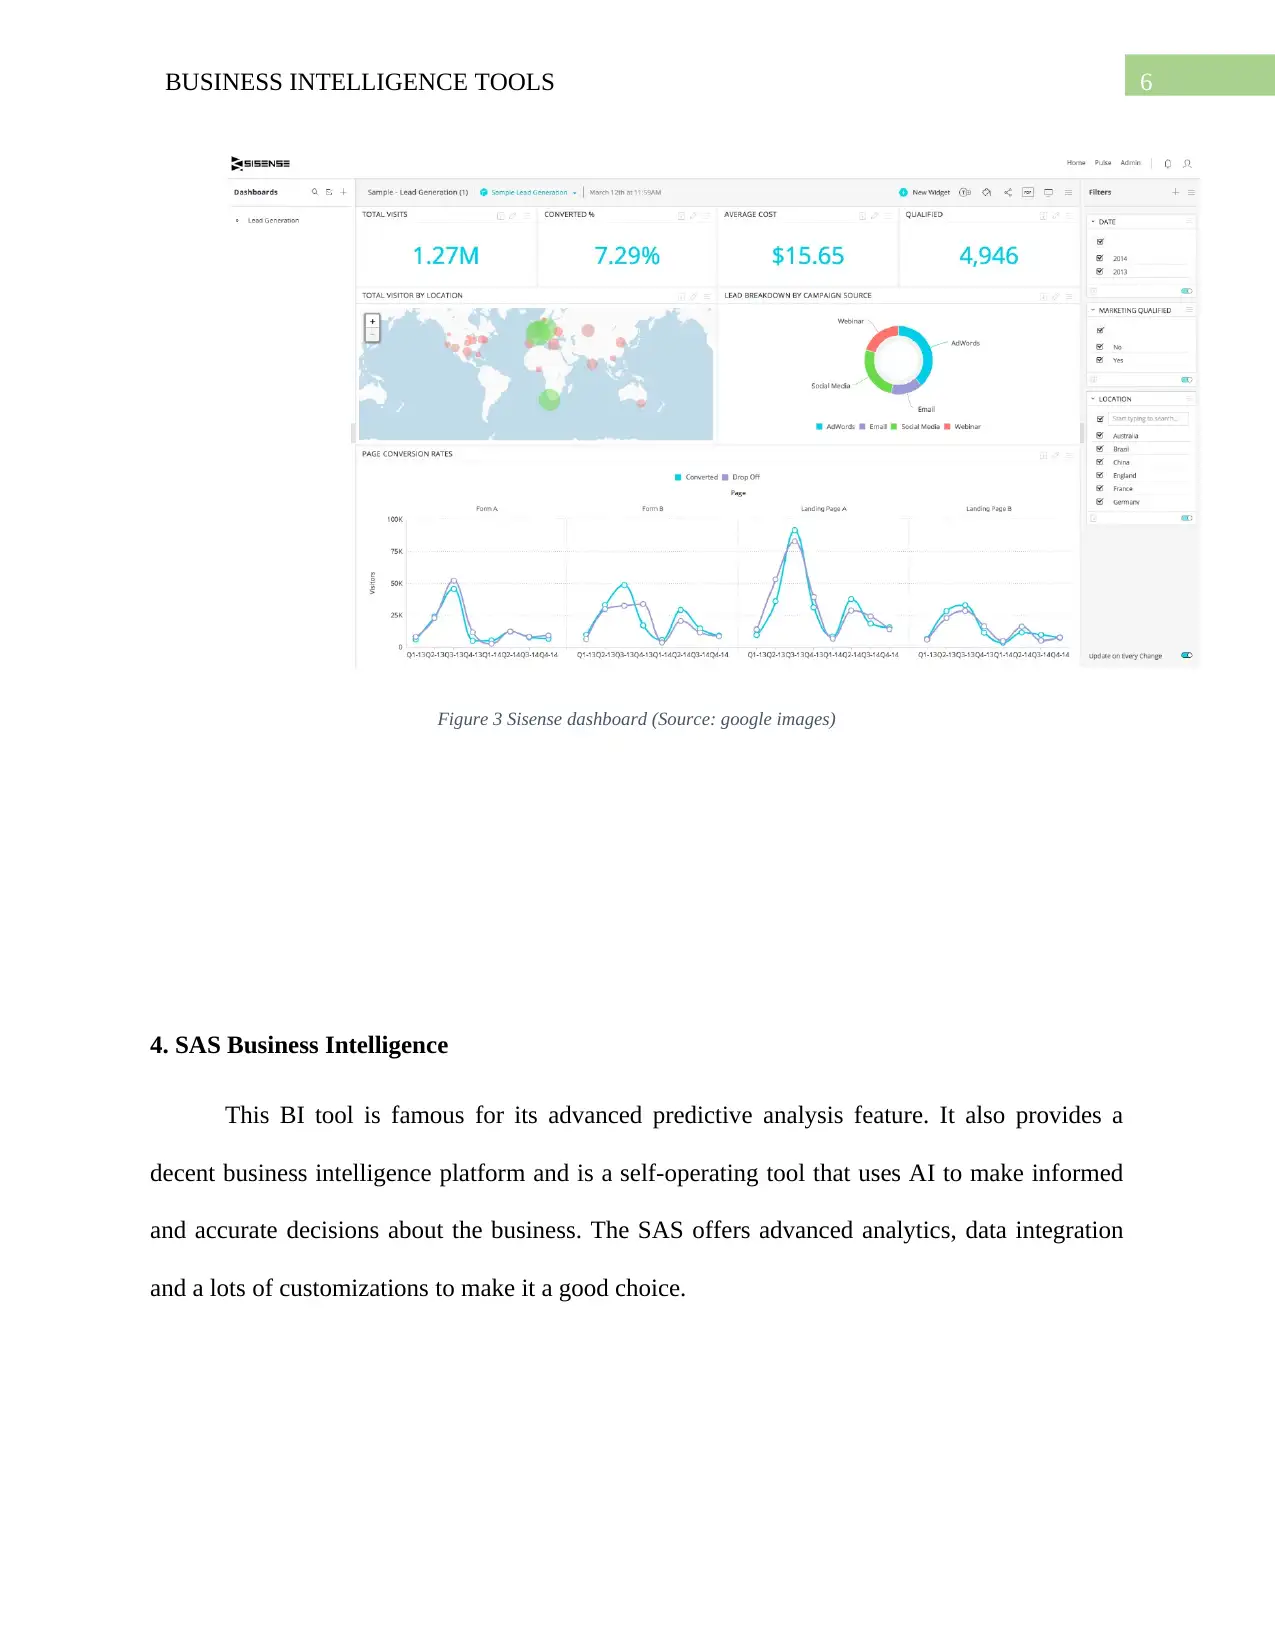
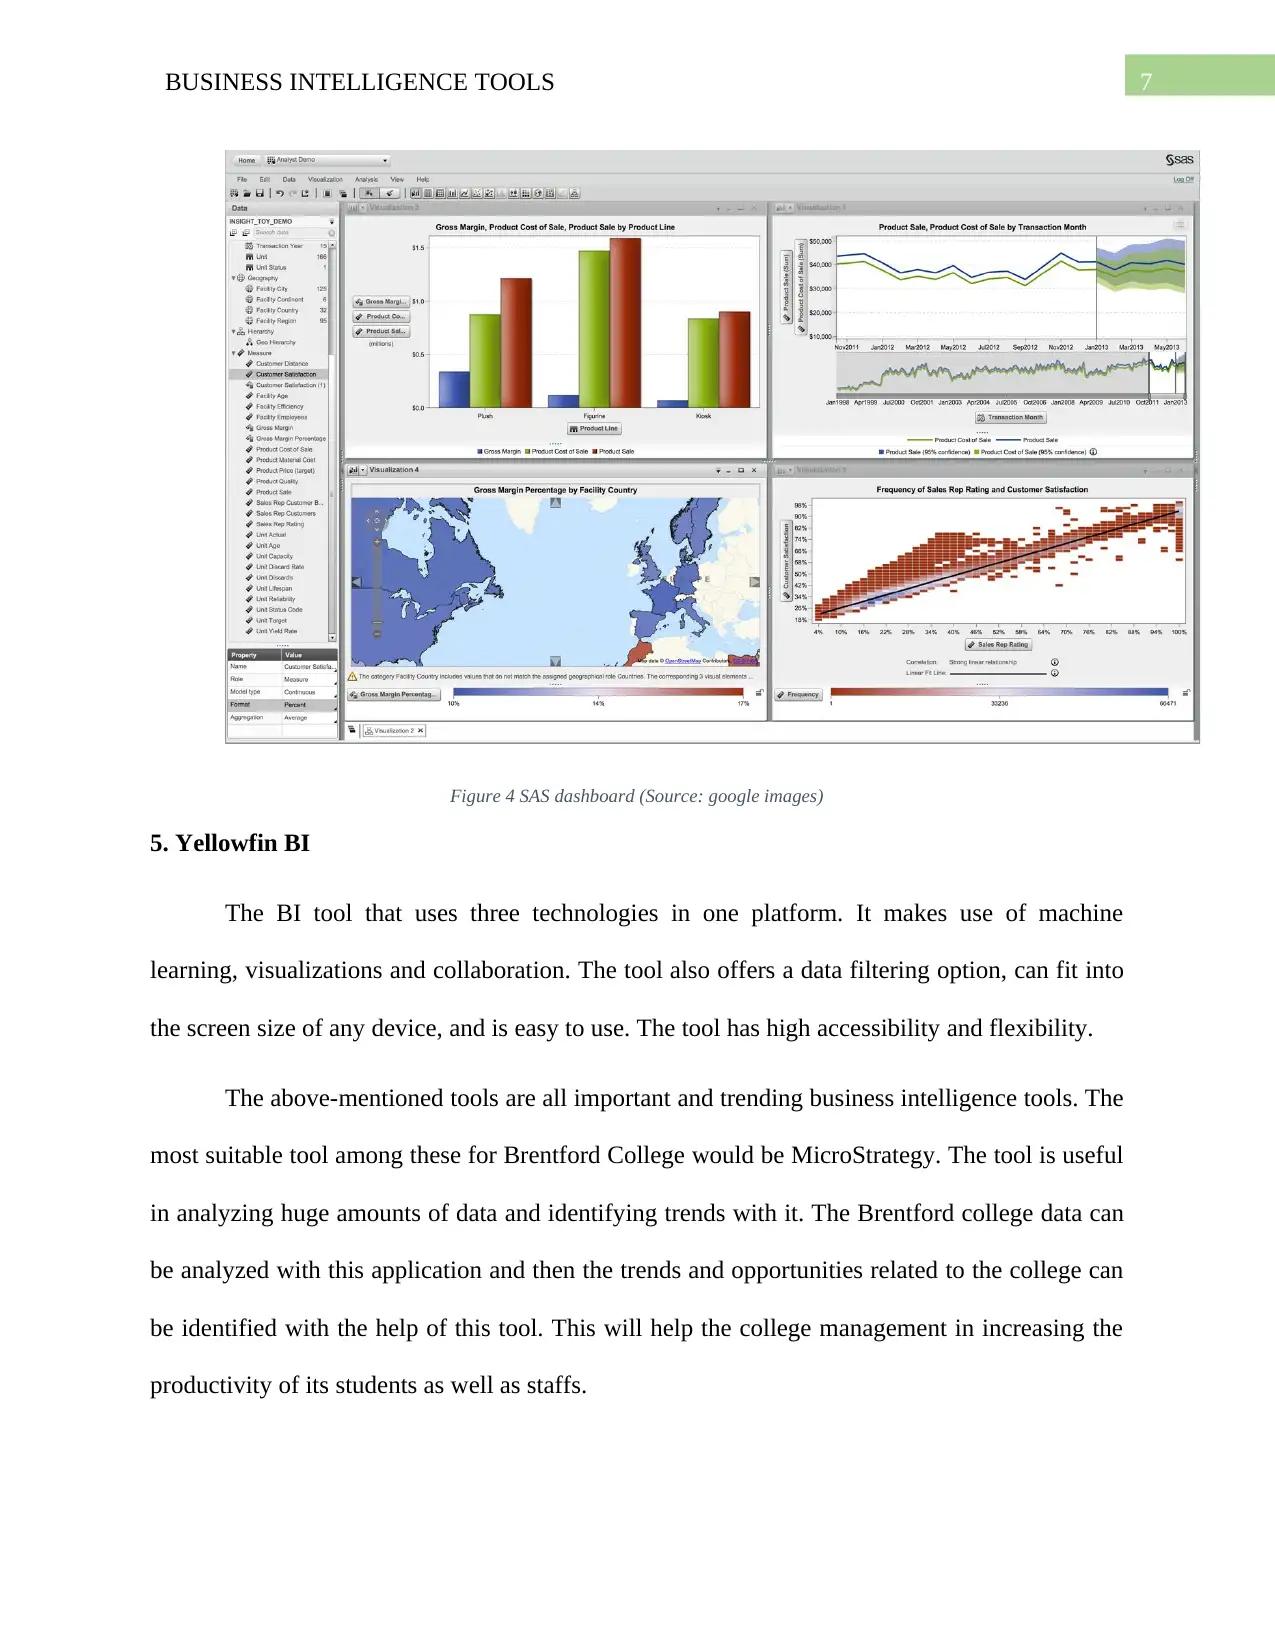
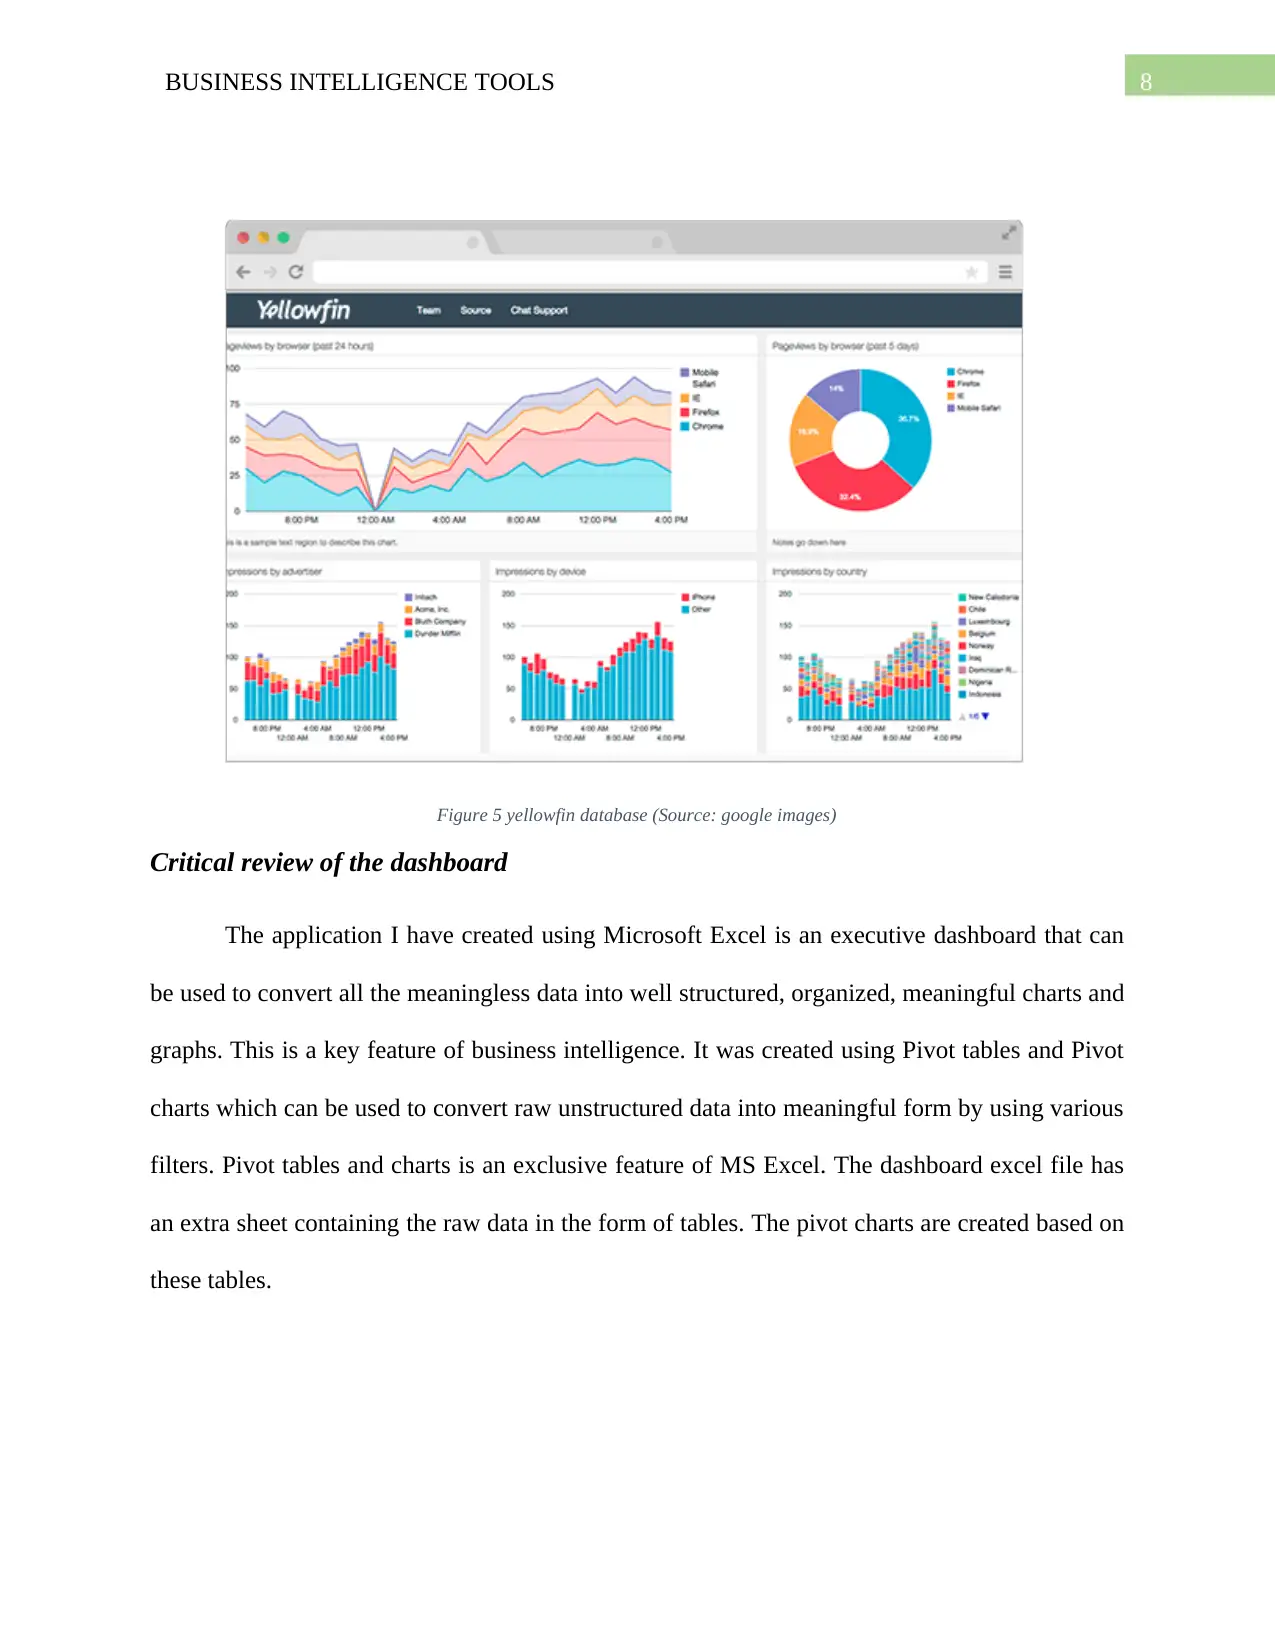
This report examines various business intelligence (BI) tools, including SAP Business Intelligence, MicroStrategy, Sisense, SAS Business Intelligence, and Yellowfin BI, and their applications in analyzing data and supporting decision-making processes. The report focuses on how these tools can be used to improve data analysis, identify trends, and increase productivity, particularly in the context of Brentford College. It also includes a critical review of a dashboard created using Microsoft Excel, highlighting its ability to transform raw data into meaningful charts and graphs. The report concludes by recommending MicroStrategy as the most suitable tool for Brentford College and emphasizes the importance of BI tools in modern business environments.

Running head: BUSINESS INTELLIGENCE TOOLS
BUSINESS INTELLIGENCE TOOLS
Name of the Student:
Name of the University:
Author Note:
BUSINESS INTELLIGENCE TOOLS
Name of the Student:
Name of the University:
Author Note:
Paraphrase This Document
Need a fresh take? Get an instant paraphrase of this document with our AI Paraphraser

1BUSINESS INTELLIGENCE TOOLS
Executive Summary
Business process defines the methodologies and mechanisms needed to make important business
decisions. The huge amount of data Brentford College collected can be easily analyzed using the
various business analytics tools available. This can help them make sense of the data. This report
will conclude stating about the different BI tools and how they can help to improve the Brentford
College by analyzing their datasets and identifying new trends.

2BUSINESS INTELLIGENCE TOOLS
Table of Contents
Introduction......................................................................................................................................3
Discussion........................................................................................................................................3
Business intelligence tools and techniques..................................................................................3
Critical review of the dashboard.................................................................................................4
Conclusion.......................................................................................................................................5
References........................................................................................................................................6
⊘ This is a preview!⊘
Do you want full access?
Subscribe today to unlock all pages.

Trusted by 1+ million students worldwide

3BUSINESS INTELLIGENCE TOOLS
Introduction
The business intelligence tools are the main mechanisms to implement business
intelligence strategies. These tools can be used by Brentford college administration to their
benefit as per their requirement.
Discussion
Business intelligence tools and techniques
The following section will discuss these tools in detail.
1. SAP Business Intelligence
The SAP Business Intelligence offers many advanced analytics features that include real
time BI prediction analysis, planning and analysis and machine learning. This BI intelligence
platform offers data visualizations and analytics, mobile analytics, office integration support and
reporting and analysis. The application is designed for all IT roles and offers tons of useful
features in a single platform.
Paraphrase This Document
Need a fresh take? Get an instant paraphrase of this document with our AI Paraphraser

4BUSINESS INTELLIGENCE TOOLS
Figure 1 SAP dashboard (Source: google images)
2. MicroStrategy
MicroStrategy is a business intelligence tool that offers powerful dashboard and analytics
features that can help monitor and identify current trends. This can help in identifying new
opportunities and increase productivity. The software is capable enough to handle data from
multiple sources and can be accessed from both mobile and desktop platforms.

5BUSINESS INTELLIGENCE TOOLS
Figure 2 MicroStrategy dashboard (Source: google images)
3. Sisense
This is a very user-friendly software that can be used by almost anyone without the need
of the IT department getting involved. The business intelligence tool provides a simple graphical
user interface and displays the data in the form of charts and graphs. The tool supports many
different types of data and use chip technology for faster processing speeds.
⊘ This is a preview!⊘
Do you want full access?
Subscribe today to unlock all pages.

Trusted by 1+ million students worldwide

6BUSINESS INTELLIGENCE TOOLS
Figure 3 Sisense dashboard (Source: google images)
4. SAS Business Intelligence
This BI tool is famous for its advanced predictive analysis feature. It also provides a
decent business intelligence platform and is a self-operating tool that uses AI to make informed
and accurate decisions about the business. The SAS offers advanced analytics, data integration
and a lots of customizations to make it a good choice.
Paraphrase This Document
Need a fresh take? Get an instant paraphrase of this document with our AI Paraphraser

7BUSINESS INTELLIGENCE TOOLS
Figure 4 SAS dashboard (Source: google images)
5. Yellowfin BI
The BI tool that uses three technologies in one platform. It makes use of machine
learning, visualizations and collaboration. The tool also offers a data filtering option, can fit into
the screen size of any device, and is easy to use. The tool has high accessibility and flexibility.
The above-mentioned tools are all important and trending business intelligence tools. The
most suitable tool among these for Brentford College would be MicroStrategy. The tool is useful
in analyzing huge amounts of data and identifying trends with it. The Brentford college data can
be analyzed with this application and then the trends and opportunities related to the college can
be identified with the help of this tool. This will help the college management in increasing the
productivity of its students as well as staffs.

8BUSINESS INTELLIGENCE TOOLS
Figure 5 yellowfin database (Source: google images)
Critical review of the dashboard
The application I have created using Microsoft Excel is an executive dashboard that can
be used to convert all the meaningless data into well structured, organized, meaningful charts and
graphs. This is a key feature of business intelligence. It was created using Pivot tables and Pivot
charts which can be used to convert raw unstructured data into meaningful form by using various
filters. Pivot tables and charts is an exclusive feature of MS Excel. The dashboard excel file has
an extra sheet containing the raw data in the form of tables. The pivot charts are created based on
these tables.
⊘ This is a preview!⊘
Do you want full access?
Subscribe today to unlock all pages.

Trusted by 1+ million students worldwide

9BUSINESS INTELLIGENCE TOOLS
Conclusion
To conclude the application meets the needs of the college as the dashboard displays all
the data types given in the table and draws out meaningful connections from the haphazardly
arranged data set. In total the dashboard displays 5 sets of different graphs and one colored table.
Conclusion
To conclude the application meets the needs of the college as the dashboard displays all
the data types given in the table and draws out meaningful connections from the haphazardly
arranged data set. In total the dashboard displays 5 sets of different graphs and one colored table.
Paraphrase This Document
Need a fresh take? Get an instant paraphrase of this document with our AI Paraphraser

10BUSINESS INTELLIGENCE TOOLS
References
Shukla, A. and Dhir, S., 2016. Tools for data visualization in Business Intelligence: Case Study
using the tool Qlikview. In Information Systems Design and Intelligent Applications (pp. 319-
326). Springer, New Delhi.
Turban, E., Sharda, R. and Delen, D., 2010. Decision Support and Business Intelligence Systems
(required). Google Scholar.
Wimmer, H. and Powell, L.M., 2016. A comparison of open source tools for data science.
Journal of Information Systems Applied Research, 9(2), p.4.
Zur Muehlen, M. and Shapiro, R., 2015. Business process analytics. In Handbook on Business
Process Management 2 (pp. 243-263). Springer, Berlin, Heidelberg.
1 out of 11
Related Documents

Your All-in-One AI-Powered Toolkit for Academic Success.
 +13062052269
info@desklib.com
Available 24*7 on WhatsApp / Email
Unlock your academic potential
Copyright © 2020–2025 A2Z Services. All Rights Reserved. Developed and managed by ZUCOL.