BI2BM45 Key Skills in Biomedicine 2 Statistics Assignment

Verified

Added on  2022/09/14

|8
|924
|17
Homework Assignment
AI Summary
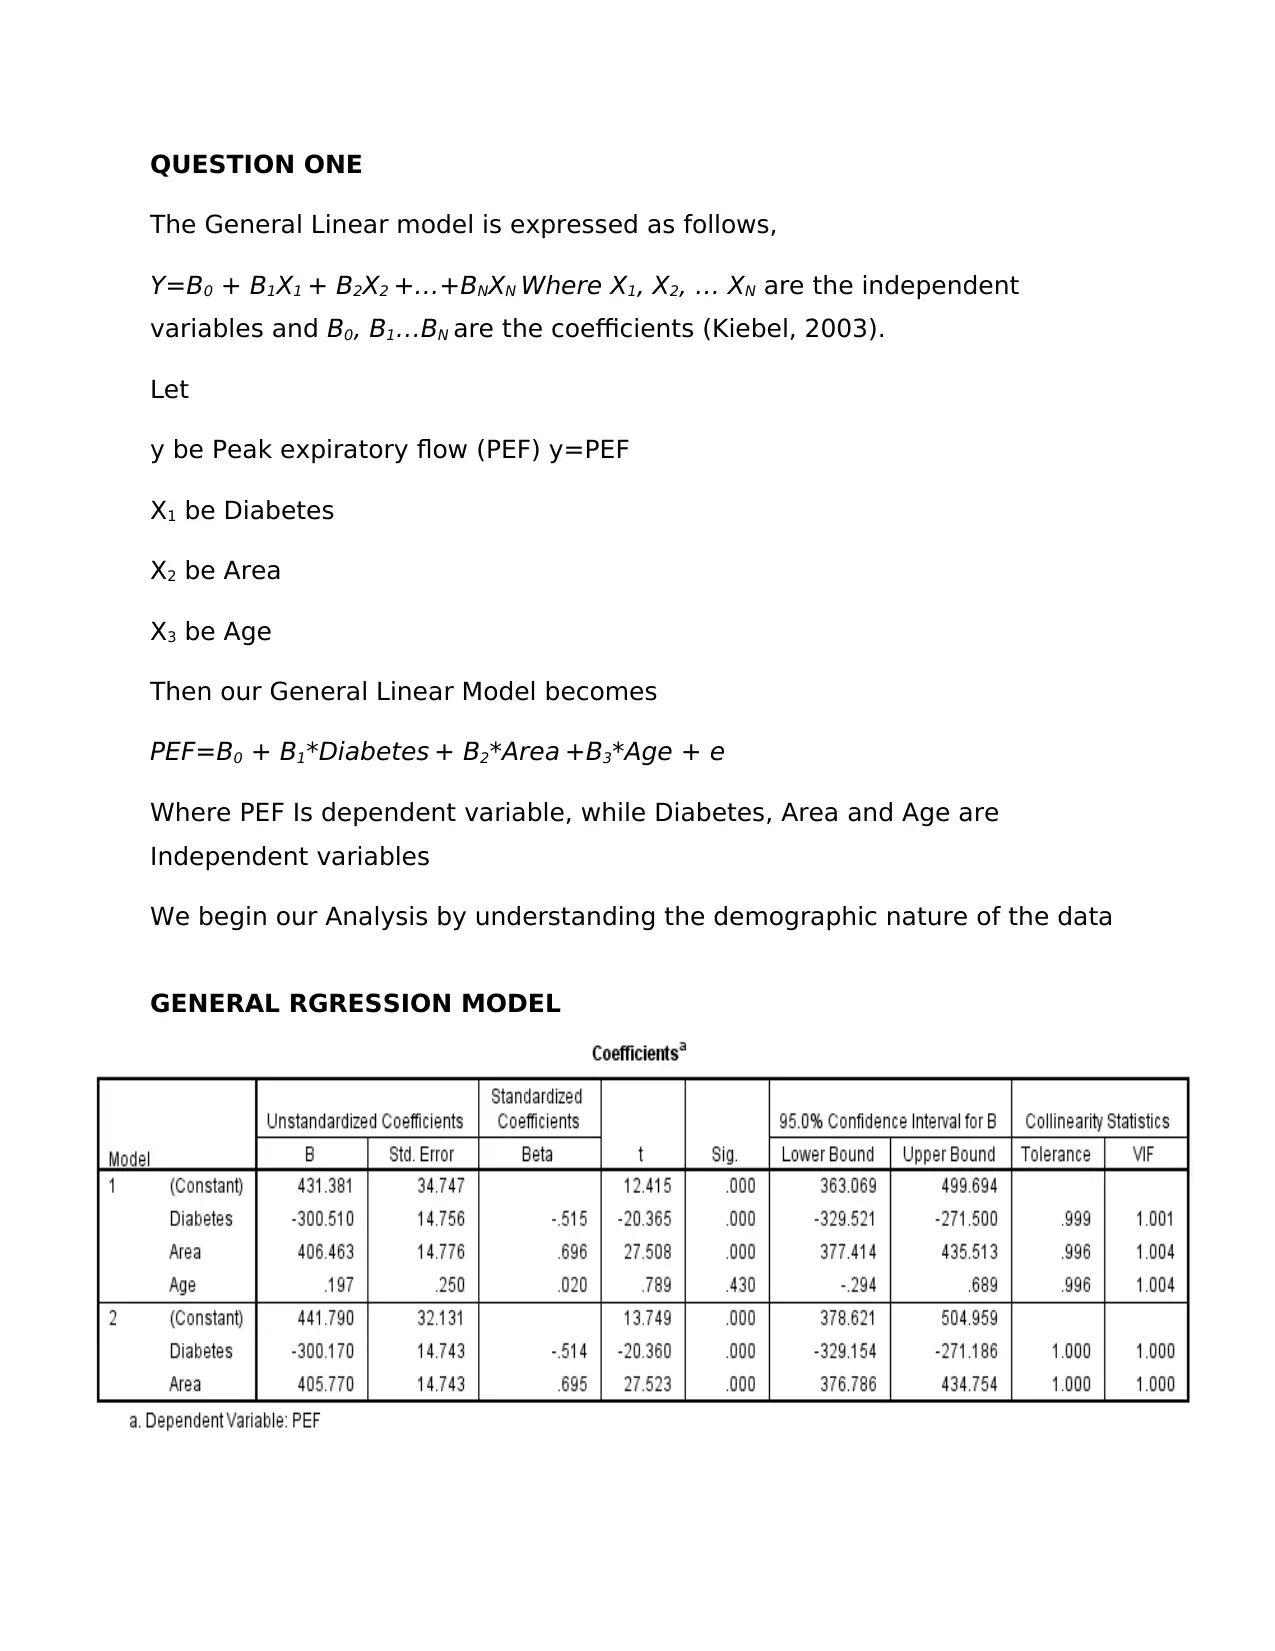
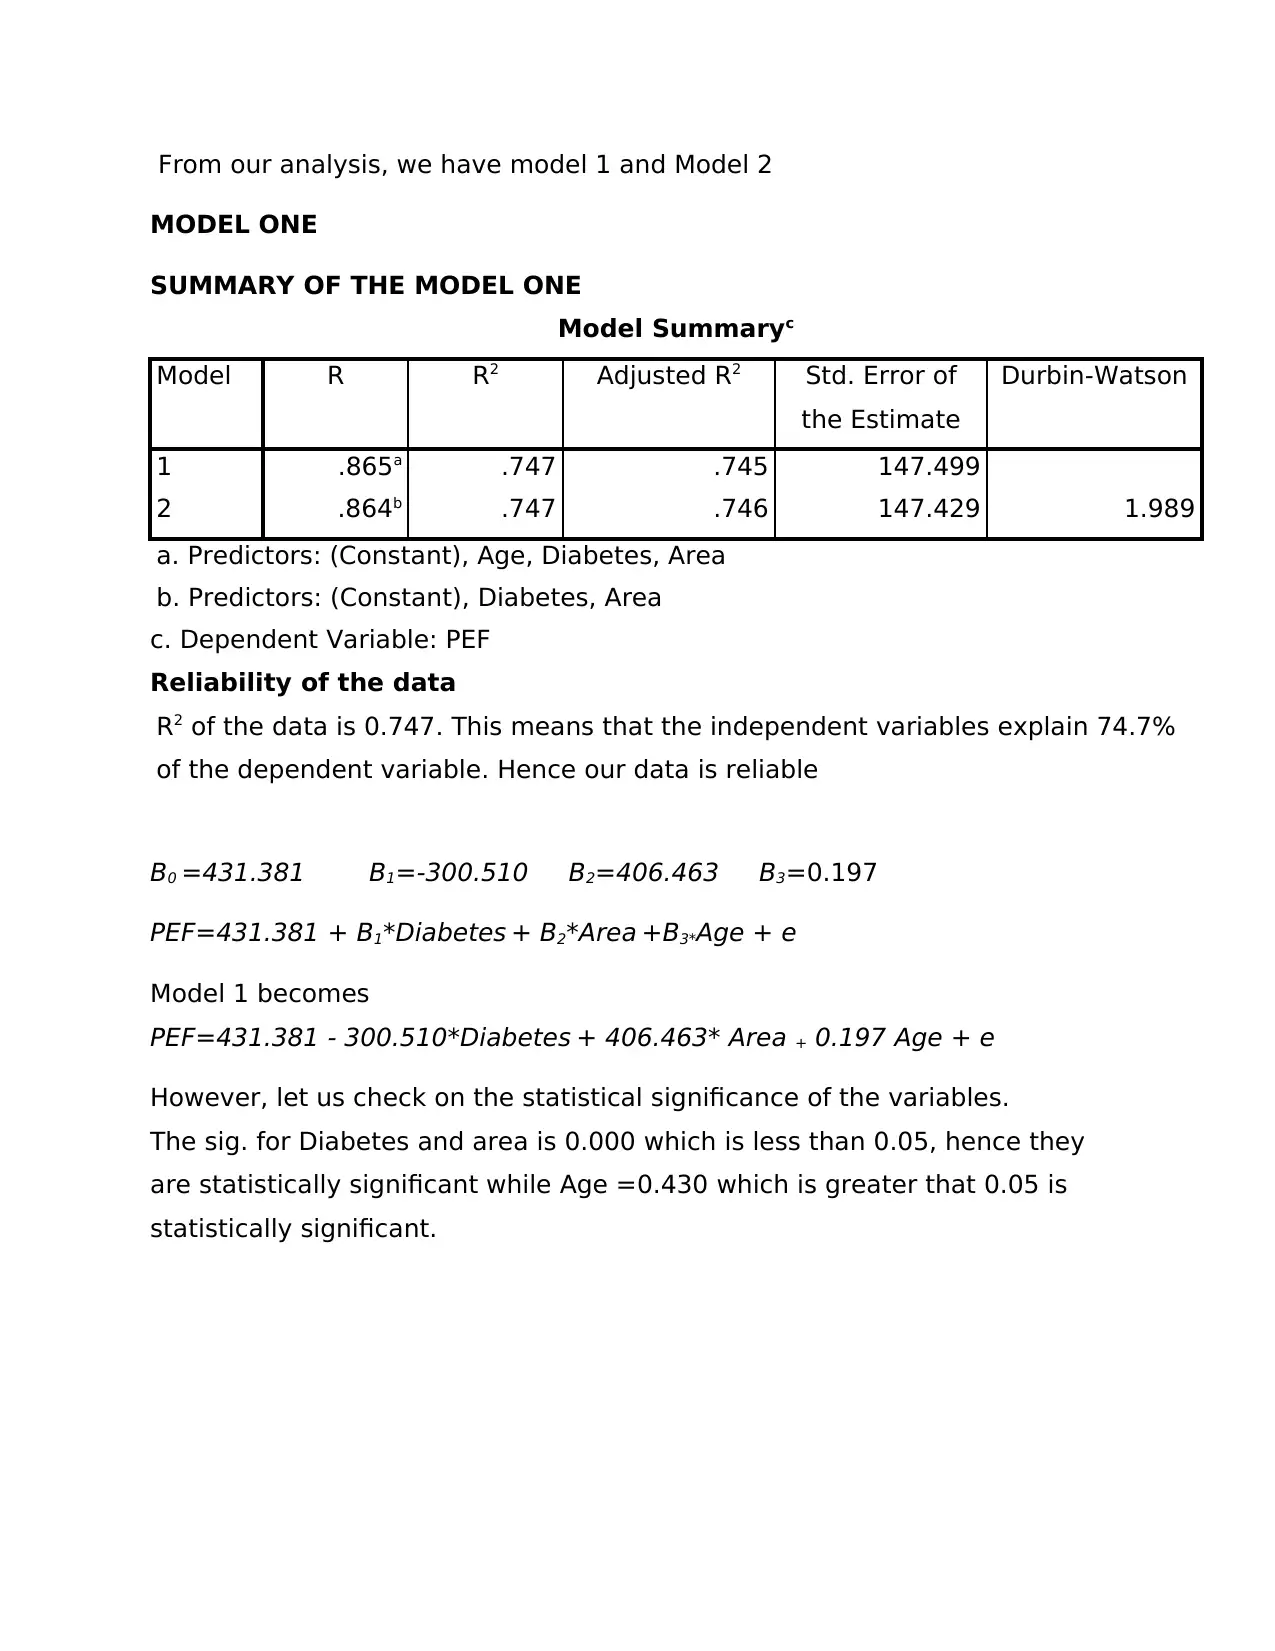
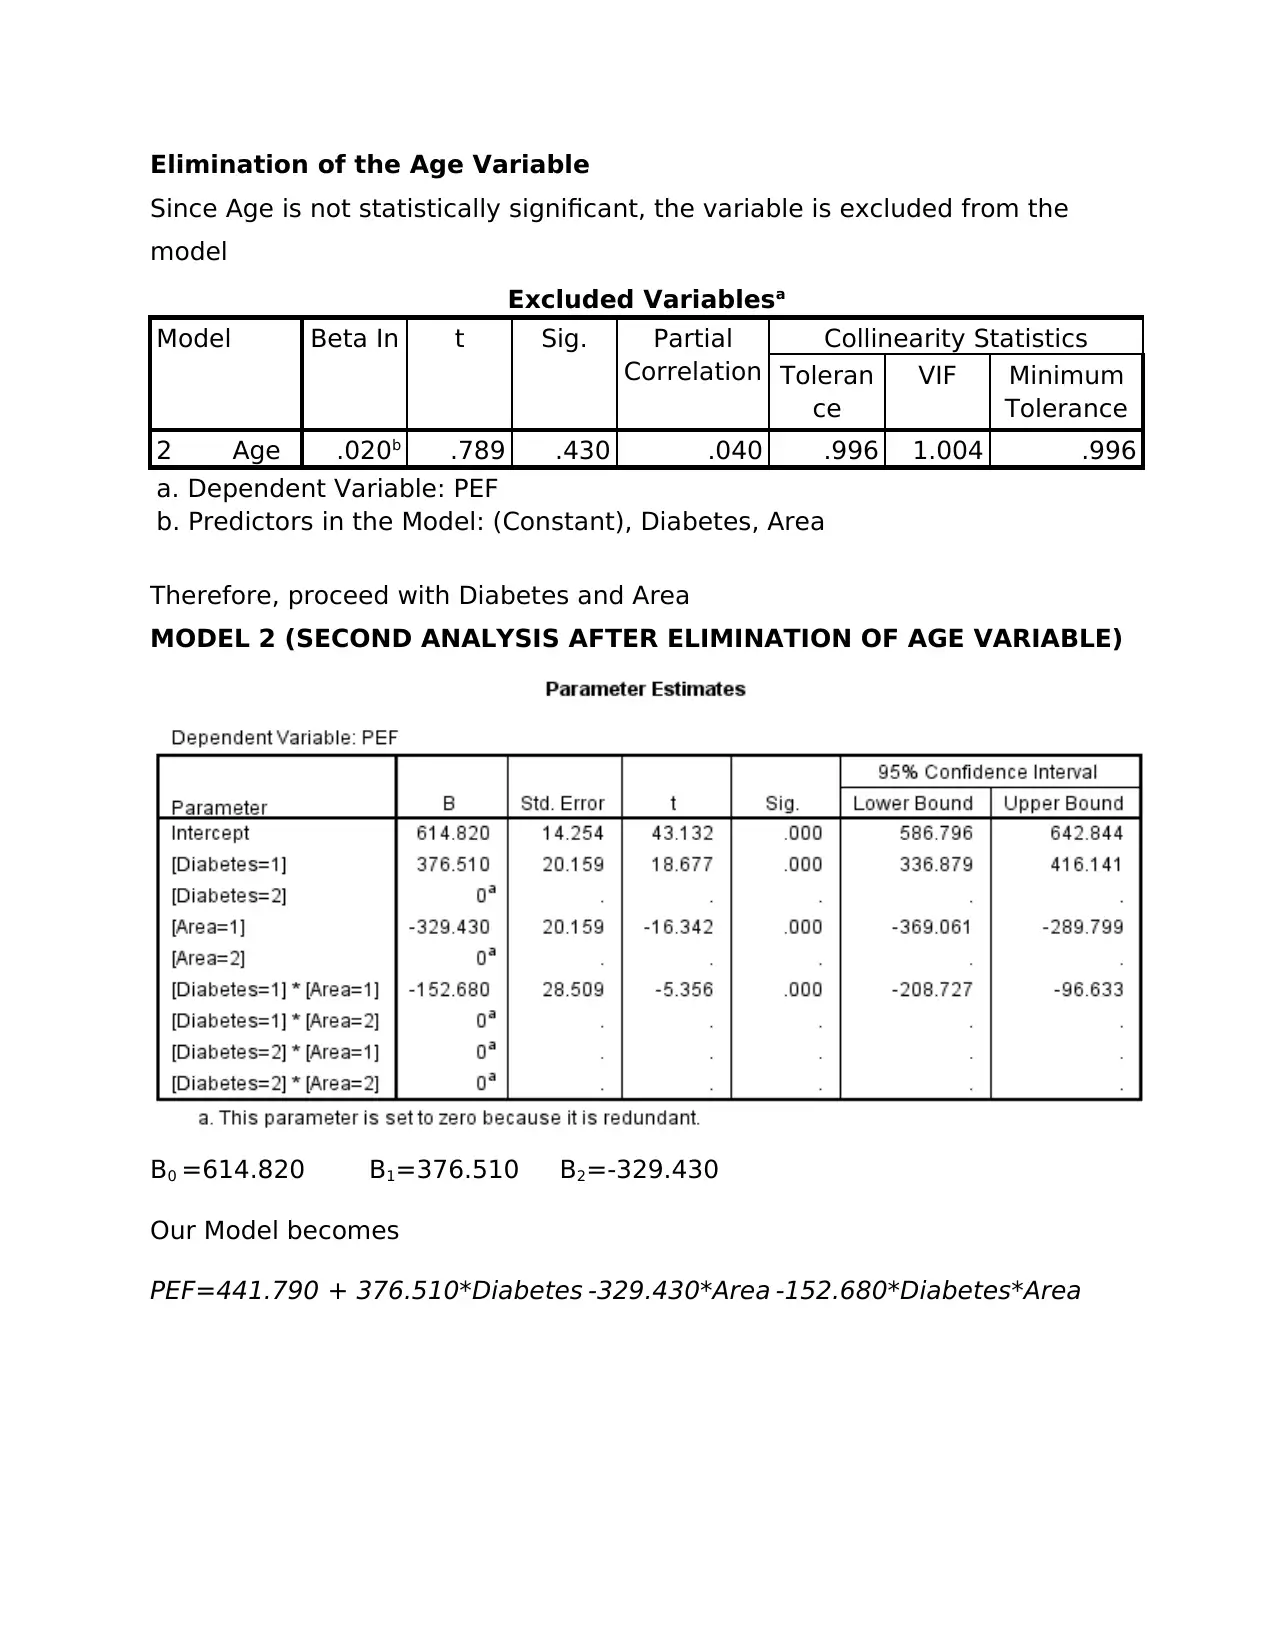
This document presents a detailed solution to a statistics assignment for the BI2BM45 Key Skills in Biomedicine 2 course. The assignment focuses on the application of the general linear model and regression analysis to a dataset concerning Peak Expiratory Flow (PEF), diabetes, area, and age. The analysis includes model building, assessing the statistical significance of variables, and eliminating insignificant variables to refine the model. The solution provides a summary of Model 1 and Model 2, including R-squared values, coefficient interpretations, and checks for multicollinearity, autocorrelation, normality, lack of fit, and homogeneity. The final model is presented, along with the interpretation of coefficients. The document includes a comprehensive analysis of the data, including the statistical significance of variables, the model's reliability, and tests for various assumptions, such as normality and homogeneity of variance. The document concludes with the references used in the analysis.
Document Page
QUESTION ONE
The General Linear model is expressed as follows,
Y=B0 + B1X1 + B2X2 +…+BNXN Where X1, X2, … XN are the independent
variables and B0, B1…BN are the coefficients (Kiebel, 2003).
Let
y be Peak expiratory flow (PEF) y=PEF
X1 be Diabetes
X2 be Area
X3 be Age
Then our General Linear Model becomes
PEF=B0 + B1*Diabetes + B2*Area +B3*Age + e
Where PEF Is dependent variable, while Diabetes, Area and Age are
Independent variables
We begin our Analysis by understanding the demographic nature of the data
GENERAL RGRESSION MODEL
tabler-icon-diamond-filled.svg

Secure Best Marks with AI Grader

Need help grading? Try our AI Grader for instant feedback on your assignments.
Document Page
From our analysis, we have model 1 and Model 2
MODEL ONE
SUMMARY OF THE MODEL ONE
Model Summaryc
Model R R2 Adjusted R2 Std. Error of
the Estimate
Durbin-Watson
1 .865a .747 .745 147.499
2 .864b .747 .746 147.429 1.989
a. Predictors: (Constant), Age, Diabetes, Area
b. Predictors: (Constant), Diabetes, Area
c. Dependent Variable: PEF
Reliability of the data
R2 of the data is 0.747. This means that the independent variables explain 74.7%
of the dependent variable. Hence our data is reliable
B0 =431.381 B1=-300.510 B2=406.463 B3=0.197
PEF=431.381 + B1*Diabetes + B2*Area +B3*Age + e
Model 1 becomes
PEF=431.381 - 300.510*Diabetes + 406.463* Area + 0.197 Age + e
However, let us check on the statistical significance of the variables.
The sig. for Diabetes and area is 0.000 which is less than 0.05, hence they
are statistically significant while Age =0.430 which is greater that 0.05 is
statistically significant.
Document Page
Elimination of the Age Variable
Since Age is not statistically significant, the variable is excluded from the
model
Excluded Variablesa
Model Beta In t Sig. Partial
Correlation
Collinearity Statistics
Toleran
ce
VIF Minimum
Tolerance
2 Age .020b .789 .430 .040 .996 1.004 .996
a. Dependent Variable: PEF
b. Predictors in the Model: (Constant), Diabetes, Area
Therefore, proceed with Diabetes and Area
MODEL 2 (SECOND ANALYSIS AFTER ELIMINATION OF AGE VARIABLE)
B0 =614.820 B1=376.510 B2=-329.430
Our Model becomes
PEF=441.790 + 376.510*Diabetes -329.430*Area -152.680*Diabetes*Area
Document Page
Multicollinearity check
Multicollinearity occur when Variance Inflation Factor (VIF) is less than 10. In
our analysis, the VIF is as follows
Diabetes=1.0001
Area=1.004
Age=1.004
This imply that multicollinearity does not affect our model and we can
therefore put our trust to the calculated coefficients and the p-value with no
further action
Checking for P values
Diabetes=0.0000 <0.05, Area-0.000<0.05 hence the two variables Age and
Area are statistically significant and are hence included in our final
regression model
Our final model becomes
PEF=441.790 + 376.510*Diabetes -329.430*Area -152.680*Diabetes*Area
is means that for every 1-unit increase in
Diabetes, PEF increases by 376.510
Area, PEF decreases by 329.430
Diabetes*Area, Decreases by -152.680
And consequent decrease in error term
MODEL 2 SUMMARY
From the table below, R squared is 0.764 implying that independent
variables explain about 76.4% of the dependent variable
tabler-icon-diamond-filled.svg

Secure Best Marks with AI Grader

Need help grading? Try our AI Grader for instant feedback on your assignments.
Document Page
Autocorrelation Taste
Durbin-Watson measures the existence of autocorrelation and it always has
values 0-4 where 0 -2. Values less than 2 shows that there is existence of
positive autocorrelation while those from 2-4 shows that there is negative
autocorrelation (Hill, 1987).
Our Durbin-Watson is 1.989 lying between two critical values 0<d<2 hence
existence of positive autocorrelation
Normality Check
Estimated Distribution Parameters
Diabetes Area Age PEF
Normal Distribution Location 1.50 1.50 50.08 600.19
Scale .501 .501 29.604 292.359
The cases are unweighted.
The plot shows that the points generally follows the normal distribution and hence the residuals
are normally distributed as indicated by the histogram below
Document Page
LACK OF FIT TEST
From our data, our P value=0.855 which is greater than 0.05 implying that it is not statistically
significant for lack of fit. We therefore conclude that the linear relationship is indeed adequate to
describe the relationship of the variables
HOMOGENEITY TEST
We use Lavene’s test for equality of variance as indicated in the table below. The sig. value sig.
value is greater than 0.05, which imply that the variance in the compared variables are not
different hence the condition of homogeneity is fulfilled (Moser, 1992).
Document Page
QUESTION TWO
Source DF Seq SS Adj SS MS F-value P-value
Corrected model 3 26057911.7 12737566.09 8685970.580 427.488 0.000
Intercept 1 144091214.4 8628949.380 144091214.4 7091.588 0.000
Diabetes 1 9010202.890 9010202.890 443.446 0.000
Area 1 16464929.29 16464929.29 810.337 0.000
Diabetes*Area 1 582779.560 582779.560 28.682 0.000
Error 396 8046169.820 20318.61
Total 400 178195296.0
Corrected Total 399 34104081.56
QUESTION THREE
tabler-icon-diamond-filled.svg

Paraphrase This Document

Need a fresh take? Get an instant paraphrase of this document with our AI Paraphraser
Document Page
References
Hill, R. J., & Flack, H. D. (1987). The use of the Durbin–Watson d statistic in
Rietveld analysis. Journal of Applied Crystallography, 20(5), 356-361.
Moser, B. K., & Stevens, G. R. (1992). Homogeneity of variance in the two-
sample means test. The American Statistician, 46(1), 19-21.
Kiebel, S., & Holmes, A. P. (2003). The general linear model. Human brain
function, 2, 725-760.
chevron_up_icon
1 out of 8
circle_padding
hide_on_mobile
zoom_out_icon
logo.png

Your All-in-One AI-Powered Toolkit for Academic Success.

Available 24*7 on WhatsApp / Email

[object Object]