An In-Depth Analysis of Big Data to Build Business Strategies
VerifiedAdded on 2023/02/01
|13
|5054
|55
Project
AI Summary
This project analyzes big data from the International Passenger Survey to provide strategic recommendations for Expat Explore Travel, a tour operator. The project begins with an introduction to big data and its applications in business, followed by an analysis of the survey data, including mode of travel, gender, purpose of travel, age group, package usage, duration of stay, and country of travel. The study identifies key patterns in the data to inform business decisions. The report then outlines techniques and tools, such as T-charts, market research, and cost-benefit analysis, that aid in business decision-making. The methodology section explains the use of descriptive statistics, including mean, median, mode, range, standard deviation, and correlation coefficients. The results section presents statistical findings, and the interpretation section provides insights based on these results. The project concludes with recommendations for Expat Explore Travel's marketing manager, leveraging the data analysis to improve business strategies. The project aims to demonstrate the practical application of big data in the business context, assisting in effective decision-making.

USING BIG DATA
TO BUILD BUSINESS
TO BUILD BUSINESS
Paraphrase This Document
Need a fresh take? Get an instant paraphrase of this document with our AI Paraphraser

Table of Contents
INTRODUCTION.....................................................................................................................................3
MAIN BODY.............................................................................................................................................3
Analysis of the big data.....................................................................................................................3
Defining the knowledge level of techniques and tools that helps in decision making......................4
Method...............................................................................................................................................5
Results...............................................................................................................................................6
Interpretation of the results................................................................................................................9
Recommendations...........................................................................................................................10
CONCLUSION........................................................................................................................................11
REFERENCES........................................................................................................................................12
INTRODUCTION
Big data means unstructured data which is large in quantity. It is growing trend
now that organizations uses big data science for the purpose of their market strategies
which has facilitated these companies to grow and expand their business in the
market. Analysis of big data helps business enterprise in its decision making and it
also assists in predicting future events with more reliability (Yin and Kaynak, 2015).
The current project report is about the analysis of the data collected by the
International Passenger Survey which is related to the residents who are entering and
leaving the country for different purposes. The present study will cover the findings
and interpretation of the big data. Further, it will also include the recommendations to
the marketing manger of Expat Explore Travel which is a tour operator based in
London, United Kingdom engaged in offering holiday packages, accommodations
facilities in hotels, resorts and many other travelling services to its customers.
MAIN BODY
Analysis of the big data
International Passenger Survey is a comprehensive data which was collected by
the Office for National Statistics which is related to the TravelPac, a tour operating in
the country. The data is about the residents who left and entered the country during
the period of Q3 of the year 2017. From the analysis of this data, the pattern of that
data will be ascertained which would help in taking effective decisions for the Expat
Explore Travel.
Mode : The data of TravelPac involves the mode through UK residents and
overseas passengers entered and left the country.It includes sea, tunnel, airway.
From the data, it can be said that majority of the people travelled by the medium
of air.
Gender : The data collected by IBS is divided on the basis of gender. It includes
the women who travelled overseas, males who travelled overseas, and so on.
Purpose : The big data also contains the information about the purpose for which
people travelled into and outside the country. From the data, it can be seen that
⊘ This is a preview!⊘
Do you want full access?
Subscribe today to unlock all pages.
Trusted by 1+ million students worldwide
people travelled for the purpose of holidays, meeting friends and relatives, study
purposes It was analyzed that majority of passengers travelled because of the
holiday and meeting friends and relatives purposes.
Age group : The data is collected in accordance with the age group of the people
who travelled during the period of July to September. It was seen that the data
was segregated in age group such as 0-15, 16-24, 25-34, 35-44, 45-5 and so on. It
was observed that the age group that travelled the most was 16-24 and 25-34.
Package : In the data, it was included that residents travelled with and without the
travelling package. It was learnt during analyzing the data that most of the
passengers travelled without the holiday or travel package.
Duration : The data is collected for the number of nights residents stayed while
travelling in and outside the country. It was anlysed that majority of the people
stayed for 4-13 nights. However, some stayed for 1-3 nights, some did not stay at
all, some stayed for 14-28 nights, some for 7-14 nights and for some passengers
the data is unknown.
Country : The big data included the data about the country to which residents of
the UK travelled. The different countries were Czech Republic, Germany, Spain,
Hungary, UAE, Netherlands, Italy etc. It was observed that majority of the
people travelled to Italy, Spain, Germany and Hungary.
Defining the knowledge level of techniques and tools that helps in decision making
Business decision making is the systematic procedure of forming a rational and
effective decisions with the help of various business decision making tools and
techniques (Cao, Duan and Li, 2015).Managers of the Expat Explore Travel could
employ various tools for making good and effective decisions for the company. The
decision making aspect of the management is very critical to the success or failure of
an organization which is the reason why business entities put so much of their time
and efforts in drawing the best decisions. The various tools and techniques are
described below :
T- Chart : The technique can be used by the managers of Expat Explore Travel
for weighing pros and cons of different options. This tool is effective because it
makes sure that each positive and negative aspects of all available options before a
final decision is taken by them (Techniques and Tools to Help You Make Business
Paraphrase This Document
Need a fresh take? Get an instant paraphrase of this document with our AI Paraphraser
Decisions, 2017).
Market research : Market research refers to the scanning of the external
environment of the business entity. Business managers of the Expat Explore can scan
the market scenario for assessing the insights of the market circumstances,
preferences of the customers, the position of its competitors, what its competitors are
selling in the market etc. This will help the managers in being well-known with all the
required market information which in turn would assist them in taking dynamic and
effective market strategy that could cope up with the demanding situations of the
market (Fernando and Engel, 2018).
Cost-Benefit analysis : This is the tool which could help the managers of Expat
Explore Travel in weighing each alternative in the financial terms. It means that cost
of each strategy will be estimated and the benefit that would be derived from taking
up of that strategy will be matched against its cost. Such analysis would help the
manager in knowing the financial aspect of each strategy or decision.
Method
Descriptive statistics : For the purpose of analyzing and interpreting the, descriptive
statistical method is used. It refers to analyzing of the big data that summarized in
such a meaningful manner that it reflects a pattern emerging out of the data set or
sample population (George and Mallery, 2016). It allows the analyst to describe the
given data in the most meaningful way possible. The purpose of descriptive statistical
tool is to assist the business managers in their decision making. It consists of the
following elements in its analysis:
Mean : It is one of the measure of central tendency. It is often called as average
of all the values in the given data set. It is caluclated by adding up all the values
of the data set and dividng the same with the number of items in the given data
series.
Median : It is the middle value of the sample population.It basically divides the
data series into upper and lower half (Dean and Illowsky, 2018).
Mode : It is another measure of central tendency which is the numerical term that
occurs most in the given data set. In other words, mode refers to the term which is
the most recurring value in the sample population.
Range : It can be defined as the difference between the highest and lowest value
in the data series. It measures the degree of variability of the given data.
Standard deviation : It is the measure of dispersion which is concerned with the
ascertaining the degree of variance or scatter in the variables.
Correlation coefficient : It is statistical tool used for assessing the linear
relationship between the two variables. It helps in knowing the direction of the
two variables whether going in the same direction or in the negative direction.
The range of correlation is + 1 to - 1 (Cox, 2018).
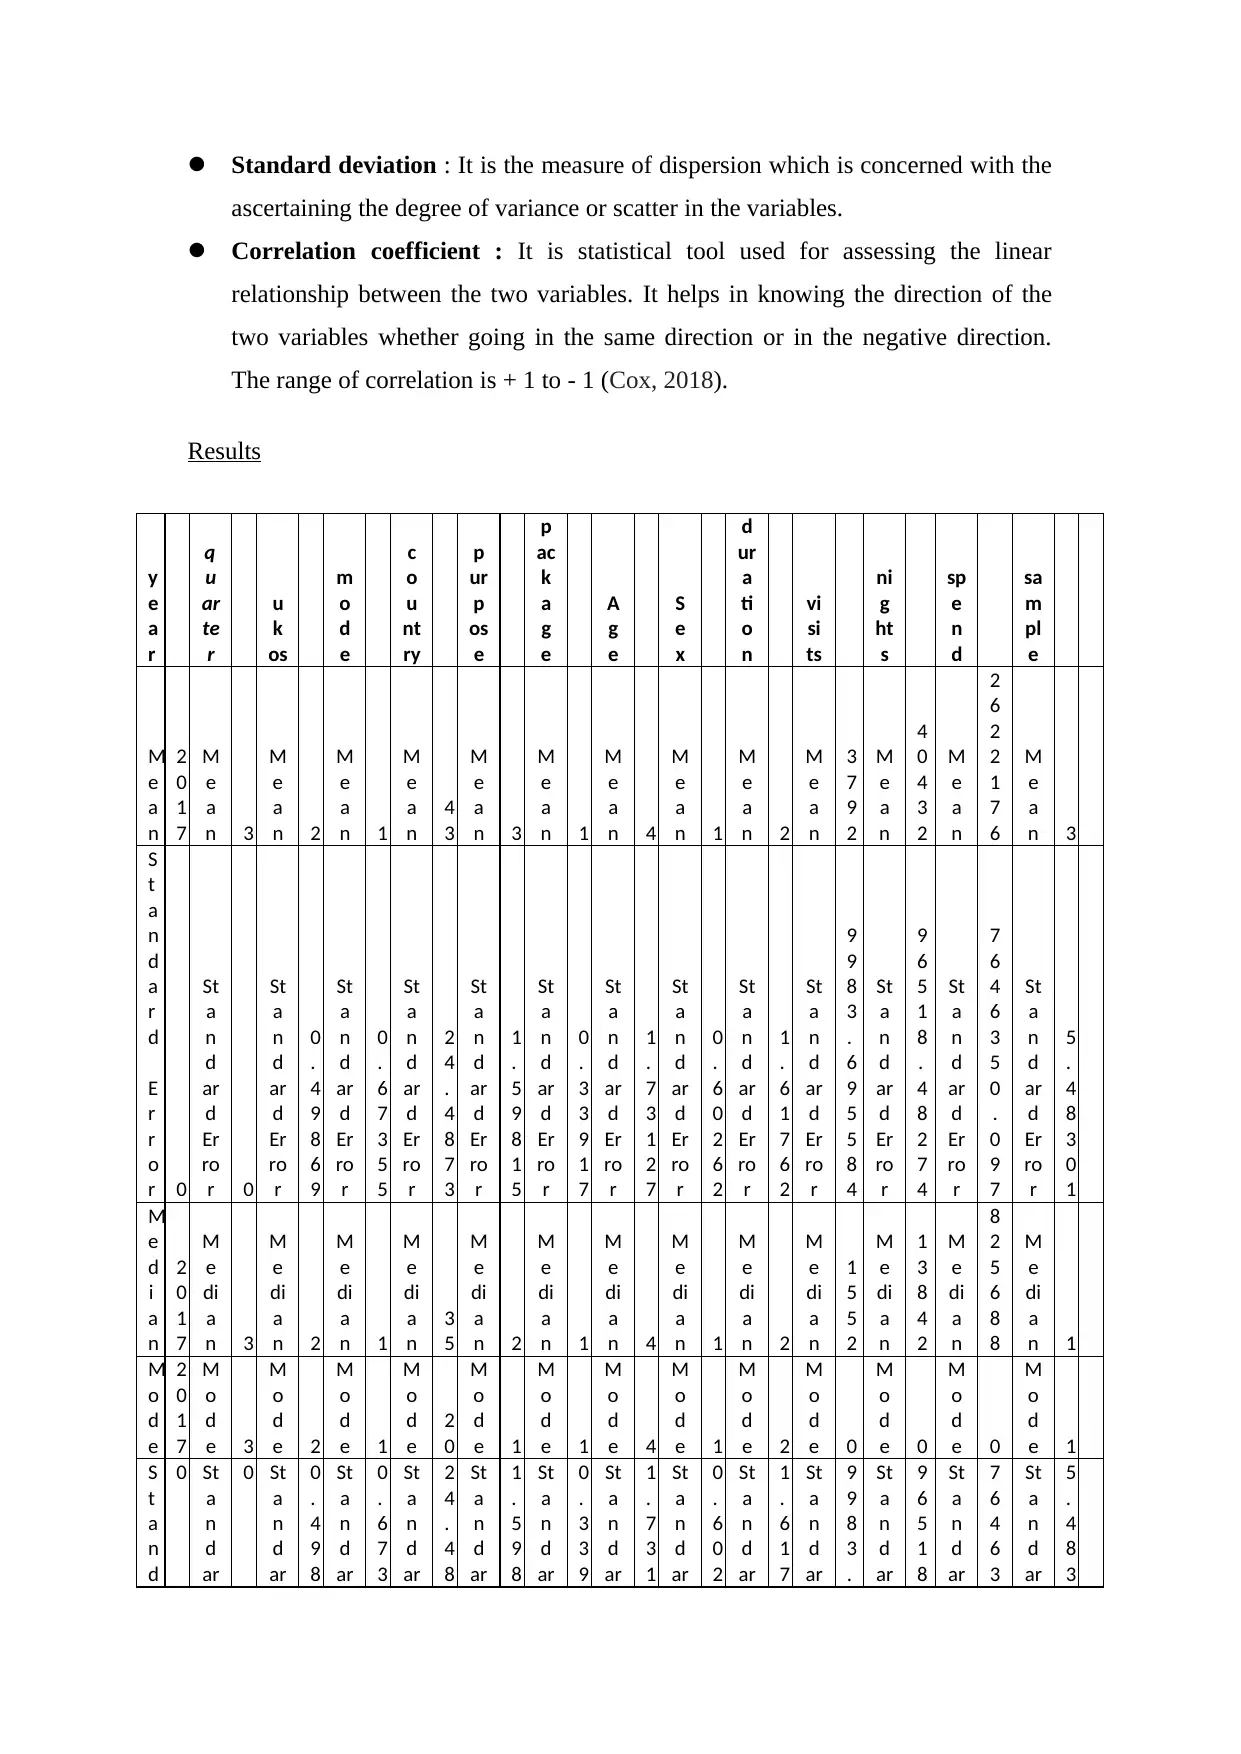
Results
y
e
a
r
q
u
ar
te
r
u
k
os
m
o
d
e
c
o
u
nt
ry
p
ur
p
os
e
p
ac
k
a
g
e
A
g
e
S
e
x
d
ur
a
ti
o
n
vi
si
ts
ni
g
ht
s
sp
e
n
d
sa
m
pl
e
M
e
a
n
2
0
1
7
M
e
a
n 3
M
e
a
n 2
M
e
a
n 1
M
e
a
n
4
3
M
e
a
n 3
M
e
a
n 1
M
e
a
n 4
M
e
a
n 1
M
e
a
n 2
M
e
a
n
3
7
9
2
M
e
a
n
4
0
4
3
2
M
e
a
n
2
6
2
2
1
7
6
M
e
a
n 3
S
t
a
n
d
a
r
d
E
r
r
o
r 0
St
a
n
d
ar
d
Er
ro
r 0
St
a
n
d
ar
d
Er
ro
r
0
.
4
9
8
6
9
St
a
n
d
ar
d
Er
ro
r
0
.
6
7
3
5
5
St
a
n
d
ar
d
Er
ro
r
2
4
.
4
8
7
3
St
a
n
d
ar
d
Er
ro
r
1
.
5
9
8
1
5
St
a
n
d
ar
d
Er
ro
r
0
.
3
3
9
1
7
St
a
n
d
ar
d
Er
ro
r
1
.
7
3
1
2
7
St
a
n
d
ar
d
Er
ro
r
0
.
6
0
2
6
2
St
a
n
d
ar
d
Er
ro
r
1
.
6
1
7
6
2
St
a
n
d
ar
d
Er
ro
r
9
9
8
3
.
6
9
5
5
8
4
St
a
n
d
ar
d
Er
ro
r
9
6
5
1
8
.
4
8
2
7
4
St
a
n
d
ar
d
Er
ro
r
7
6
4
6
3
5
0
.
0
9
7
St
a
n
d
ar
d
Er
ro
r
5
.
4
8
3
0
1
M
e
d
i
a
n
2
0
1
7
M
e
di
a
n 3
M
e
di
a
n 2
M
e
di
a
n 1
M
e
di
a
n
3
5
M
e
di
a
n 2
M
e
di
a
n 1
M
e
di
a
n 4
M
e
di
a
n 1
M
e
di
a
n 2
M
e
di
a
n
1
5
5
2
M
e
di
a
n
1
3
8
4
2
M
e
di
a
n
8
2
5
6
8
8
M
e
di
a
n 1
M
o
d
e
2
0
1
7
M
o
d
e 3
M
o
d
e 2
M
o
d
e 1
M
o
d
e
2
0
M
o
d
e 1
M
o
d
e 1
M
o
d
e 4
M
o
d
e 1
M
o
d
e 2
M
o
d
e 0
M
o
d
e 0
M
o
d
e 0
M
o
d
e 1
S
t
a
n
d
0 St
a
n
d
ar
0 St
a
n
d
ar
0
.
4
9
8
St
a
n
d
ar
0
.
6
7
3
St
a
n
d
ar
2
4
.
4
8
St
a
n
d
ar
1
.
5
9
8
St
a
n
d
ar
0
.
3
3
9
St
a
n
d
ar
1
.
7
3
1
St
a
n
d
ar
0
.
6
0
2
St
a
n
d
ar
1
.
6
1
7
St
a
n
d
ar
9
9
8
3
.
St
a
n
d
ar
9
6
5
1
8
St
a
n
d
ar
7
6
4
6
3
St
a
n
d
ar
5
.
4
8
3
ascertaining the degree of variance or scatter in the variables.
Correlation coefficient : It is statistical tool used for assessing the linear
relationship between the two variables. It helps in knowing the direction of the
two variables whether going in the same direction or in the negative direction.
The range of correlation is + 1 to - 1 (Cox, 2018).
Results
y
e
a
r
q
u
ar
te
r
u
k
os
m
o
d
e
c
o
u
nt
ry
p
ur
p
os
e
p
ac
k
a
g
e
A
g
e
S
e
x
d
ur
a
ti
o
n
vi
si
ts
ni
g
ht
s
sp
e
n
d
sa
m
pl
e
M
e
a
n
2
0
1
7
M
e
a
n 3
M
e
a
n 2
M
e
a
n 1
M
e
a
n
4
3
M
e
a
n 3
M
e
a
n 1
M
e
a
n 4
M
e
a
n 1
M
e
a
n 2
M
e
a
n
3
7
9
2
M
e
a
n
4
0
4
3
2
M
e
a
n
2
6
2
2
1
7
6
M
e
a
n 3
S
t
a
n
d
a
r
d
E
r
r
o
r 0
St
a
n
d
ar
d
Er
ro
r 0
St
a
n
d
ar
d
Er
ro
r
0
.
4
9
8
6
9
St
a
n
d
ar
d
Er
ro
r
0
.
6
7
3
5
5
St
a
n
d
ar
d
Er
ro
r
2
4
.
4
8
7
3
St
a
n
d
ar
d
Er
ro
r
1
.
5
9
8
1
5
St
a
n
d
ar
d
Er
ro
r
0
.
3
3
9
1
7
St
a
n
d
ar
d
Er
ro
r
1
.
7
3
1
2
7
St
a
n
d
ar
d
Er
ro
r
0
.
6
0
2
6
2
St
a
n
d
ar
d
Er
ro
r
1
.
6
1
7
6
2
St
a
n
d
ar
d
Er
ro
r
9
9
8
3
.
6
9
5
5
8
4
St
a
n
d
ar
d
Er
ro
r
9
6
5
1
8
.
4
8
2
7
4
St
a
n
d
ar
d
Er
ro
r
7
6
4
6
3
5
0
.
0
9
7
St
a
n
d
ar
d
Er
ro
r
5
.
4
8
3
0
1
M
e
d
i
a
n
2
0
1
7
M
e
di
a
n 3
M
e
di
a
n 2
M
e
di
a
n 1
M
e
di
a
n
3
5
M
e
di
a
n 2
M
e
di
a
n 1
M
e
di
a
n 4
M
e
di
a
n 1
M
e
di
a
n 2
M
e
di
a
n
1
5
5
2
M
e
di
a
n
1
3
8
4
2
M
e
di
a
n
8
2
5
6
8
8
M
e
di
a
n 1
M
o
d
e
2
0
1
7
M
o
d
e 3
M
o
d
e 2
M
o
d
e 1
M
o
d
e
2
0
M
o
d
e 1
M
o
d
e 1
M
o
d
e 4
M
o
d
e 1
M
o
d
e 2
M
o
d
e 0
M
o
d
e 0
M
o
d
e 0
M
o
d
e 1
S
t
a
n
d
0 St
a
n
d
ar
0 St
a
n
d
ar
0
.
4
9
8
St
a
n
d
ar
0
.
6
7
3
St
a
n
d
ar
2
4
.
4
8
St
a
n
d
ar
1
.
5
9
8
St
a
n
d
ar
0
.
3
3
9
St
a
n
d
ar
1
.
7
3
1
St
a
n
d
ar
0
.
6
0
2
St
a
n
d
ar
1
.
6
1
7
St
a
n
d
ar
9
9
8
3
.
St
a
n
d
ar
9
6
5
1
8
St
a
n
d
ar
7
6
4
6
3
St
a
n
d
ar
5
.
4
8
3
⊘ This is a preview!⊘
Do you want full access?
Subscribe today to unlock all pages.
Trusted by 1+ million students worldwide
a
r
d
D
e
v
i
a
t
i
o
n
d
D
ev
ia
ti
o
n
d
D
ev
ia
ti
o
n
6
9
d
D
e
vi
a
ti
o
n
5
5
d
D
ev
ia
ti
o
n
7
3
d
D
ev
ia
ti
o
n
1
5
d
D
ev
ia
ti
o
n
1
7
d
D
ev
ia
ti
o
n
2
7
d
D
ev
ia
ti
o
n
6
2
d
D
e
vi
a
ti
o
n
6
2
d
D
ev
ia
ti
o
n
6
9
5
5
8
4
d
D
e
vi
a
ti
o
n
.
4
8
2
7
4
d
D
ev
ia
ti
o
n
5
0
.
0
9
7
d
D
ev
ia
ti
o
n
0
1
S
a
m
p
l
e
V
a
r
i
a
n
c
e 0
Sa
m
pl
e
V
ar
ia
nc
e 0
Sa
m
pl
e
V
ar
ia
nc
e
0
.
2
4
8
6
9
Sa
m
pl
e
V
ar
ia
n
ce
0
.
4
5
3
6
7
Sa
m
pl
e
V
ar
ia
nc
e
5
9
9
.
6
2
8
Sa
m
pl
e
V
ar
ia
nc
e
2
.
5
5
4
0
8
Sa
m
pl
e
V
ar
ia
nc
e
0
.
1
1
5
0
4
Sa
m
pl
e
V
ar
ia
nc
e
2
.
9
9
7
2
9
Sa
m
pl
e
V
ar
ia
nc
e
0
.
3
6
3
1
5
Sa
m
pl
e
V
ar
ia
n
ce
2
.
6
1
6
6
9
Sa
m
pl
e
V
ar
ia
nc
e
9
9
6
7
4
1
7
7
.
5
1
Sa
m
pl
e
V
ar
ia
n
ce
9
3
1
5
8
1
7
5
1
0
Sa
m
pl
e
V
ar
ia
nc
e
5
.
8
4
6
6
7
E
+
1
3
Sa
m
pl
e
V
ar
ia
nc
e
3
0
.
0
6
3
4
K
u
r
t
o
s
i
s
#
D
I
V
/
0
!
K
ur
to
si
s
#
D
I
V
/
0
!
K
ur
to
si
s
-
1
.
9
7
9
K
ur
to
si
s
0
.
8
3
4
3
3
K
ur
to
si
s
-
1
.
0
5
8
8
K
ur
to
si
s
-
1
.
2
5
4
1
K
ur
to
si
s
2
.
6
9
5
9
1
K
ur
to
si
s
-
0
.
8
1
9
9
K
ur
to
si
s
4
5
.
0
7
3
K
ur
to
si
s
6
.
6
8
3
2
K
ur
to
si
s
2
0
5
.
7
4
6
1
4
1
8
K
ur
to
si
s
9
4
.
5
8
9
3
8
2
4
2
K
ur
to
si
s
2
0
8
.
8
3
5
9
2
2
K
ur
to
si
s
1
7
0
.
2
6
2
S
k
e
w
n
e
s
s
#
D
I
V
/
0
!
Sk
e
w
n
es
s
#
D
I
V
/
0
!
Sk
e
w
n
es
s
-
0
.
1
4
6
5
Sk
e
w
n
es
s
1
.
5
1
0
3
1
Sk
e
w
n
es
s
0
.
5
7
9
2
Sk
e
w
n
es
s
0
.
4
5
2
5
6
Sk
e
w
n
es
s
2
.
1
6
6
8
7
Sk
e
w
n
es
s
0
.
0
3
6
6
1
Sk
e
w
n
es
s
3
.
8
1
5
4
7
Sk
e
w
n
es
s
2
.
1
6
1
2
Sk
e
w
n
es
s
1
2
.
3
1
8
1
9
4
9
8
Sk
e
w
n
es
s
8
.
0
1
1
7
6
1
6
4
8
Sk
e
w
n
es
s
1
1
.
8
3
2
6
8
4
5
4
Sk
e
w
n
es
s
1
0
.
9
2
6
4
R
a
n
g
e
0 R
a
n
g
e
0 R
a
n
g
e
1 R
a
n
g
e
2 R
a
n
g
e
8
2
R
a
n
g
e
8 R
a
n
g
e
1 R
a
n
g
e
8 R
a
n
g
e
9 R
a
n
g
e
9 R
a
n
g
e
2
2
7
2
9
9
R
a
n
g
e
1
9
2
8
2
0
R
a
n
g
e
2
1
5
8
7
2
R
a
n
g
e
1
2
5
r
d
D
e
v
i
a
t
i
o
n
d
D
ev
ia
ti
o
n
d
D
ev
ia
ti
o
n
6
9
d
D
e
vi
a
ti
o
n
5
5
d
D
ev
ia
ti
o
n
7
3
d
D
ev
ia
ti
o
n
1
5
d
D
ev
ia
ti
o
n
1
7
d
D
ev
ia
ti
o
n
2
7
d
D
ev
ia
ti
o
n
6
2
d
D
e
vi
a
ti
o
n
6
2
d
D
ev
ia
ti
o
n
6
9
5
5
8
4
d
D
e
vi
a
ti
o
n
.
4
8
2
7
4
d
D
ev
ia
ti
o
n
5
0
.
0
9
7
d
D
ev
ia
ti
o
n
0
1
S
a
m
p
l
e
V
a
r
i
a
n
c
e 0
Sa
m
pl
e
V
ar
ia
nc
e 0
Sa
m
pl
e
V
ar
ia
nc
e
0
.
2
4
8
6
9
Sa
m
pl
e
V
ar
ia
n
ce
0
.
4
5
3
6
7
Sa
m
pl
e
V
ar
ia
nc
e
5
9
9
.
6
2
8
Sa
m
pl
e
V
ar
ia
nc
e
2
.
5
5
4
0
8
Sa
m
pl
e
V
ar
ia
nc
e
0
.
1
1
5
0
4
Sa
m
pl
e
V
ar
ia
nc
e
2
.
9
9
7
2
9
Sa
m
pl
e
V
ar
ia
nc
e
0
.
3
6
3
1
5
Sa
m
pl
e
V
ar
ia
n
ce
2
.
6
1
6
6
9
Sa
m
pl
e
V
ar
ia
nc
e
9
9
6
7
4
1
7
7
.
5
1
Sa
m
pl
e
V
ar
ia
n
ce
9
3
1
5
8
1
7
5
1
0
Sa
m
pl
e
V
ar
ia
nc
e
5
.
8
4
6
6
7
E
+
1
3
Sa
m
pl
e
V
ar
ia
nc
e
3
0
.
0
6
3
4
K
u
r
t
o
s
i
s
#
D
I
V
/
0
!
K
ur
to
si
s
#
D
I
V
/
0
!
K
ur
to
si
s
-
1
.
9
7
9
K
ur
to
si
s
0
.
8
3
4
3
3
K
ur
to
si
s
-
1
.
0
5
8
8
K
ur
to
si
s
-
1
.
2
5
4
1
K
ur
to
si
s
2
.
6
9
5
9
1
K
ur
to
si
s
-
0
.
8
1
9
9
K
ur
to
si
s
4
5
.
0
7
3
K
ur
to
si
s
6
.
6
8
3
2
K
ur
to
si
s
2
0
5
.
7
4
6
1
4
1
8
K
ur
to
si
s
9
4
.
5
8
9
3
8
2
4
2
K
ur
to
si
s
2
0
8
.
8
3
5
9
2
2
K
ur
to
si
s
1
7
0
.
2
6
2
S
k
e
w
n
e
s
s
#
D
I
V
/
0
!
Sk
e
w
n
es
s
#
D
I
V
/
0
!
Sk
e
w
n
es
s
-
0
.
1
4
6
5
Sk
e
w
n
es
s
1
.
5
1
0
3
1
Sk
e
w
n
es
s
0
.
5
7
9
2
Sk
e
w
n
es
s
0
.
4
5
2
5
6
Sk
e
w
n
es
s
2
.
1
6
6
8
7
Sk
e
w
n
es
s
0
.
0
3
6
6
1
Sk
e
w
n
es
s
3
.
8
1
5
4
7
Sk
e
w
n
es
s
2
.
1
6
1
2
Sk
e
w
n
es
s
1
2
.
3
1
8
1
9
4
9
8
Sk
e
w
n
es
s
8
.
0
1
1
7
6
1
6
4
8
Sk
e
w
n
es
s
1
1
.
8
3
2
6
8
4
5
4
Sk
e
w
n
es
s
1
0
.
9
2
6
4
R
a
n
g
e
0 R
a
n
g
e
0 R
a
n
g
e
1 R
a
n
g
e
2 R
a
n
g
e
8
2
R
a
n
g
e
8 R
a
n
g
e
1 R
a
n
g
e
8 R
a
n
g
e
9 R
a
n
g
e
9 R
a
n
g
e
2
2
7
2
9
9
R
a
n
g
e
1
9
2
8
2
0
R
a
n
g
e
2
1
5
8
7
2
R
a
n
g
e
1
2
5
Paraphrase This Document
Need a fresh take? Get an instant paraphrase of this document with our AI Paraphraser
8
9
5
4
M
i
n
i
m
u
m
2
0
1
7
M
in
i
m
u
m 3
M
in
i
m
u
m 1
M
in
i
m
u
m 1
M
in
i
m
u
m
1
0
M
in
i
m
u
m 1
M
in
i
m
u
m 1
M
in
i
m
u
m 1
M
in
i
m
u
m 0
M
in
i
m
u
m 0
M
in
i
m
u
m 0
M
in
i
m
u
m 0
M
in
i
m
u
m 0
M
in
i
m
u
m 0
M
a
x
i
m
u
m
2
0
1
7
M
ax
i
m
u
m 3
M
ax
i
m
u
m 2
M
ax
i
m
u
m 3
M
ax
i
m
u
m
9
2
M
ax
i
m
u
m 9
M
ax
i
m
u
m 2
M
ax
i
m
u
m 9
M
ax
i
m
u
m 9
M
ax
i
m
u
m 9
M
ax
i
m
u
m
2
2
7
2
9
8
.
5
8
4
M
ax
i
m
u
m
1
9
2
8
2
0
7
.
9
1
8
M
ax
i
m
u
m
2
1
5
8
7
2
9
5
4
M
ax
i
m
u
m
1
2
5
S
u
m
1
8
5
8
6
6
5
5
S
u
m
2
7
,
6
4
5
S
u
m
1
4
,
1
5
9
S
u
m
1
2
,
7
2
1
S
u
m
3
9
2
,
9
5
5
S
u
m
2
3
,
2
8
1
S
u
m
1
0
,
4
3
7
S
u
m
3
7
,
9
7
1
S
u
m
1
3
,
5
9
4
S
u
m
2
2
,
0
7
0
S
u
m
3
4
,
9
3
8
,
9
4
0
.
1
1
4
S
u
m
3
7
2
,
5
7
7
,
2
6
4
.
7
0
9
S
u
m
2
4
,
1
6
3
,
3
4
7
,
9
3
7
.
9
6
6
S
u
m
2
5
,
1
7
9
C
o
u
n
t
9
2
1
5
C
o
u
nt
9
2
1
5
C
o
u
nt
9
2
1
5
C
o
u
nt
9
2
1
5
C
o
u
nt
9
2
1
5
C
o
u
nt
9
2
1
5
C
o
u
nt
9
2
1
5
C
o
u
nt
9
2
1
5
C
o
u
nt
9
2
1
5
C
o
u
nt
9
2
1
5
C
o
u
nt
9
2
1
5
C
o
u
nt
9
2
1
5
C
o
u
nt
9
2
1
5
C
o
u
nt
9
2
1
5
C
o
n
f
i
d
e
n
c
e
L
#
N
U
M
!
C
o
n
fi
d
e
nc
e
Le
ve
l(
9
#
N
U
M
!
C
o
n
fi
d
e
nc
e
Le
ve
l(
9
#
N
U
M
!
C
o
n
fi
d
e
n
ce
Le
v
el
(9
#
N
U
M
!
C
o
n
fi
d
e
nc
e
Le
ve
l(
9
#
N
U
M
!
C
o
n
fi
d
e
nc
e
Le
ve
l(
9
#
N
U
M
!
C
o
n
fi
d
e
nc
e
Le
ve
l(
9
#
N
U
M
!
C
o
n
fi
d
e
nc
e
Le
ve
l(
9
#
N
U
M
!
C
o
n
fi
d
e
nc
e
Le
ve
l(
9
#
N
U
M
!
C
o
n
fi
d
e
n
ce
Le
v
el
(9
#
N
U
M
!
C
o
n
fi
d
e
nc
e
Le
ve
l(
9
#
N
U
M
!
C
o
n
fi
d
e
n
ce
Le
v
el
(9
#
N
U
M
!
C
o
n
fi
d
e
nc
e
Le
ve
l(
9
#
N
U
M
!
C
o
n
fi
d
e
nc
e
Le
ve
l(
9
#
N
U
M
!
9
5
4
M
i
n
i
m
u
m
2
0
1
7
M
in
i
m
u
m 3
M
in
i
m
u
m 1
M
in
i
m
u
m 1
M
in
i
m
u
m
1
0
M
in
i
m
u
m 1
M
in
i
m
u
m 1
M
in
i
m
u
m 1
M
in
i
m
u
m 0
M
in
i
m
u
m 0
M
in
i
m
u
m 0
M
in
i
m
u
m 0
M
in
i
m
u
m 0
M
in
i
m
u
m 0
M
a
x
i
m
u
m
2
0
1
7
M
ax
i
m
u
m 3
M
ax
i
m
u
m 2
M
ax
i
m
u
m 3
M
ax
i
m
u
m
9
2
M
ax
i
m
u
m 9
M
ax
i
m
u
m 2
M
ax
i
m
u
m 9
M
ax
i
m
u
m 9
M
ax
i
m
u
m 9
M
ax
i
m
u
m
2
2
7
2
9
8
.
5
8
4
M
ax
i
m
u
m
1
9
2
8
2
0
7
.
9
1
8
M
ax
i
m
u
m
2
1
5
8
7
2
9
5
4
M
ax
i
m
u
m
1
2
5
S
u
m
1
8
5
8
6
6
5
5
S
u
m
2
7
,
6
4
5
S
u
m
1
4
,
1
5
9
S
u
m
1
2
,
7
2
1
S
u
m
3
9
2
,
9
5
5
S
u
m
2
3
,
2
8
1
S
u
m
1
0
,
4
3
7
S
u
m
3
7
,
9
7
1
S
u
m
1
3
,
5
9
4
S
u
m
2
2
,
0
7
0
S
u
m
3
4
,
9
3
8
,
9
4
0
.
1
1
4
S
u
m
3
7
2
,
5
7
7
,
2
6
4
.
7
0
9
S
u
m
2
4
,
1
6
3
,
3
4
7
,
9
3
7
.
9
6
6
S
u
m
2
5
,
1
7
9
C
o
u
n
t
9
2
1
5
C
o
u
nt
9
2
1
5
C
o
u
nt
9
2
1
5
C
o
u
nt
9
2
1
5
C
o
u
nt
9
2
1
5
C
o
u
nt
9
2
1
5
C
o
u
nt
9
2
1
5
C
o
u
nt
9
2
1
5
C
o
u
nt
9
2
1
5
C
o
u
nt
9
2
1
5
C
o
u
nt
9
2
1
5
C
o
u
nt
9
2
1
5
C
o
u
nt
9
2
1
5
C
o
u
nt
9
2
1
5
C
o
n
f
i
d
e
n
c
e
L
#
N
U
M
!
C
o
n
fi
d
e
nc
e
Le
ve
l(
9
#
N
U
M
!
C
o
n
fi
d
e
nc
e
Le
ve
l(
9
#
N
U
M
!
C
o
n
fi
d
e
n
ce
Le
v
el
(9
#
N
U
M
!
C
o
n
fi
d
e
nc
e
Le
ve
l(
9
#
N
U
M
!
C
o
n
fi
d
e
nc
e
Le
ve
l(
9
#
N
U
M
!
C
o
n
fi
d
e
nc
e
Le
ve
l(
9
#
N
U
M
!
C
o
n
fi
d
e
nc
e
Le
ve
l(
9
#
N
U
M
!
C
o
n
fi
d
e
nc
e
Le
ve
l(
9
#
N
U
M
!
C
o
n
fi
d
e
n
ce
Le
v
el
(9
#
N
U
M
!
C
o
n
fi
d
e
nc
e
Le
ve
l(
9
#
N
U
M
!
C
o
n
fi
d
e
n
ce
Le
v
el
(9
#
N
U
M
!
C
o
n
fi
d
e
nc
e
Le
ve
l(
9
#
N
U
M
!
C
o
n
fi
d
e
nc
e
Le
ve
l(
9
#
N
U
M
!
e
v
e
l
(
9
5
.
0
%
)
5.
0
%
)
5.
0
%
)
5.
0
%
)
5.
0
%
)
5.
0
%
)
5.
0
%
)
5.
0
%
)
5.
0
%
)
5.
0
%
)
5.
0
%
)
5.
0
%
)
5.
0
%
)
5.
0
%
)
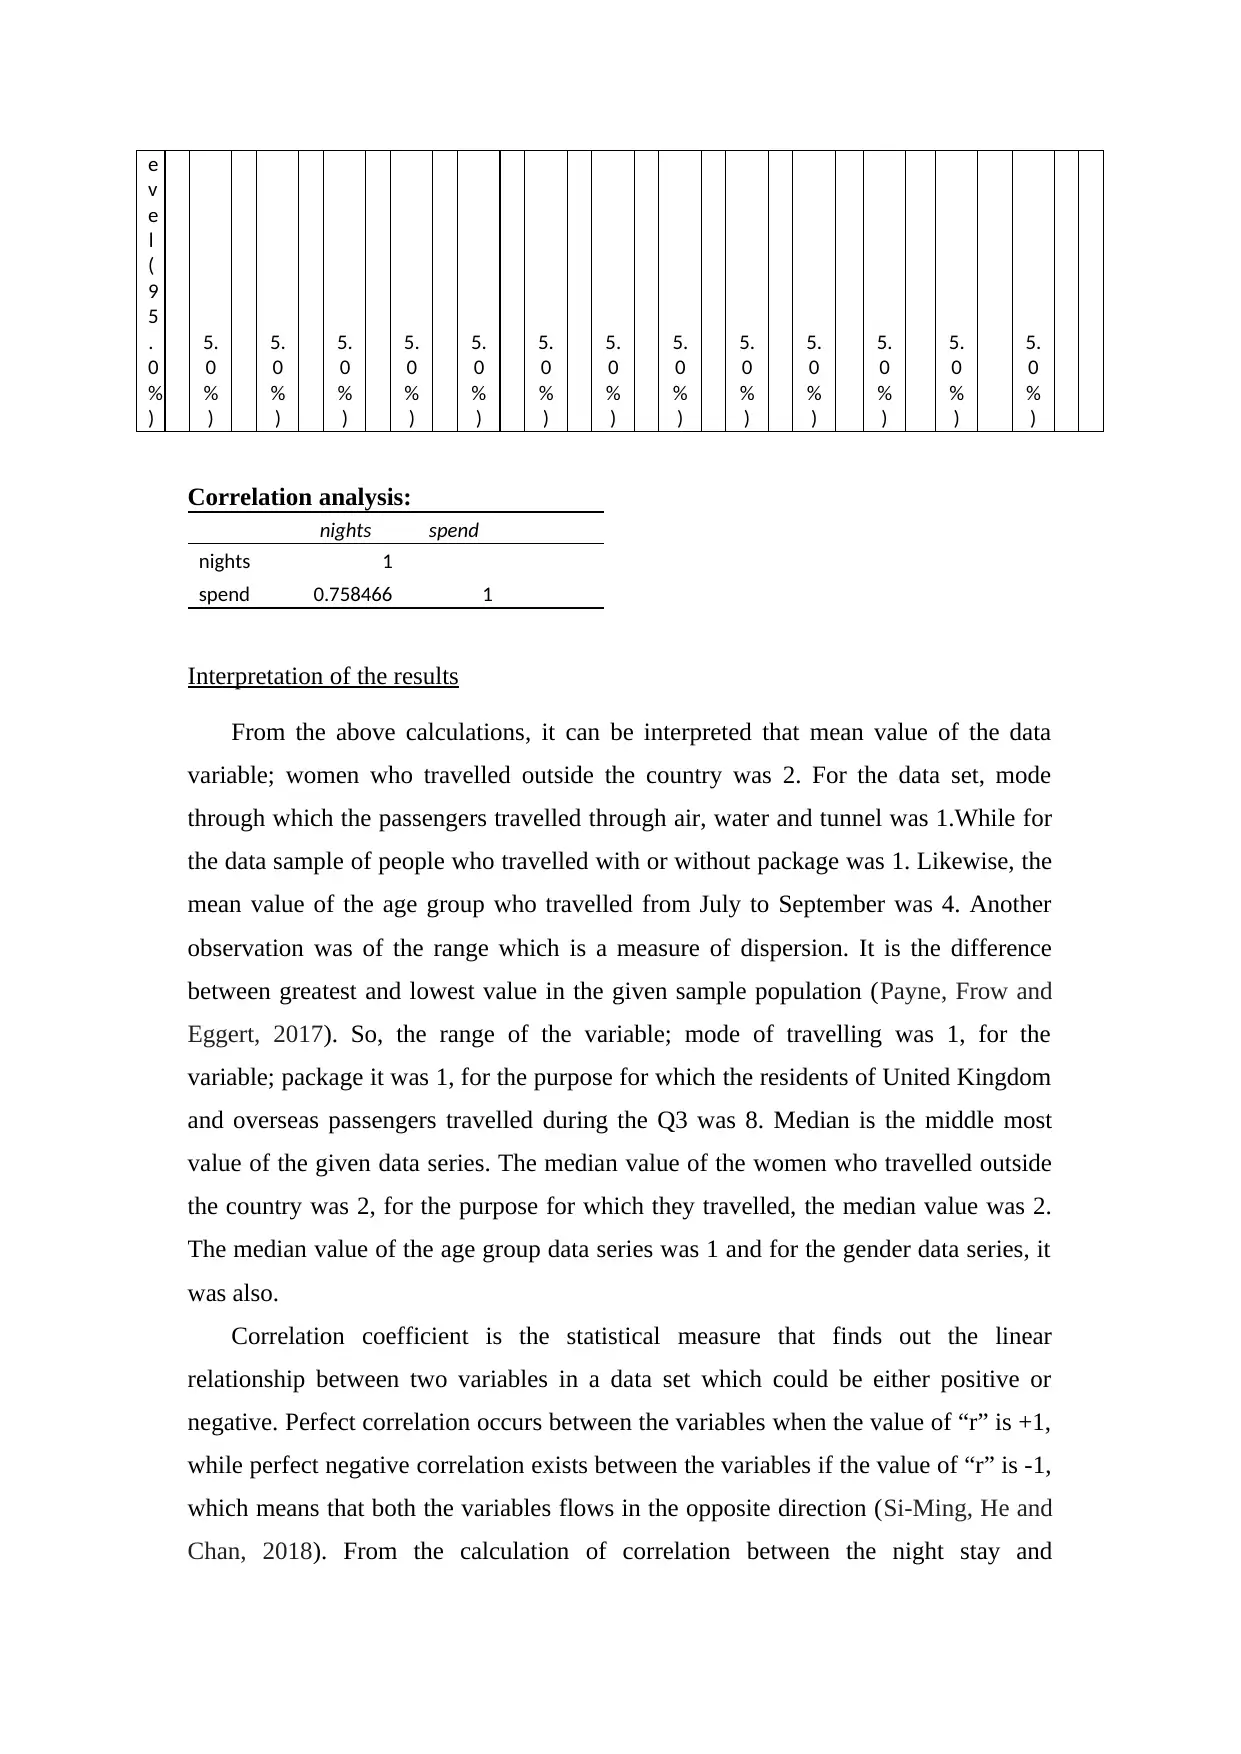
Correlation analysis:
nights spend
nights 1
spend 0.758466 1
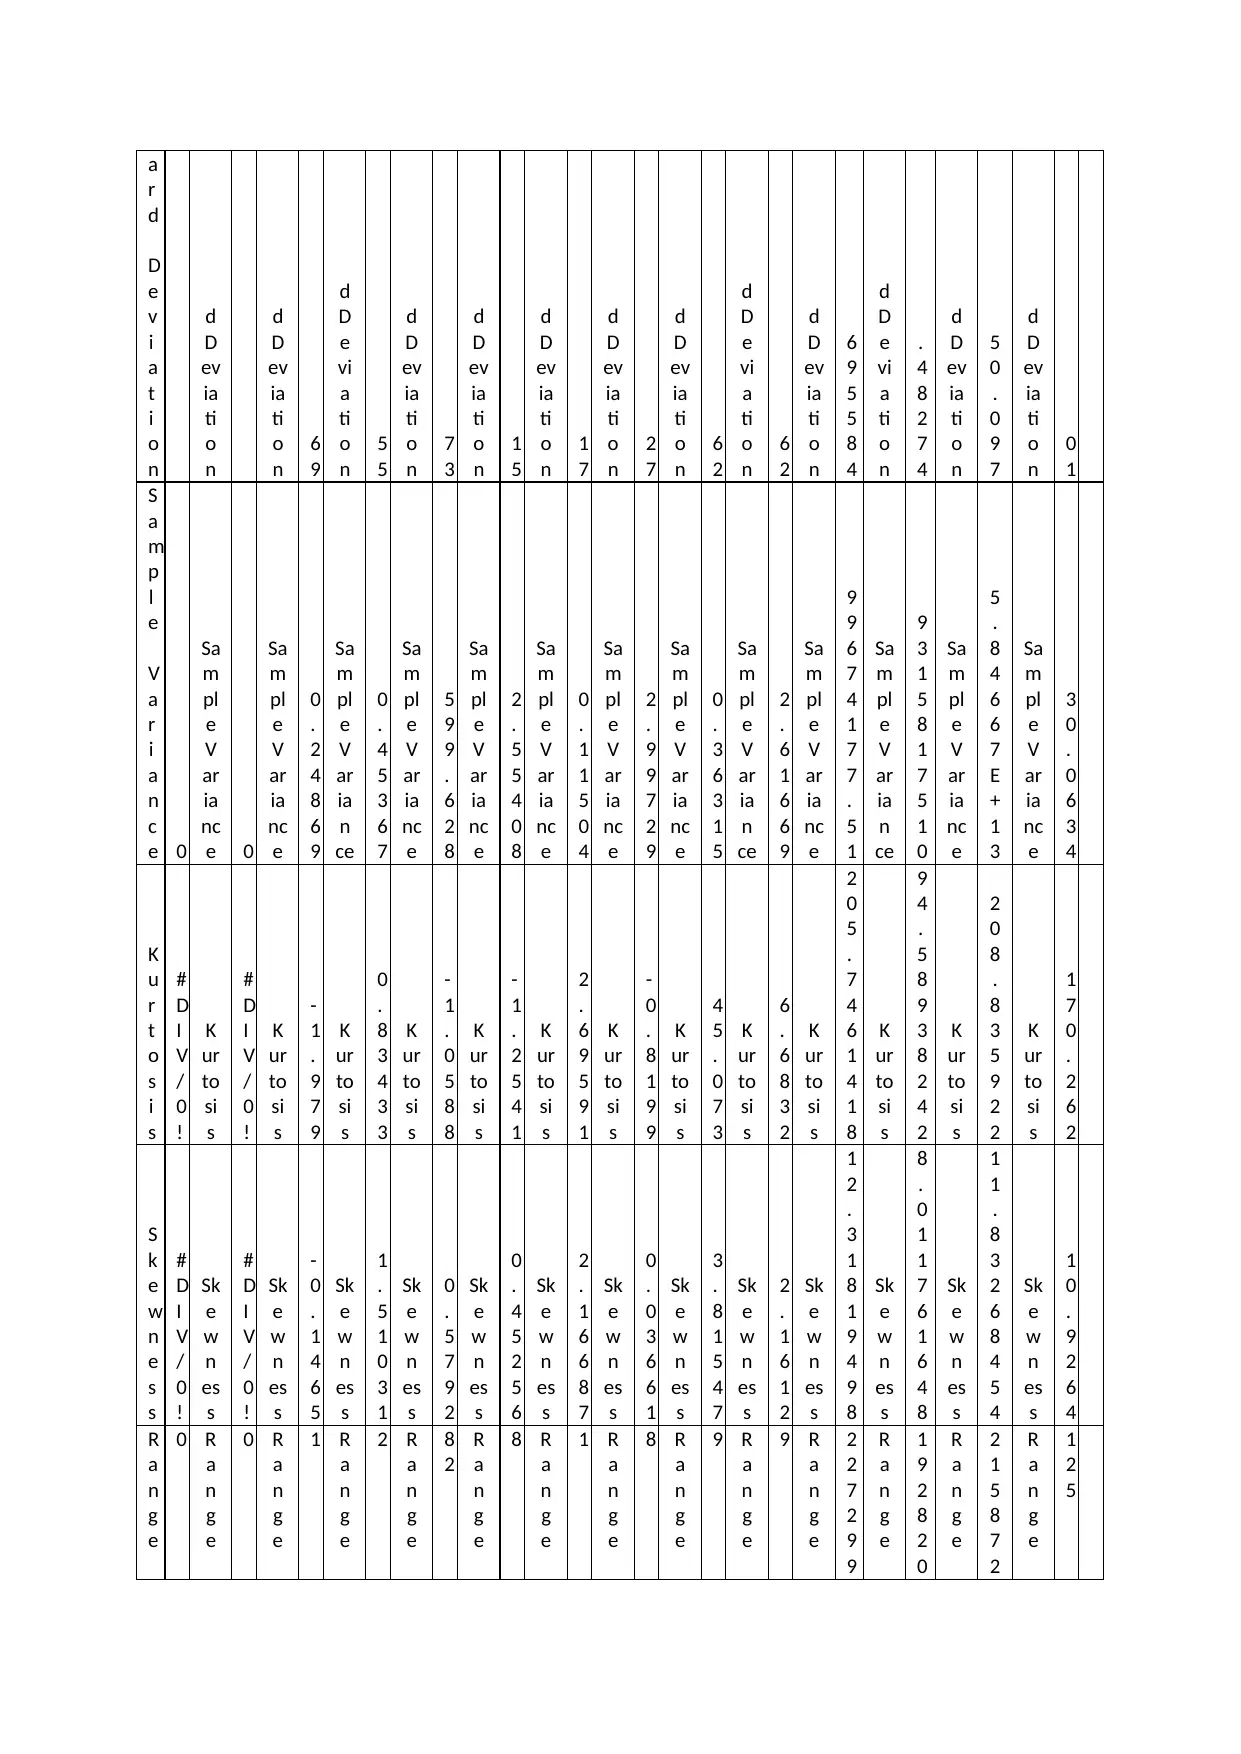
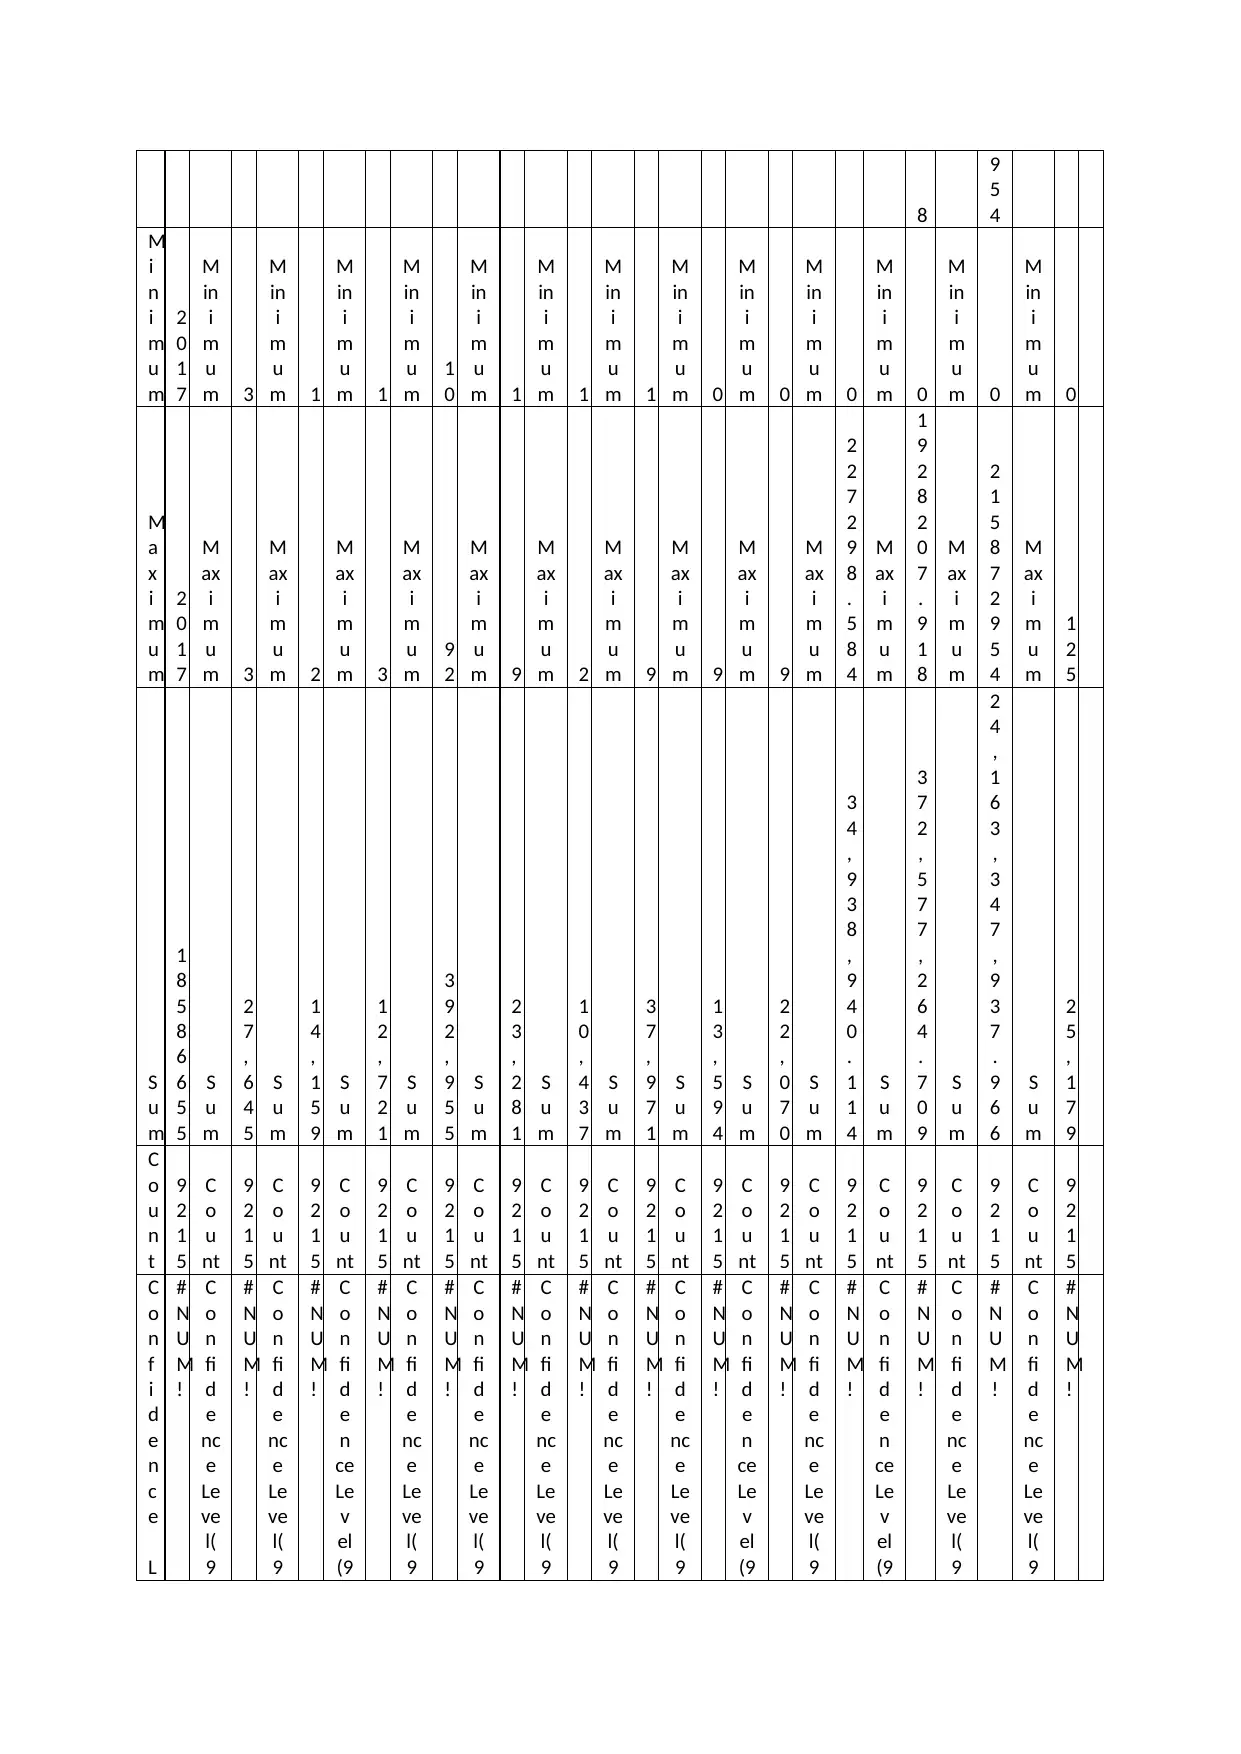
Interpretation of the results
From the above calculations, it can be interpreted that mean value of the data
variable; women who travelled outside the country was 2. For the data set, mode
through which the passengers travelled through air, water and tunnel was 1.While for
the data sample of people who travelled with or without package was 1. Likewise, the
mean value of the age group who travelled from July to September was 4. Another
observation was of the range which is a measure of dispersion. It is the difference
between greatest and lowest value in the given sample population (Payne, Frow and
Eggert, 2017). So, the range of the variable; mode of travelling was 1, for the
variable; package it was 1, for the purpose for which the residents of United Kingdom
and overseas passengers travelled during the Q3 was 8. Median is the middle most
value of the given data series. The median value of the women who travelled outside
the country was 2, for the purpose for which they travelled, the median value was 2.
The median value of the age group data series was 1 and for the gender data series, it
was also.
Correlation coefficient is the statistical measure that finds out the linear
relationship between two variables in a data set which could be either positive or
negative. Perfect correlation occurs between the variables when the value of “r” is +1,
while perfect negative correlation exists between the variables if the value of “r” is -1,
which means that both the variables flows in the opposite direction (Si-Ming, He and
Chan, 2018). From the calculation of correlation between the night stay and
v
e
l
(
9
5
.
0
%
)
5.
0
%
)
5.
0
%
)
5.
0
%
)
5.
0
%
)
5.
0
%
)
5.
0
%
)
5.
0
%
)
5.
0
%
)
5.
0
%
)
5.
0
%
)
5.
0
%
)
5.
0
%
)
5.
0
%
)
Correlation analysis:
nights spend
nights 1
spend 0.758466 1
Interpretation of the results
From the above calculations, it can be interpreted that mean value of the data
variable; women who travelled outside the country was 2. For the data set, mode
through which the passengers travelled through air, water and tunnel was 1.While for
the data sample of people who travelled with or without package was 1. Likewise, the
mean value of the age group who travelled from July to September was 4. Another
observation was of the range which is a measure of dispersion. It is the difference
between greatest and lowest value in the given sample population (Payne, Frow and
Eggert, 2017). So, the range of the variable; mode of travelling was 1, for the
variable; package it was 1, for the purpose for which the residents of United Kingdom
and overseas passengers travelled during the Q3 was 8. Median is the middle most
value of the given data series. The median value of the women who travelled outside
the country was 2, for the purpose for which they travelled, the median value was 2.
The median value of the age group data series was 1 and for the gender data series, it
was also.
Correlation coefficient is the statistical measure that finds out the linear
relationship between two variables in a data set which could be either positive or
negative. Perfect correlation occurs between the variables when the value of “r” is +1,
while perfect negative correlation exists between the variables if the value of “r” is -1,
which means that both the variables flows in the opposite direction (Si-Ming, He and
Chan, 2018). From the calculation of correlation between the night stay and
⊘ This is a preview!⊘
Do you want full access?
Subscribe today to unlock all pages.
Trusted by 1+ million students worldwide
expenditure, it was found out that a positive correlation exists between the two
variables in the given big data of the tour operator TravelPac. This shows that both the
variables flows in the same direction.
Standard deviation of the data series country was 24.48 while for the purpose of
travelling , it was 1.59, for travelling package it was 0.339. The standard deviation is
the dispersion measure which shows the degree of dispersion or variability between
the values of the data series.
Recommendations
By observing and analyzing the data of TravelPac, some suggestions is provided
to the marketing manager of the Expat Explore Travel regarding the target segment
they should focus on. It was found out from the analysis that people of the age group
16-34 were highest population that travelled the places inside and outside the country
mainly for the purpose of holiday and meeting relatives, friends and family. The
marketing manager of Expat Explore is advised to focus on this age group and shall
target this segment of the market.As the travelers in this age group are young, the tour
operator shall customize its products and services which has the potential of meeting
the expectations and preferences of this target group(Mikalef and et.al., 2017). For
example, the tour operator shall make its products and services highly cost effective
which could help in attracting the attention of the vacationers and travelers. It can
more of the adventurous and fun related activities in its holiday packages which are
the things generally asked by the customers of this age group.
Convenience of getting every thing at just one click is one factor that could help
the marketing manager in attracting and enlarging its customer base (Miah and et.al.,
2017). The tour operator shall provide its services on the online platform such as
bookings will add to the experience of the customers. Moreover, it could employ
some technology in its daily operations such as AI applications in the customer
support management. It will help it in managing its client relationship more
effectively. Further, it is suggested to the travel company tat it shall provide some ad-
hoc services, meaning of which is some on the spot services to the customers above
than the standard products and services offered by the Expat Explore Travel. If the
travel company would be able to pull off the needs, requirements and expectations of
the suggested target segment of the market, then it would be able to create a loyal
customer base for itself which would result into long term stability and profitability
Paraphrase This Document
Need a fresh take? Get an instant paraphrase of this document with our AI Paraphraser

and a larger market share in the tourism industry of United Kingdom in the
future(Horner and Swarbrooke, 2016).
CONCLUSION
From the above study, it can be summarized that big and unstructured data is one
of the necessity of the business houses for their decision making.It is important to the
organizations as analysis of big data helps in finding out some trends that could
significantly affects the marketing strategies which further could decide the fate of the
companies. The study highlighted the analysis of the data of TravelPac with the help
of descriptive statistical tool through which mean, mode, median, standard deviation,
correlation, range was calculated. After the analysis, it was recommended to the
marketing manager of the Expat Explore Travel that it should target the customers
belonging to the age group of 16-34 because they constituted to be the highest number
of travelers that travelled in the Q3 of the year 2017.
REFERENCES
Books and Journals
Yin, S. and Kaynak, O., 2015. Big data for modern industry: challenges and trends
[point of view]. Proceedings of the IEEE. 103(2). pp.143-146.
Cao, G., Duan, Y. and Li, G., 2015. Linking business analytics to decision making
effectiveness: A path model analysis. IEEE Transactions on Engineering
Management. 62(3). pp.384-395.
Mikalef, P and et.al., 2017, July. Big Data Analytics Capability: Antecedents and
Business Value. In PACIS (p. 136).
Fernando, F. and Engel, T., 2018. Big Data and Business Analytic Concepts: A
Literature Review.
Miah, S.J and et.al., 2017. A big data analytics method for tourist behaviour
analysis. Information & Management. 54(6).pp.771-785.
George, D. and Mallery, P., 2016. Descriptive statistics. In IBM SPSS Statistics 23
Step by Step (pp. 126-134). Routledge.
Cox, D.R., 2018. Applied statistics-principles and examples. Routledge.
Dean, S. and Illowsky, B., 2018. Descriptive statistics: skewness and the mean,
median, and mode. Connexions website.
Si-Ming, L., He, S. and Chan, K.W., 2018. Data and descriptive statistics.
In Changing China: Migration, Communities and Governance in Cities (pp. 78-81).
Routledge.
Horner, S. and Swarbrooke, J., 2016. Consumer behaviour in tourism. Routledge.
Payne, A., Frow, P. and Eggert, A., 2017. The customer value proposition: evolution,
development, and application in marketing. Journal of the Academy of Marketing
Science. 45(4). pp.467-489.
Online
Techniques and Tools to Help You Make Business Decisions.2017. [Online]. Available
through <https://www.businessnewsdaily.com/6162-decision-making.html>
⊘ This is a preview!⊘
Do you want full access?
Subscribe today to unlock all pages.
Trusted by 1+ million students worldwide
1 out of 13
Related Documents


Your All-in-One AI-Powered Toolkit for Academic Success.
+13062052269
info@desklib.com
Available 24*7 on WhatsApp / Email
![[object Object]](/_next/static/media/star-bottom.7253800d.svg)
Unlock your academic potential
Copyright © 2020–2026 A2Z Services. All Rights Reserved. Developed and managed by ZUCOL.