Data Analysis Report: Pixystems Toys Project, Big Data Analysis, 2019
VerifiedAdded on 2022/09/28
|13
|1925
|26
Report
AI Summary
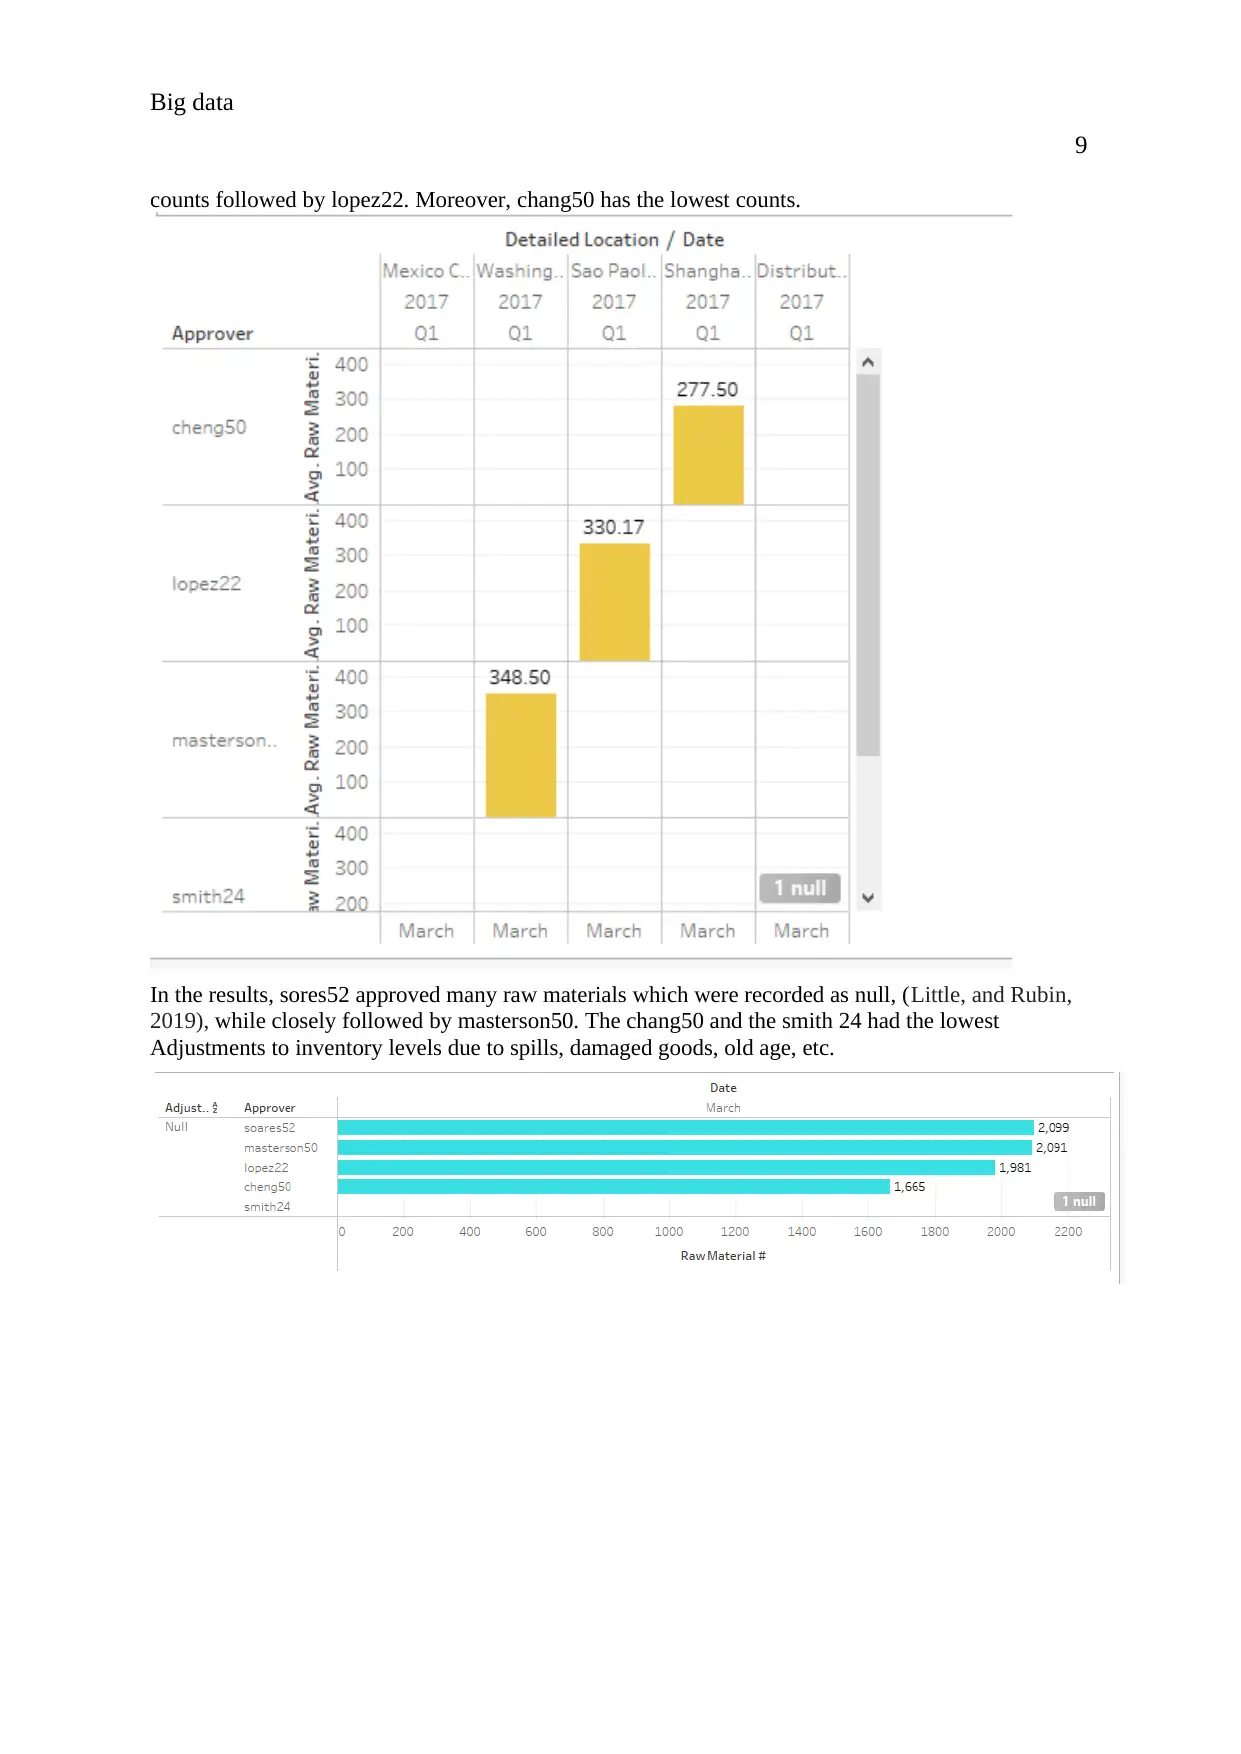
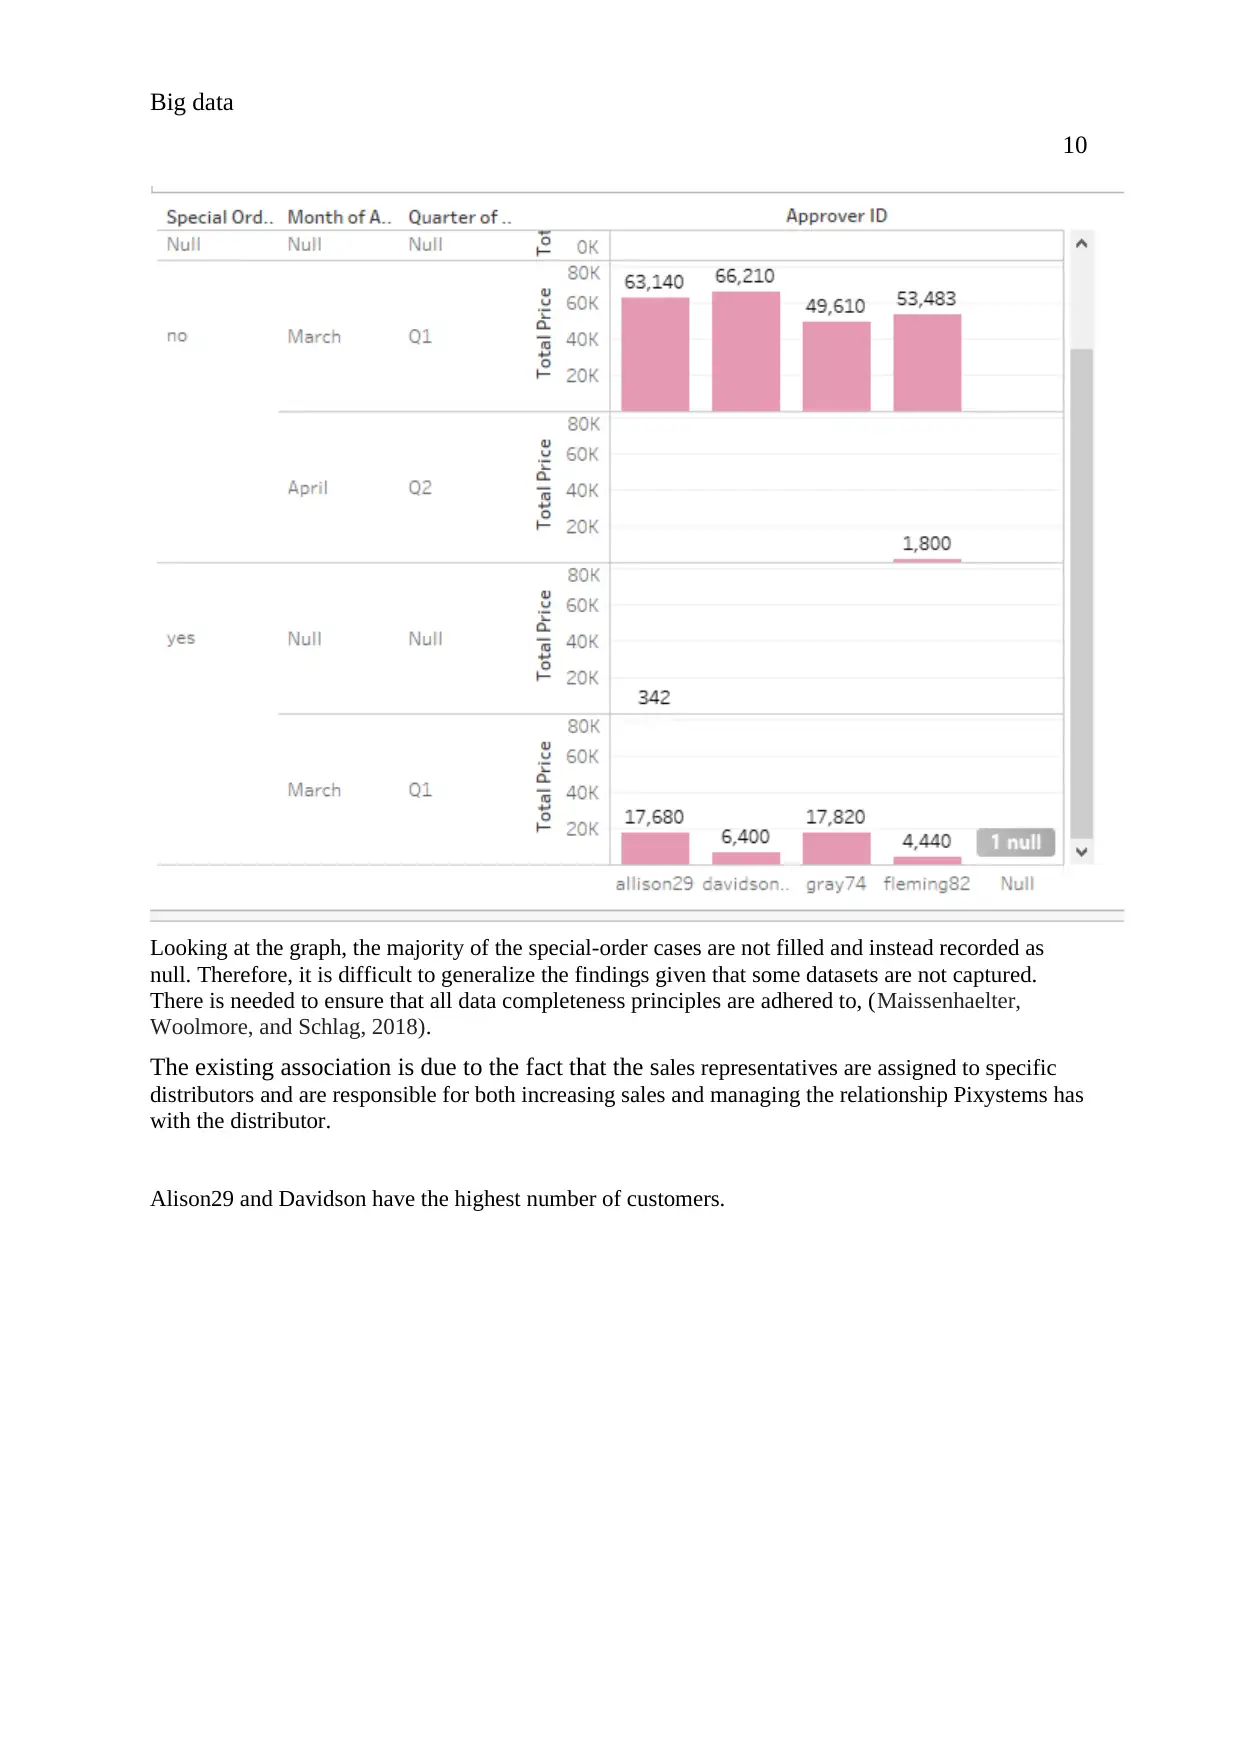
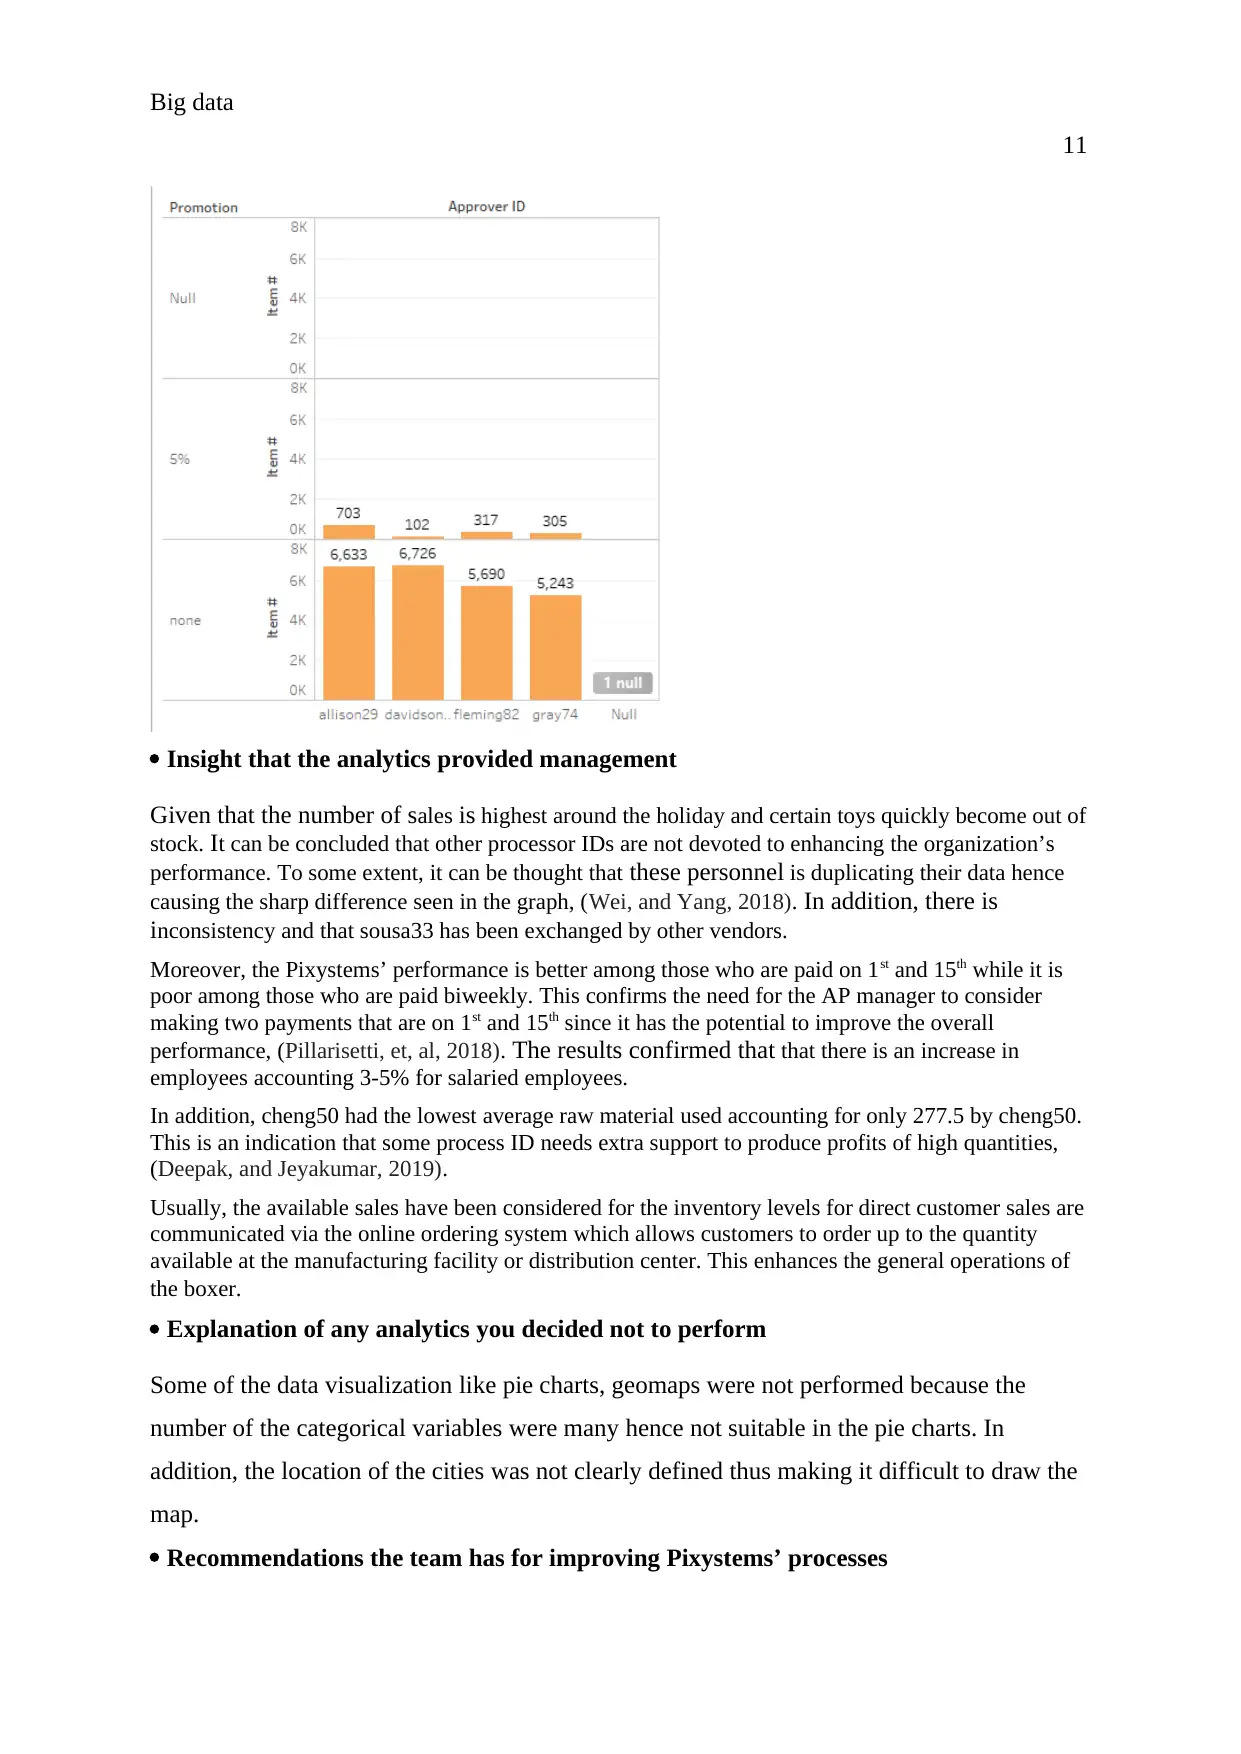
This report presents a comprehensive analysis of Pixystems Toys' data, examining various aspects of its operations, including sales, payroll, and inventory management. The analysis reveals several key findings, such as inconsistencies in invoice numbers, payment amounts, and payment types, which affect the ability to predict trends. The report highlights the impact of holidays on sales, with peak sales occurring during these periods. It also assesses employee performance and payroll processes, identifying differences between salaried and hourly employees. Furthermore, the analysis delves into inventory management, revealing discrepancies in finished goods and raw material usage across different manufacturing facilities. The report offers recommendations for improving Pixystems' processes, including the need for a system to capture all invoice numbers, maintaining a reliable shipping system, and capturing all prices to avoid losses. It also suggests system controls, such as developing a system for capturing invoice numbers and ensuring all workers are paid on an hourly basis. The report concludes by identifying areas for follow-up, such as analyzing sales during specific holidays, and obtaining data on taxable income to generate revenue after deducting tax.

Big data
1
<University>
Big data
<Author>
31 August 2024
<Professor’s name>
<Program of Study>
1
<University>
Big data
<Author>
31 August 2024
<Professor’s name>
<Program of Study>
Secure Best Marks with AI Grader
Need help grading? Try our AI Grader for instant feedback on your assignments.

Big data
2
Results of the analytics performed along with the rational for performing and
assumptions made
From the results, it is observed that not all customers do receive their invoice number as demonstrated
in the line graph below with 8 null invoice numbers. As a result, payment of the customers in one way
or the other is affected due to the missing invoice numbers.
Furthermore, there is inconsistent when it comes to the payment amount, payment type and processor
ID and this makes the general prediction of the trend difficult. For example, Wire as a means of
payment type is least used by the customers as compared to ACH and check methods. To note, tang78
and sousa33 are doing well in ACH and check payment types.

Big data
3
The analysis in the line chart below confirms the inconsistency of the total price and date at which the
goods ordered. In fact, it is not easy to predict the total price with these kinds of representation,
(DeAngelis, 2018). The highest peak with the total price occurs during holidays when people are free
and can make more orders than during workdays.

Big data
4
In the above findings, tang78 and sousa33 had the highest payment amount in ACH and check
respectively. However, in the drawn horizontal graph, tang78 still leads in the ACH payment type
while sousa33 becomes second in ACH but not check as earlier identified.
According to the results, all the payments that were promised to have been met within the same year.
For example, on 24th and 25th April 2017, all the promised payments were made. This shows that
timely payments are being done in the company.
By drawing the histogram below, it confirms that most employees working at headquarters and
managers at the manufacturing locations are salary employees and not entitled to overtime (twice
hourly rate) payments.
Secure Best Marks with AI Grader
Need help grading? Try our AI Grader for instant feedback on your assignments.

Big data
5
Payroll is paid to salaried employees on the 1st and 15th of each month through direct deposit.
Hourly employees are paid bi-weekly (every two weeks). This finding is demonstrated in the
horizontal chart below.
In addition, analysis results show that overall performance ranking is high among the 1st and 15th
payments but low in the bi-weekly salaries. However, there is one case that is recorded as null and
this affects data quality as well.

Big data
6
The total percentage for the annual employee pays among the hourly rates employees accounted for
13% as compared to that of salaried employees accounting for the 227%, (Sorensen, 2019).
There are 4 cases on finished goods with missing values. Only distribution on center has both the total
prices and the finished goods while the rest of the plants have the same value of the total prices,
(Hugos, 2018).

Big data
7
Moreover, Soares52 established that the finished goods inventory is owned by the manufacturing
facility until loaded on a truck (FOB Shipping Point) to a distributor or sent to the flagship store
which then takes ownership followed by 348.5. In addition, cheng50 had the lowest average raw
material used accounting for only 277.5 by cheng50.
Paraphrase This Document
Need a fresh take? Get an instant paraphrase of this document with our AI Paraphraser

Big data
8
It seems that there are no many variations on the online sales by manufacturing facility indicating that
the range of quantity differences are small except the Shangai plant which tends to lead in the online
sales.
Moreover, the physical inventory is taken once a year and the completion of cycle counts is at the
discretion of the facility manager. From the results, Masterson has the highest completion of cycle

Big data
9
counts followed by lopez22. Moreover, chang50 has the lowest counts.
In the results, sores52 approved many raw materials which were recorded as null, (Little, and Rubin,
2019), while closely followed by masterson50. The chang50 and the smith 24 had the lowest
Adjustments to inventory levels due to spills, damaged goods, old age, etc.

Big data
10
Looking at the graph, the majority of the special-order cases are not filled and instead recorded as
null. Therefore, it is difficult to generalize the findings given that some datasets are not captured.
There is needed to ensure that all data completeness principles are adhered to, (Maissenhaelter,
Woolmore, and Schlag, 2018).
The existing association is due to the fact that the sales representatives are assigned to specific
distributors and are responsible for both increasing sales and managing the relationship Pixystems has
with the distributor.
Alison29 and Davidson have the highest number of customers.
Secure Best Marks with AI Grader
Need help grading? Try our AI Grader for instant feedback on your assignments.

Big data
11
Insight that the analytics provided management
Given that the number of sales is highest around the holiday and certain toys quickly become out of
stock. It can be concluded that other processor IDs are not devoted to enhancing the organization’s
performance. To some extent, it can be thought that these personnel is duplicating their data hence
causing the sharp difference seen in the graph, (Wei, and Yang, 2018). In addition, there is
inconsistency and that sousa33 has been exchanged by other vendors.
Moreover, the Pixystems’ performance is better among those who are paid on 1st and 15th while it is
poor among those who are paid biweekly. This confirms the need for the AP manager to consider
making two payments that are on 1st and 15th since it has the potential to improve the overall
performance, (Pillarisetti, et, al, 2018). The results confirmed that that there is an increase in
employees accounting 3-5% for salaried employees.
In addition, cheng50 had the lowest average raw material used accounting for only 277.5 by cheng50.
This is an indication that some process ID needs extra support to produce profits of high quantities,
(Deepak, and Jeyakumar, 2019).
Usually, the available sales have been considered for the inventory levels for direct customer sales are
communicated via the online ordering system which allows customers to order up to the quantity
available at the manufacturing facility or distribution center. This enhances the general operations of
the boxer.
Explanation of any analytics you decided not to perform
Some of the data visualization like pie charts, geomaps were not performed because the
number of the categorical variables were many hence not suitable in the pie charts. In
addition, the location of the cities was not clearly defined thus making it difficult to draw the
map.
Recommendations the team has for improving Pixystems’ processes

Big data
12
There is the need for the AP managers to ensure that all the processing individuals see to it that all
transactions have an invoice number to reduce losses. This is because of the missing invoice
numbers witnessed in the dataset.
Based on this finding, the AP managers can do a benchmarking on the leading individuals and the
lessons learned to be scaled up to other processors’ IDs to enhance organization’s reputation. In
addition, there is need for the AP managers to strive their best to maintain a reliable shipping system
so that goods reached the various destination without delay.
There is the need for the AP managers to continue emphasizing why all the promises are as far as the
payments are concerned should be adhered to keep trust from the customers, (Goodman, 2019).
Moreover, there is a need for the management to ensure that all the prices are captured to avoid
incurred losses, (Kletz, and Amyotte, 2019). The management should adopt other promotional
activities to increase the value of the total process. Furthermore, the management needs to conduct
an exchange program to find out why some processes IDs have the highest completion of cycle counts
than others.
Overview of any other issues that Pixystems should follow-up on
The Pixystems should follow-up on which specific holidays like Christmas, Easter or public
holidays are having highest turnover when it comes to the sales received.
Recommendations on system controls that could be put in place
There is need to develop a system that will capture all the invoices numbers and that no
processes can be completed like processor ID without filling the invoice number for the
customers. Moreover, the management need to work in close especially with the best
performer employees so that lessons learnt can be spread to other employees to improve
general performance. Moreover, there is a need to ensure that all other workers are paid on an
hourly basis and this can be made possible by developing an efficient system for payroll.
Any other data you would like to have obtained from Pixystems
Data on taxable Income so that revenues can be generated after deducting tax to make
decisions on how much revenue is generated per processor ID.

Big data
13
References
DeAngelis, D.L., 2018. Individual-based models and approaches in ecology: populations,
communities, and ecosystems. CRC Press.
Deepak, R.K.A. and Jeyakumar, S., 2019. Marketing management. Education Publishing.
Goodman, J., 2019. Strategic customer service: Managing the customer experience to increase
positive word of mouth, build loyalty, and maximize profits. Amazon.
Hugos, M.H., 2018. Essentials of supply chain management. John Wiley & Sons.
Kletz, T. and Amyotte, P., 2019. What went wrong?: case histories of process plant disasters and how
they could have been avoided. Butterworth-Heinemann.
Little, R.J. and Rubin, D.B., 2019. Statistical analysis with missing data (Vol. 793). John Wiley &
Sons.
Maissenhaelter, B.E., Woolmore, A.L. and Schlag, P.M., 2018. Real-world evidence research based
on big data. Der Oncology, 24(2), pp.91-98.
Pillarisetti, A., Gill, M., Allen, T., Madhavan, S., Dhongade, A., Ghorpade, M., Roy, S.,
Balakrishnan, K., Juvekar, S. and Smith, K.R., 2018. A low-cost stove use monitor to enable
conditional cash transfers. EcoHealth, 15(4), pp.768-776.
Sorensen, E., 2019. Comparable worth: Is it a worthy policy? (Vol. 5266). Princeton university press.
Wei, L. and Yang, Y., 2018. Development trend of sharing economy in the big data era based on
duplication dynamic evolution game theory. Cluster Computing, pp.1-9.
1 out of 13

Your All-in-One AI-Powered Toolkit for Academic Success.
+13062052269
info@desklib.com
Available 24*7 on WhatsApp / Email
Unlock your academic potential
© 2024 | Zucol Services PVT LTD | All rights reserved.