ITECH1103 Big Data: Crime Data Analysis Report in Chicago
VerifiedAdded on 2023/06/08
|10
|1614
|63
Report
AI Summary
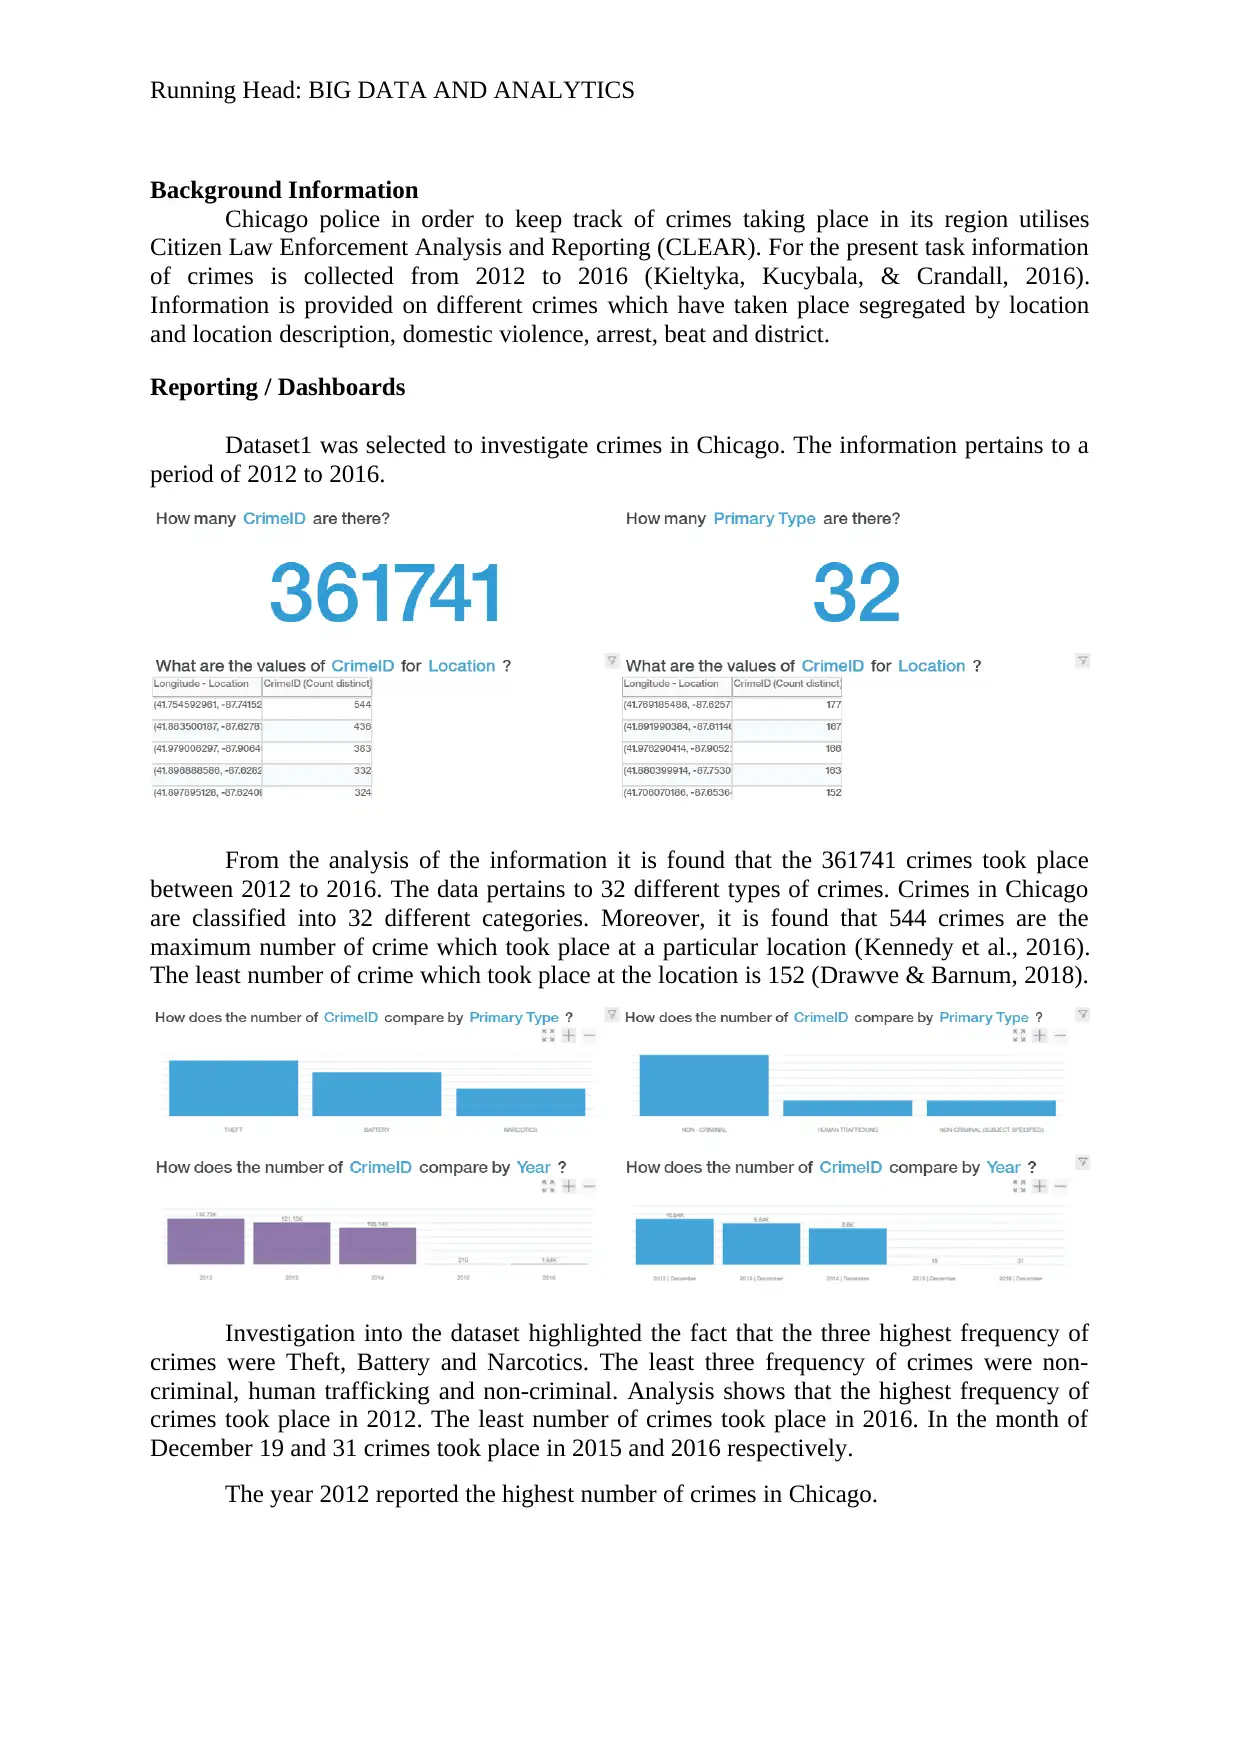
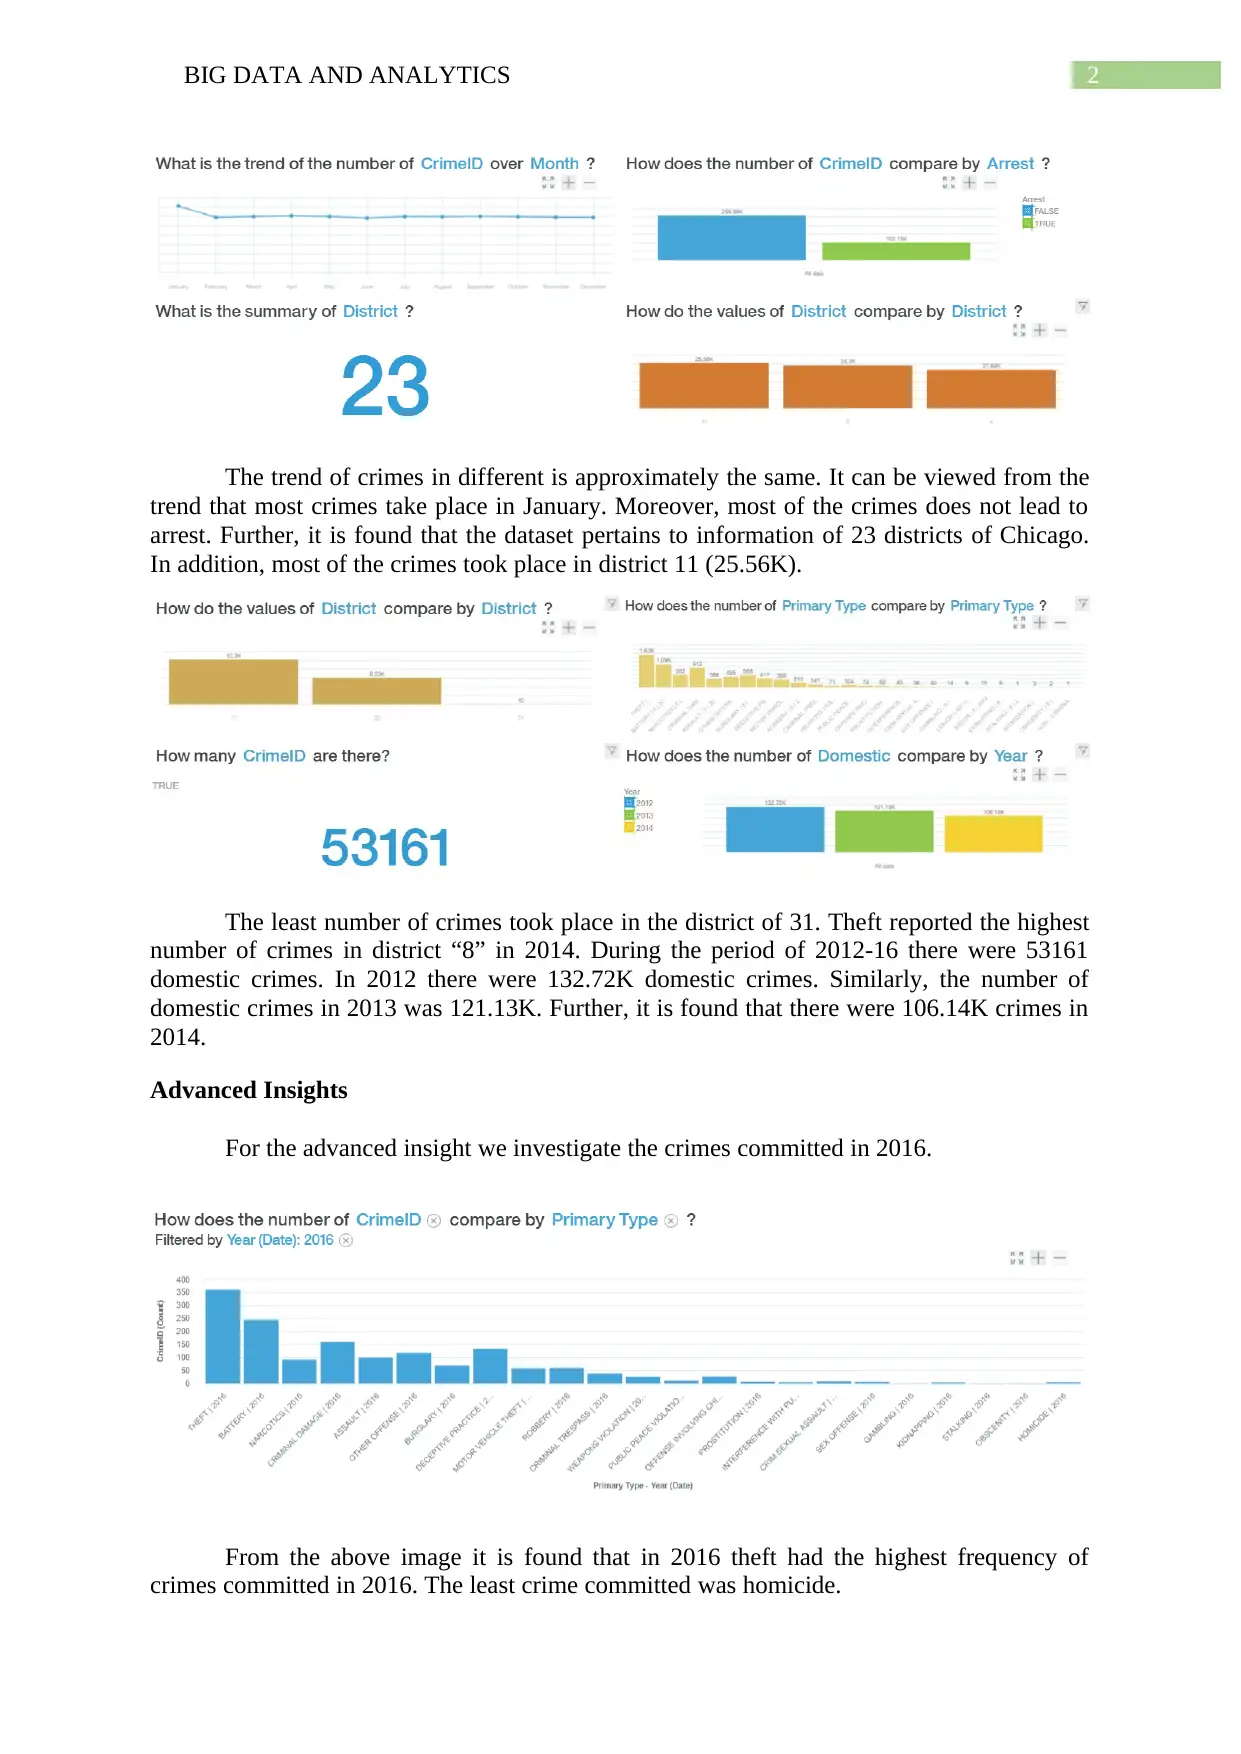
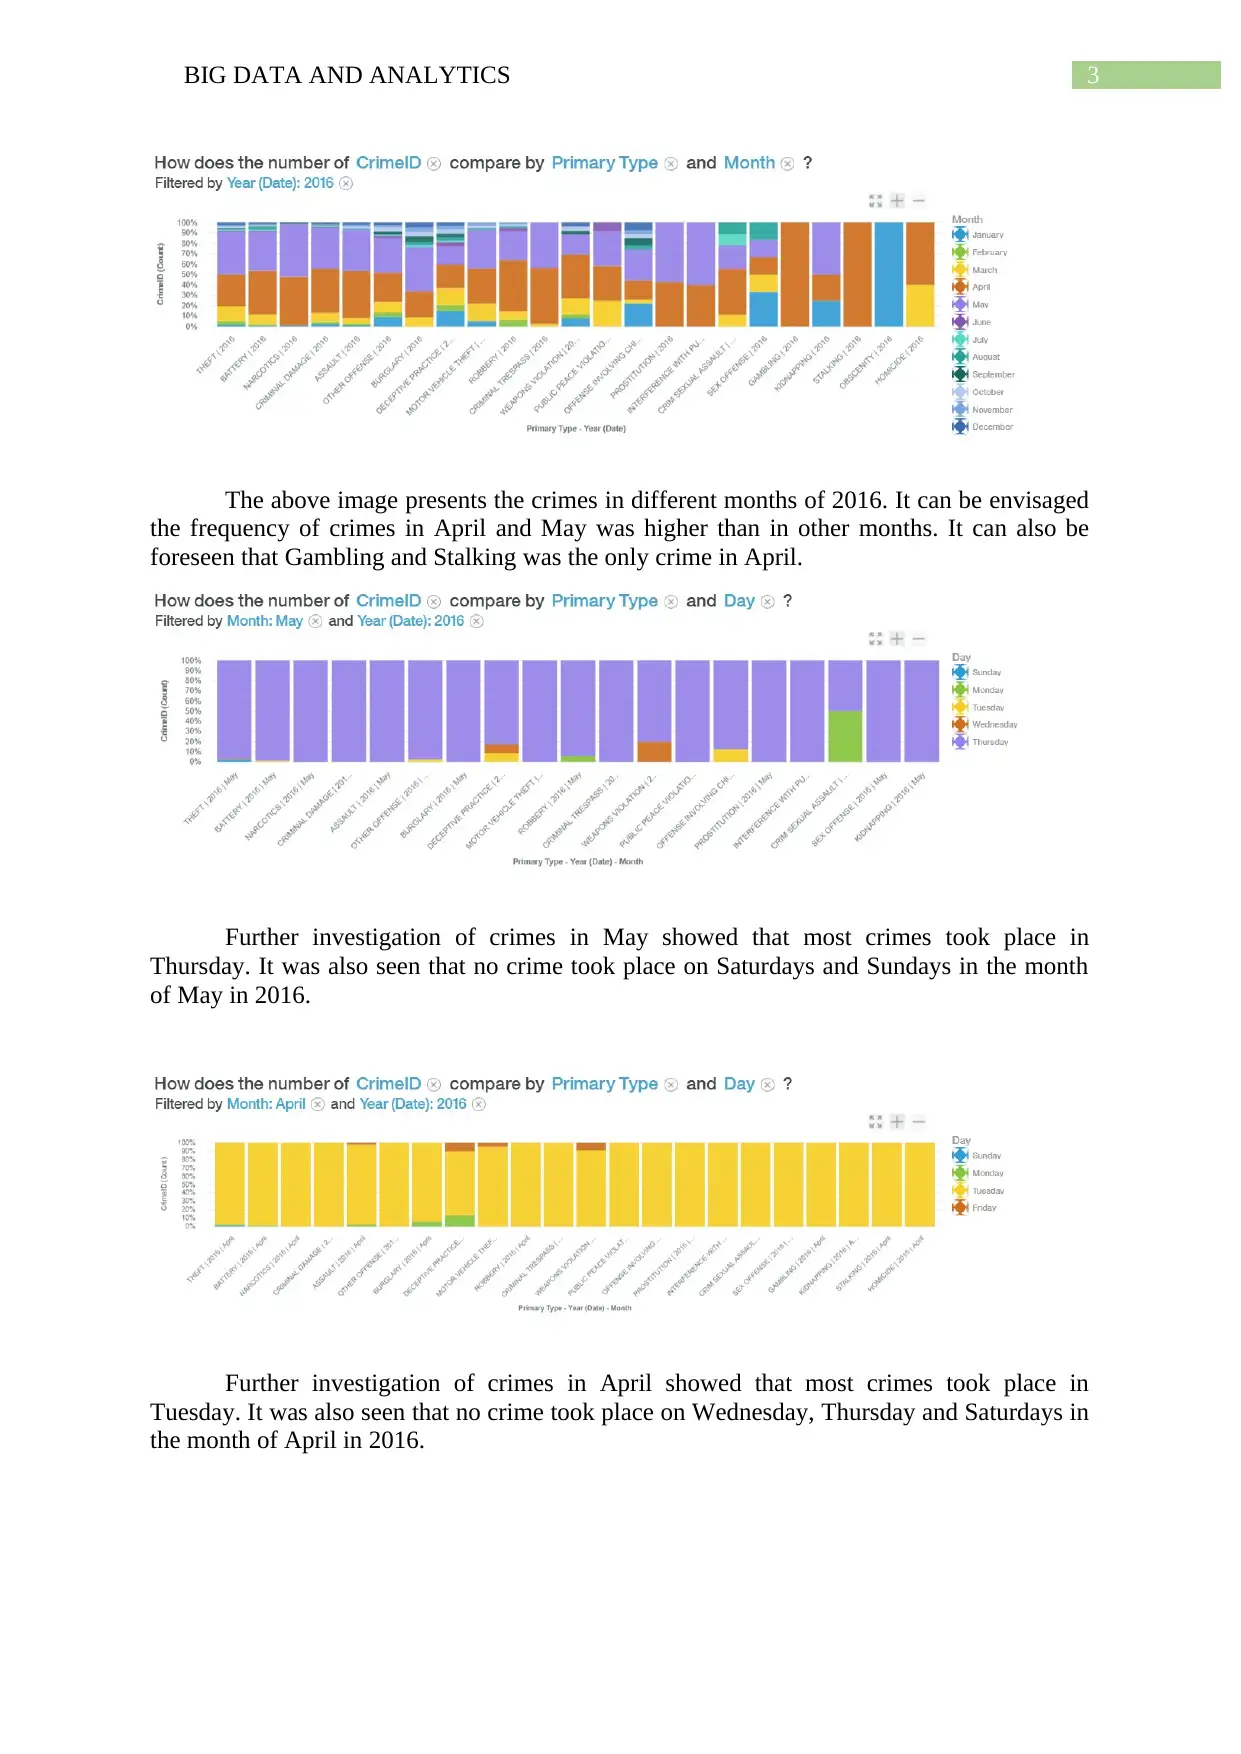
This report analyzes crime data in Chicago from 2012 to 2016 using big data analytics. The analysis identifies trends in crime types, locations, and times, using data from Citizen Law Enforcement Analysis and Reporting (CLEAR). Key findings include the prevalence of theft, battery, and narcotics offenses, with higher crime rates in districts 11, 8, and 4. The report recommends increased police vigilance in these high-crime areas and during peak months like January. Various visualization techniques, such as bar charts and line charts, are employed to present the data effectively. The report also reflects on the challenges and benefits of using IBM Watson Analytics for crime data analysis. Desklib provides access to this and other solved assignments to aid students.
Contribute Materials
Your contribution can guide someone’s learning journey. Share your
documents today.

Running Head: BIG DATA AND ANALYTICS
Big Data and Analytics
Name of the Student:
Name of the University:
Course ID:
Big Data and Analytics
Name of the Student:
Name of the University:
Course ID:
Secure Best Marks with AI Grader
Need help grading? Try our AI Grader for instant feedback on your assignments.

1BIG DATA AND ANALYTICS
Table of Contents
Background Information............................................................................................................1
Reporting / Dashboards..............................................................................................................1
Advanced Insights......................................................................................................................2
Research.....................................................................................................................................4
Recommendations for POLICE CHIEF.....................................................................................6
Cover letter.................................................................................................................................6
The Reflection............................................................................................................................7
Reference....................................................................................................................................8

Running Head: BIG DATA AND ANALYTICS
Background Information
Chicago police in order to keep track of crimes taking place in its region utilises
Citizen Law Enforcement Analysis and Reporting (CLEAR). For the present task information
of crimes is collected from 2012 to 2016 (Kieltyka, Kucybala, & Crandall, 2016).
Information is provided on different crimes which have taken place segregated by location
and location description, domestic violence, arrest, beat and district.
Reporting / Dashboards
Dataset1 was selected to investigate crimes in Chicago. The information pertains to a
period of 2012 to 2016.
From the analysis of the information it is found that the 361741 crimes took place
between 2012 to 2016. The data pertains to 32 different types of crimes. Crimes in Chicago
are classified into 32 different categories. Moreover, it is found that 544 crimes are the
maximum number of crime which took place at a particular location (Kennedy et al., 2016).
The least number of crime which took place at the location is 152 (Drawve & Barnum, 2018).
Investigation into the dataset highlighted the fact that the three highest frequency of
crimes were Theft, Battery and Narcotics. The least three frequency of crimes were non-
criminal, human trafficking and non-criminal. Analysis shows that the highest frequency of
crimes took place in 2012. The least number of crimes took place in 2016. In the month of
December 19 and 31 crimes took place in 2015 and 2016 respectively.
The year 2012 reported the highest number of crimes in Chicago.

2BIG DATA AND ANALYTICS
The trend of crimes in different is approximately the same. It can be viewed from the
trend that most crimes take place in January. Moreover, most of the crimes does not lead to
arrest. Further, it is found that the dataset pertains to information of 23 districts of Chicago.
In addition, most of the crimes took place in district 11 (25.56K).
The least number of crimes took place in the district of 31. Theft reported the highest
number of crimes in district “8” in 2014. During the period of 2012-16 there were 53161
domestic crimes. In 2012 there were 132.72K domestic crimes. Similarly, the number of
domestic crimes in 2013 was 121.13K. Further, it is found that there were 106.14K crimes in
2014.
Advanced Insights
For the advanced insight we investigate the crimes committed in 2016.
From the above image it is found that in 2016 theft had the highest frequency of
crimes committed in 2016. The least crime committed was homicide.
Secure Best Marks with AI Grader
Need help grading? Try our AI Grader for instant feedback on your assignments.

3BIG DATA AND ANALYTICS
The above image presents the crimes in different months of 2016. It can be envisaged
the frequency of crimes in April and May was higher than in other months. It can also be
foreseen that Gambling and Stalking was the only crime in April.
Further investigation of crimes in May showed that most crimes took place in
Thursday. It was also seen that no crime took place on Saturdays and Sundays in the month
of May in 2016.
Further investigation of crimes in April showed that most crimes took place in
Tuesday. It was also seen that no crime took place on Wednesday, Thursday and Saturdays in
the month of April in 2016.

4BIG DATA AND ANALYTICS
The above image presents domestic violence in different months of 2016. It can be
seen from the above image that most domestic violence took place April and May.
The analysis of the information suggests that there are many locations where only one
crime has taken place. In addition, we find that the highest crime took place at 41.75, 87.74.
The most crime at a location was 69. Moreover, it is found that the number of crimes on each
day of the week was approximately equal.
Research
In order to analyse the data different visualization techniques were used.

5BIG DATA AND ANALYTICS
In order to depict the number of different crimes in 2016 a bar chart is used. The bar
chart is found suitable since the height of the chart is proportional to the number of crimes of
the particular type. Thus, a comparative study of the frequency of different crimes can be
done (Evergreen, 2016).
The frequency of crimes every month is depicted through the use of a line chart. A
line chart has an x-axis and y-axis. On the x-axis the months are placed and in the y-axis
numbers are provided. The placement of the legend relating the x-axis and y-axis provides
information for crimes every month (Miller, 2016).
In order to visualise the highest number of crimes for a location a cross table is used.
The row axis represents the location and the column axis presents the number of crimes. The
column axis is sorted from highest to lowest. Thus, one can easily view the highest number of
crimes at the particular location (Song et al., 2017).
Paraphrase This Document
Need a fresh take? Get an instant paraphrase of this document with our AI Paraphraser

6BIG DATA AND ANALYTICS
Recommendations for POLICE CHIEF
Recommendation 1: Location of the Crime
From the above visualisation the police chief can easily contemplate that the
frequency of crimes is higher in the districts of 11, 8 and 4. There seems to be an influence of
neighbourhood (district location) in crimes. Thus it can be recommended that the police chief
should be highly vigilant in these districts (Schnell, Braga & Piza, 2017).
Recommendation 2: Type of the Crime
Further from the analysis it is found that the highest frequency of crimes over the last
4 years is theft. Thus the department needs to be extra-vigilant towards theft crimes.
Cover letter
From the above analysis it can be envisioned that the incidence of crime is higher in
district 11, 8 and 4. thus it can be suggested that the police department should particularly
focus on these districts (Yang et al., 2018).
Further it is also found that the frequency of crimes in January is higher than in other
months. Thus it can be recommended that the department needs to increase its vigilance
during January as compared to other months.

7BIG DATA AND ANALYTICS
The Reflection
The use of an online BI tool to investigate crime data was challenging. IBM Watson
Analytics was easy in the sense that it uses AI to generate approximate visualisations. For
each of the analysis a suitable question had to be asked. Initially we had to visualise how to
represent the answers to the questions. The challenge was to ask the particular questions
which would provide the given answer. The next task was to select the particular suggested
visualization which would be easy to understand and would provide the necessary answer.

8BIG DATA AND ANALYTICS
Reference
Drawve, G., & Barnum, J. D. (2018). Place-based risk factors for aggravated assault across
police divisions in Little Rock, Arkansas. Journal of Crime and Justice, 41(2), 173-
192.
Evergreen, S. D. (2016). Effective data visualization: The right chart for the right data. Sage
Publications.
Kennedy, L. W., Caplan, J. M., Piza, E. L., & Buccine-Schraeder, H. (2016). Vulnerability
and exposure to crime: Applying risk terrain modeling to the study of assault in
Chicago. Applied Spatial Analysis and Policy, 9(4), 529-548.
Kieltyka, J., Kucybala, K., & Crandall, M. (2016). Ecologic factors relating to firearm
injuries and gun violence in Chicago. Journal of forensic and legal medicine, 37, 87-
90.
Miller, J. D. (2016). Learning IBM Watson Analytics. Packt Publishing Ltd.
Schnell, C., Braga, A. A., & Piza, E. L. (2017). The influence of community areas,
neighborhood clusters, and street segments on the spatial variability of violent crime
in Chicago. Journal of quantitative criminology, 33(3), 469-496.
Song, J., Andresen, M. A., Brantingham, P. L., & Spicer, V. (2017). Crime on the edges:
Patterns of crime and land use change. Cartography and Geographic Information
Science, 44(1), 51-61.
Yang, D., Heaney, T., Tonon, A., Wang, L., & Cudré-Mauroux, P. (2018). CrimeTelescope:
crime hotspot prediction based on urban and social media data fusion. World Wide
Web, 21(5), 1323-1347.
1 out of 10
Related Documents

Your All-in-One AI-Powered Toolkit for Academic Success.
+13062052269
info@desklib.com
Available 24*7 on WhatsApp / Email
Unlock your academic potential
© 2024 | Zucol Services PVT LTD | All rights reserved.