Cash Flow Analysis of Big Yellow Group: Financial Performance
VerifiedAdded on 2022/08/13
|14
|2667
|441
Report
AI Summary
This report presents a comprehensive cash flow analysis of the Big Yellow Group, a leading self-storage company in the UK. It examines the company's financial performance by scrutinizing its cash flow statement, focusing on operating, investing, and financing activities. The analysis delves into the net cash movement, highlighting significant growth in operating activities and comparing the current year's performance with the previous year. It explores the components of operating activities, including operating profit, pre-working capital, and working capital analysis, providing insights into the company's core functions and profitability. The report also investigates key financial ratios like inventory, receivable, and payable ratios to assess the company's efficiency in managing its assets and liabilities. Furthermore, it assesses the company's suitability for investors, considering dividend payouts and overall financial health. The report concludes with an evaluation of the company's performance and its capacity to generate cash from its core operations, offering valuable insights for investors and stakeholders.
Running Head: CASH FLOW ANALYSIS
CASH FLOW ANALYSIS
Name of the Student
Name of the University
Author Note:
CASH FLOW ANALYSIS
Name of the Student
Name of the University
Author Note:
Paraphrase This Document
Need a fresh take? Get an instant paraphrase of this document with our AI Paraphraser
1CASH FLOW ANALYSIS
Executive Summary
This report provides an analysis and evaluation of cash flow statement of the Big Yellow Group
which is a self-storage establishment. The evaluation is related to the operating, investing and
financing activities of the company. The primary focus of the report is on analyzing the change
in the operating activities and the profit derived as compared to the previous year.
2CASH FLOW ANALYSIS
Table of Contents
Introduction......................................................................................................................................3
Background......................................................................................................................................3
Discussion........................................................................................................................................4
Analysis of the Cash Flow Statement..............................................................................................4
Operating Activities.........................................................................................................................5
Operating Profit...........................................................................................................................5
Suitability for Investors.................................................................................................................10
Conclusion.....................................................................................................................................11
Reference.......................................................................................................................................12
⊘ This is a preview!⊘
Do you want full access?
Subscribe today to unlock all pages.
Trusted by 1+ million students worldwide
3CASH FLOW ANALYSIS
Introduction
The cash flow statement is the resource for testing the liquidity of the company as it
reflects variation that takes place and measures how efficient a company is at generating cash. It
is also considered as a valuable measure of profitability and a degree of future outlook through
the investor’s point of view. It provides an estimated cash forecast required for the future based
on the past and current performances.
Background
The Big Yellow Group is a self-storage establishment and is a brand leader and the
establishment is tiered the biggest self-storage company in the United Kingdom. Founded in
1998, the company functions from a platform of 99 stores which are positioned in the high
profile places across the country and employs more than 450 people. This company delivers a
safe and modern self-storage unit for homes and businesses countrywide. The company is also
listed in the London Stock Exchange and its headquarter is in Bagshot, England. The portfolio of
the company is strategically focused on the metropolitan cities where the restriction to entry and
economic activities are utmost.
Paraphrase This Document
Need a fresh take? Get an instant paraphrase of this document with our AI Paraphraser
4CASH FLOW ANALYSIS
Discussion
Analysis of the Cash Flow Statement
Net Cash Movement
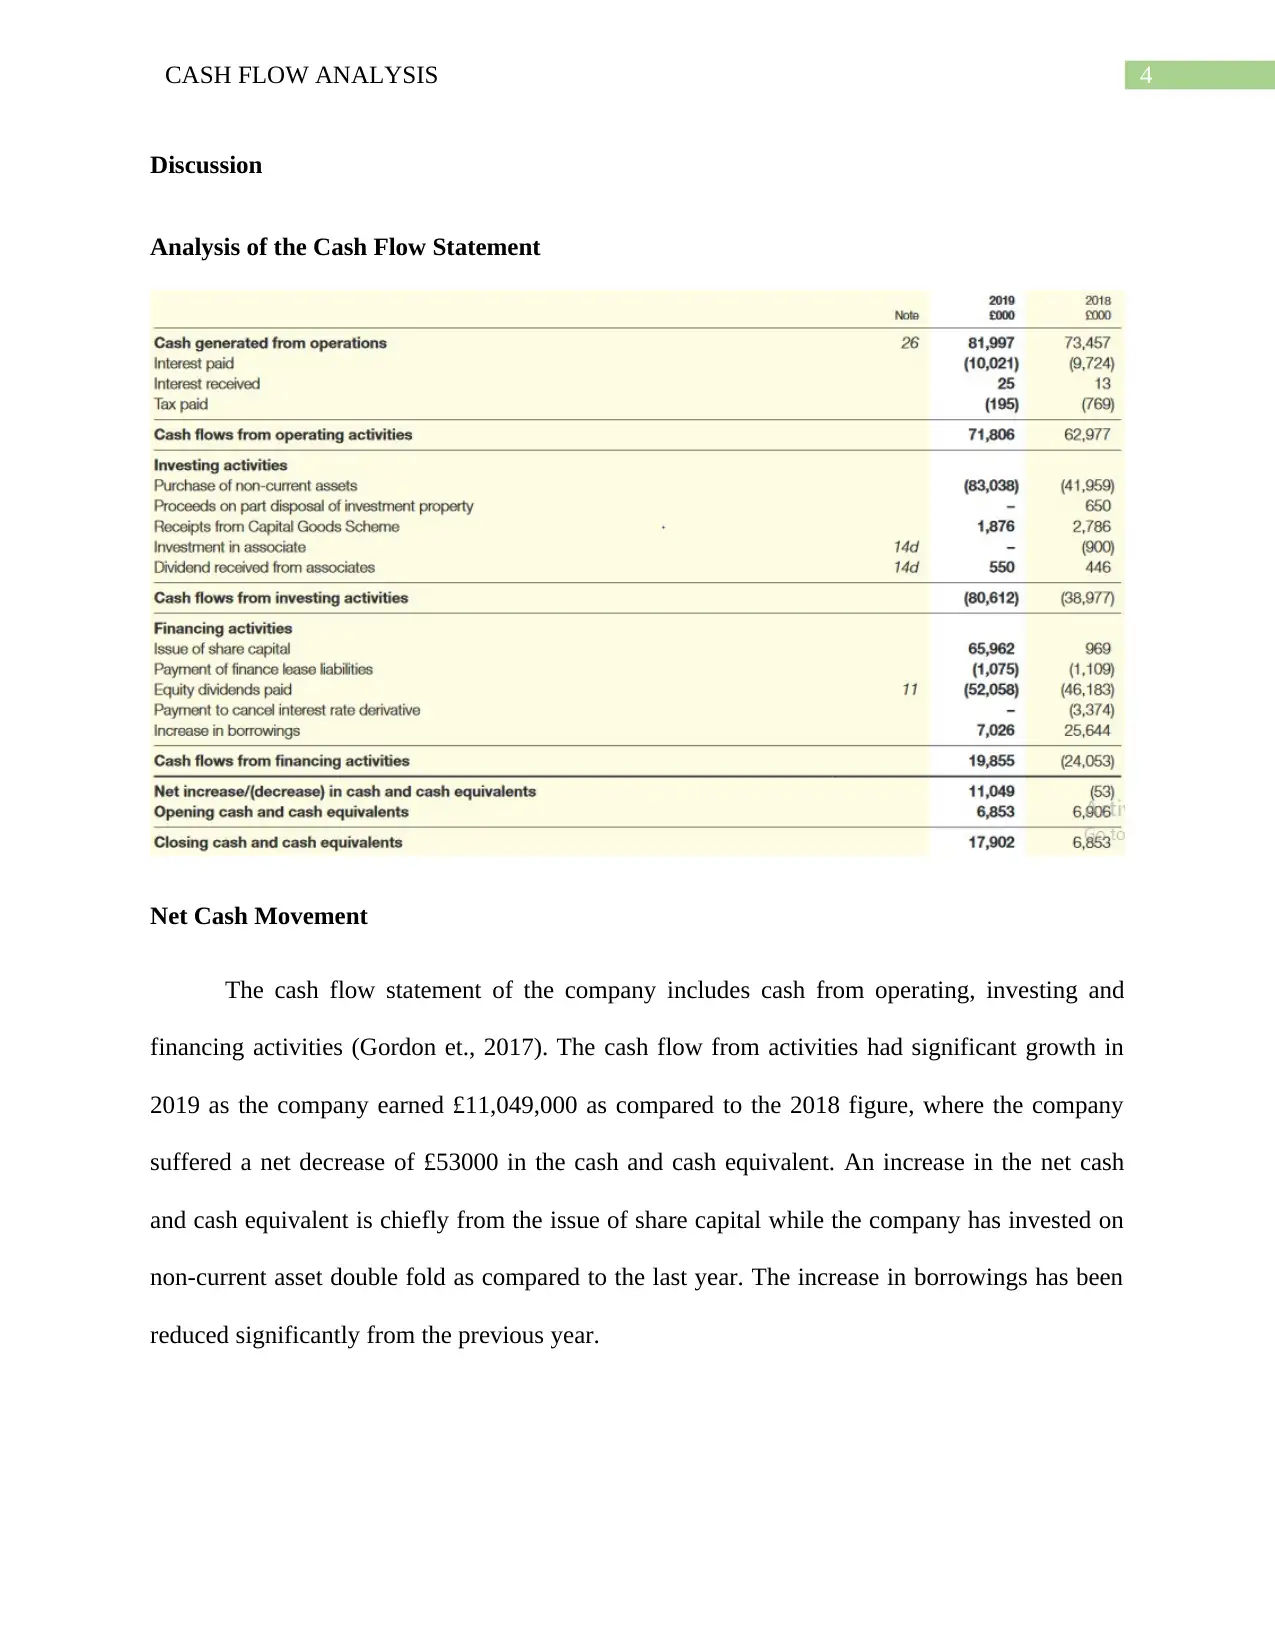
The cash flow statement of the company includes cash from operating, investing and
financing activities (Gordon et., 2017). The cash flow from activities had significant growth in
2019 as the company earned £11,049,000 as compared to the 2018 figure, where the company
suffered a net decrease of £53000 in the cash and cash equivalent. An increase in the net cash
and cash equivalent is chiefly from the issue of share capital while the company has invested on
non-current asset double fold as compared to the last year. The increase in borrowings has been
reduced significantly from the previous year.
Discussion
Analysis of the Cash Flow Statement
Net Cash Movement
The cash flow statement of the company includes cash from operating, investing and
financing activities (Gordon et., 2017). The cash flow from activities had significant growth in
2019 as the company earned £11,049,000 as compared to the 2018 figure, where the company
suffered a net decrease of £53000 in the cash and cash equivalent. An increase in the net cash
and cash equivalent is chiefly from the issue of share capital while the company has invested on
non-current asset double fold as compared to the last year. The increase in borrowings has been
reduced significantly from the previous year.
5CASH FLOW ANALYSIS
Operating Activities
Operating activities are the core functions of the company which is directly linked to
providing goods and services to the customers (Fawzi, Kamaluddin and Sanusi, 2015). The core
activities of the company include manufacturing, marketing, distributing and selling the product
or services. The operating activities of the company provide the majority of the cash flow and
also signifies whether the business will be profitable or not (Kaspina, Molotov and Kaspin,
2015). The operating activities comprise cash flow from the sale of goods and services, payments
to employees, payment to suppliers, taxes and includes expenses related to administration and
maintenance activity.
Operating Profit
The operating profit of the Big Yellow Storage Group has decreased in the financial year
as compared to the previous year. The main reason for decreasing operating profit is reduced
gain on the revaluation of the investment properties as compared with last year. The operating
cost has been increased by £2.5 million which includes expensed which is more than 7 percent as
compared to the previous year. Since the company considers changes in the valuation of the asset
as a change in the operating performance of the business; therefore, the company had lower
operating profit in 2019.
Pre-Working Capital and Working Capital Analysis
The cash generated from the pre working capital movements of the company is calculated
by adjusting the changes that took place in the inventory, accounts receivable and accounts
payable. An increase in the inventory or receivables has been deducted while any decrease in the
accounts payable has been added from the cash generated from operation to get the cash
generated from operation pre working capital movements (Atseye, Ugwu and Takon, 2015). The
⊘ This is a preview!⊘
Do you want full access?
Subscribe today to unlock all pages.
Trusted by 1+ million students worldwide
6CASH FLOW ANALYSIS
company has seen an increase of more than 7 percent from the previous year. The sales have
increased by 7.5% from the previous year which was driven by an increase in the average
occupancy of the store and an increase in the net rent achieved per sq. ft. the revenue also
includes selling of insurance, storage related charges and packing material.
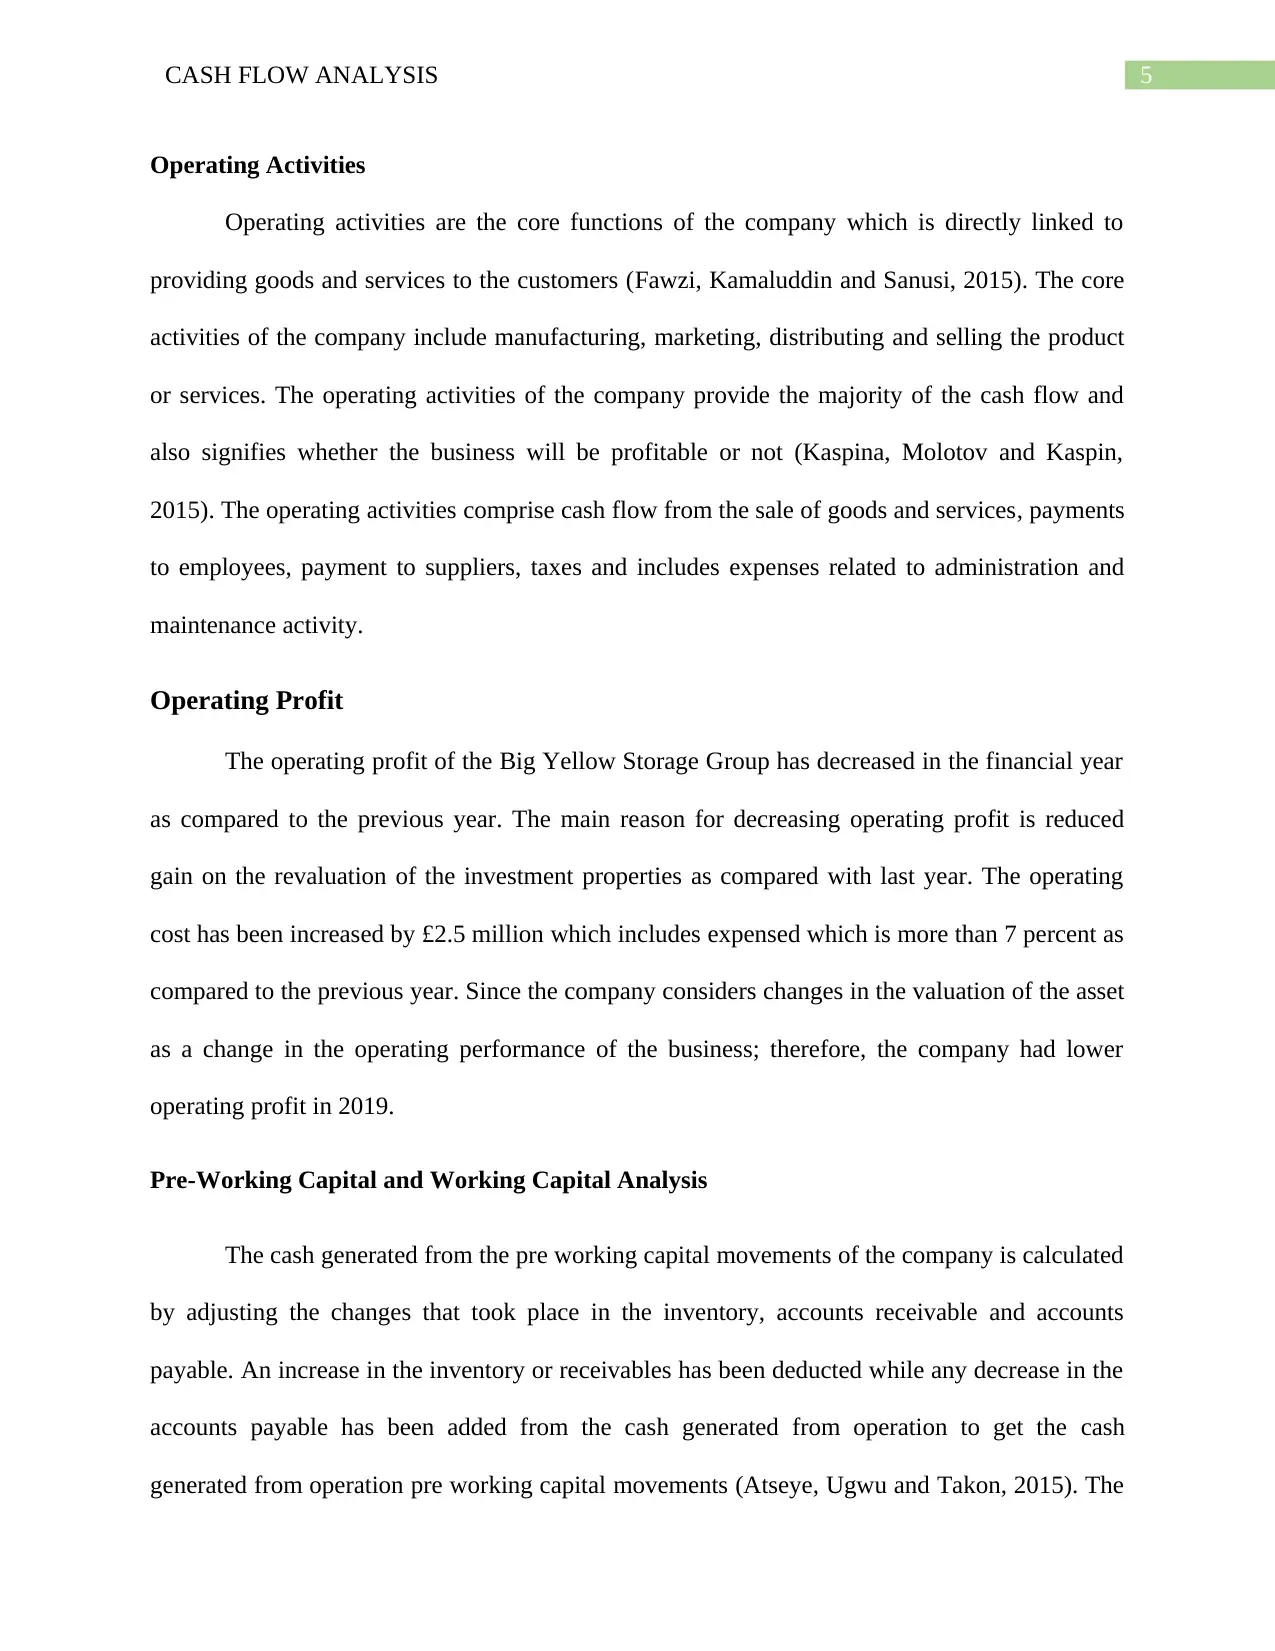
Inventory Ratio in Days
Calculation of Inventory Ratio
Days
Amount('000)
Opening Inventory €
283
Closing Inventory €
282
Average Inventory €
282.5
Cost of Sales €
38,145
Inventory Turnover times 135.03
No. of days in 12 months 365
Inventory Turnover Days 2.70
The inventory turnover days show the number of times a company trades and replaces its
stock during a given period. The higher the inventory turnover times the better for the company
since a high turnover signifies that the company can sell its inventory quickly and it also signifies
company has seen an increase of more than 7 percent from the previous year. The sales have
increased by 7.5% from the previous year which was driven by an increase in the average
occupancy of the store and an increase in the net rent achieved per sq. ft. the revenue also
includes selling of insurance, storage related charges and packing material.
Inventory Ratio in Days
Calculation of Inventory Ratio
Days
Amount('000)
Opening Inventory €
283
Closing Inventory €
282
Average Inventory €
282.5
Cost of Sales €
38,145
Inventory Turnover times 135.03
No. of days in 12 months 365
Inventory Turnover Days 2.70
The inventory turnover days show the number of times a company trades and replaces its
stock during a given period. The higher the inventory turnover times the better for the company
since a high turnover signifies that the company can sell its inventory quickly and it also signifies
Paraphrase This Document
Need a fresh take? Get an instant paraphrase of this document with our AI Paraphraser
7CASH FLOW ANALYSIS
that the demand for the product exists (Gaur and Kesavan, 2015). Apart from providing an
insight regarding the management of the stock, it also shows whether the sales and purchasing
department are in sync. The decrease in the inventory of £1m was due to the sales made by the
Armadillo Storage Holding company.
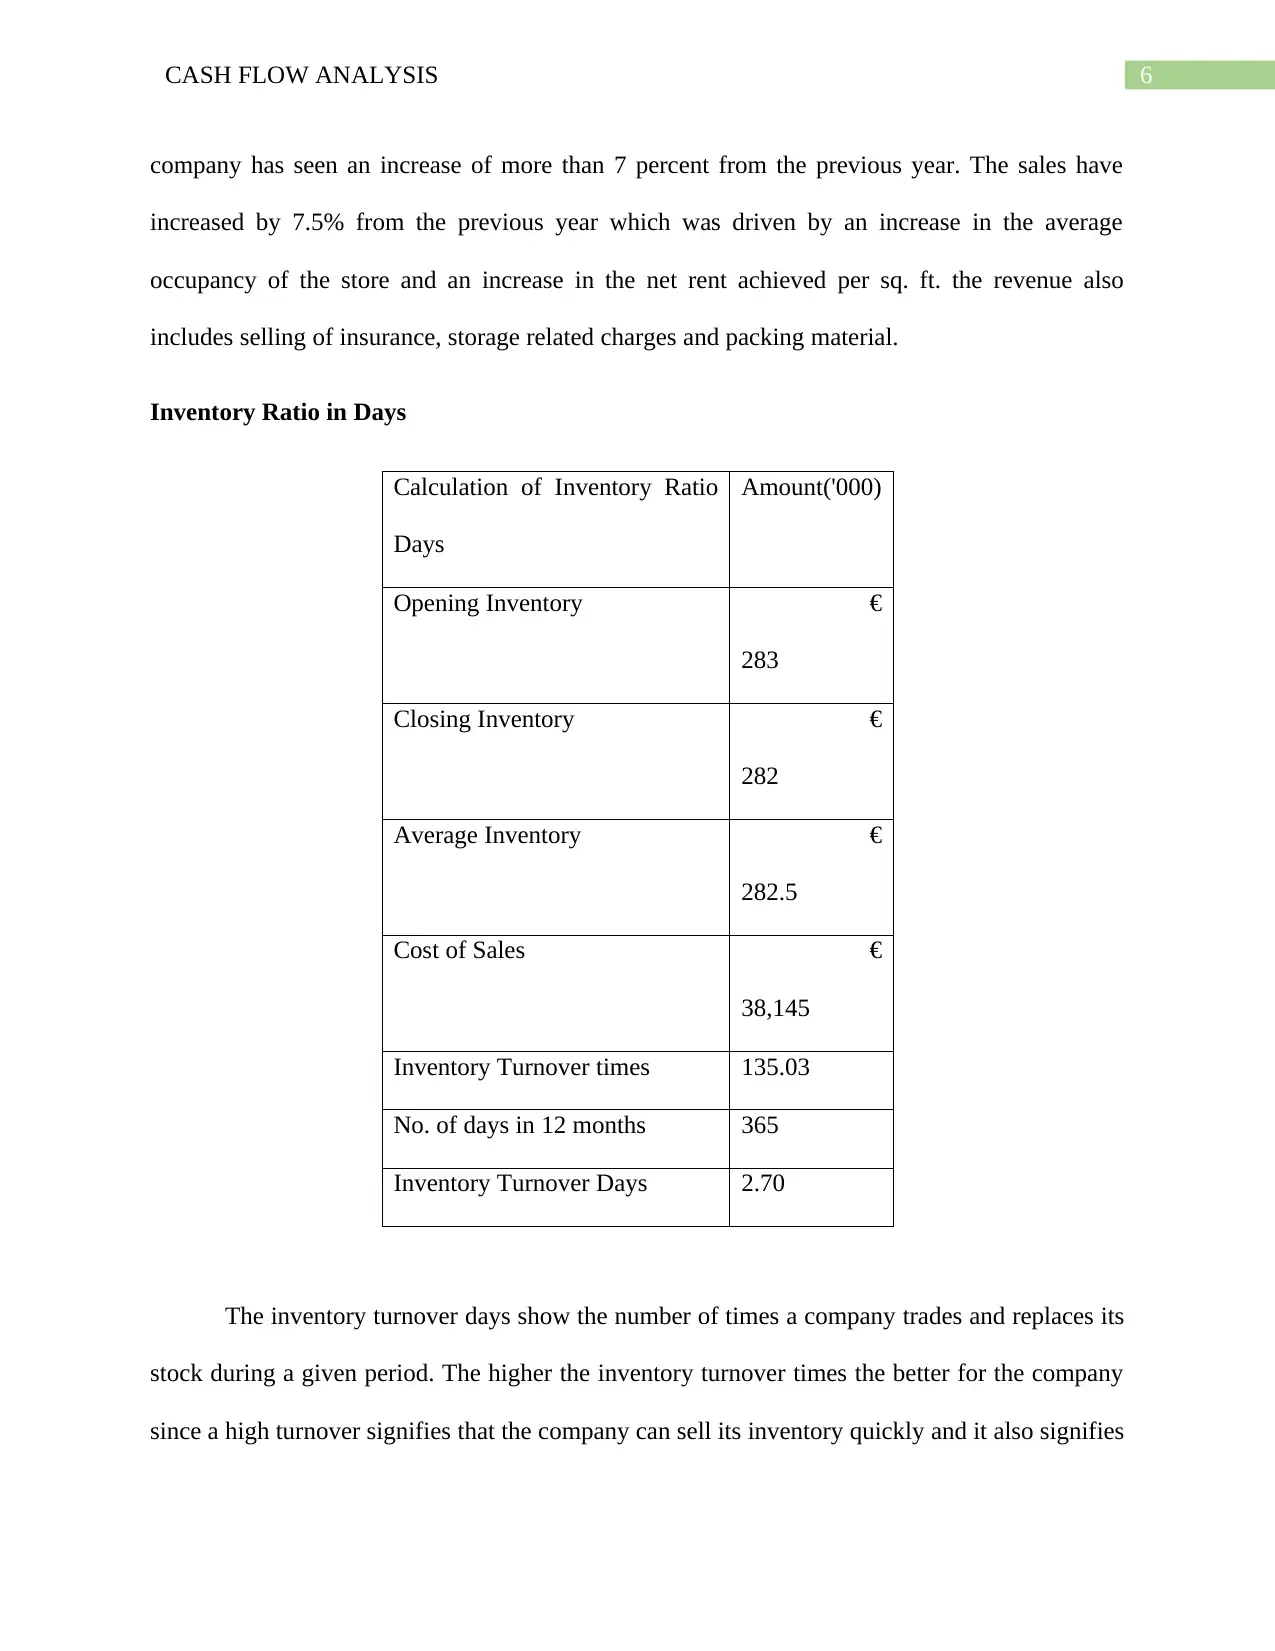
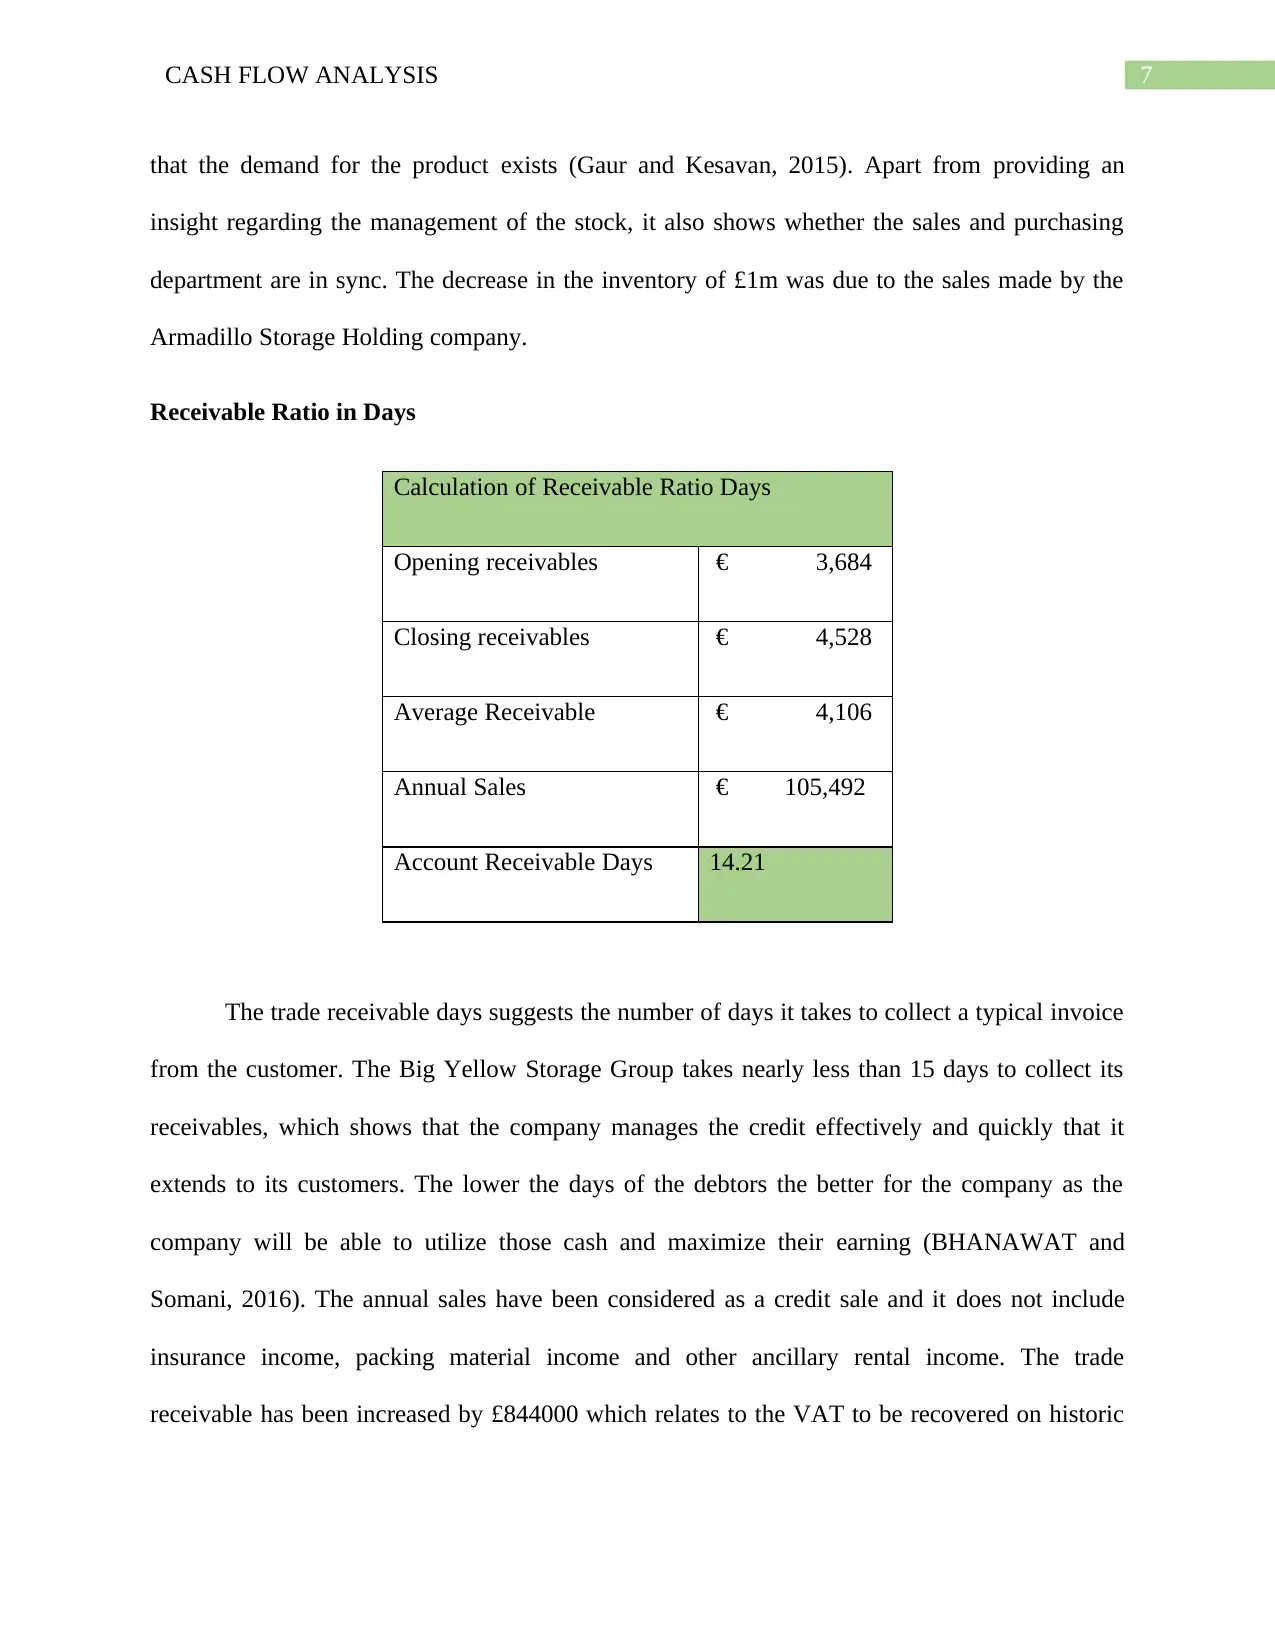
Receivable Ratio in Days
Calculation of Receivable Ratio Days
Opening receivables € 3,684
Closing receivables € 4,528
Average Receivable € 4,106
Annual Sales € 105,492
Account Receivable Days 14.21
The trade receivable days suggests the number of days it takes to collect a typical invoice
from the customer. The Big Yellow Storage Group takes nearly less than 15 days to collect its
receivables, which shows that the company manages the credit effectively and quickly that it
extends to its customers. The lower the days of the debtors the better for the company as the
company will be able to utilize those cash and maximize their earning (BHANAWAT and
Somani, 2016). The annual sales have been considered as a credit sale and it does not include
insurance income, packing material income and other ancillary rental income. The trade
receivable has been increased by £844000 which relates to the VAT to be recovered on historic
that the demand for the product exists (Gaur and Kesavan, 2015). Apart from providing an
insight regarding the management of the stock, it also shows whether the sales and purchasing
department are in sync. The decrease in the inventory of £1m was due to the sales made by the
Armadillo Storage Holding company.
Receivable Ratio in Days
Calculation of Receivable Ratio Days
Opening receivables € 3,684
Closing receivables € 4,528
Average Receivable € 4,106
Annual Sales € 105,492
Account Receivable Days 14.21
The trade receivable days suggests the number of days it takes to collect a typical invoice
from the customer. The Big Yellow Storage Group takes nearly less than 15 days to collect its
receivables, which shows that the company manages the credit effectively and quickly that it
extends to its customers. The lower the days of the debtors the better for the company as the
company will be able to utilize those cash and maximize their earning (BHANAWAT and
Somani, 2016). The annual sales have been considered as a credit sale and it does not include
insurance income, packing material income and other ancillary rental income. The trade
receivable has been increased by £844000 which relates to the VAT to be recovered on historic
8CASH FLOW ANALYSIS
store development expenditure. Increase in the receivable signifies that the sales have also been
increased.
Payable Ratio in Days
Calculation of Payable Ratio Days
Opening Payable 12739
Closing Payable 15522
Average Payable 14130.5
Cost of Sales 38145
Payable Ratio Days 135.21
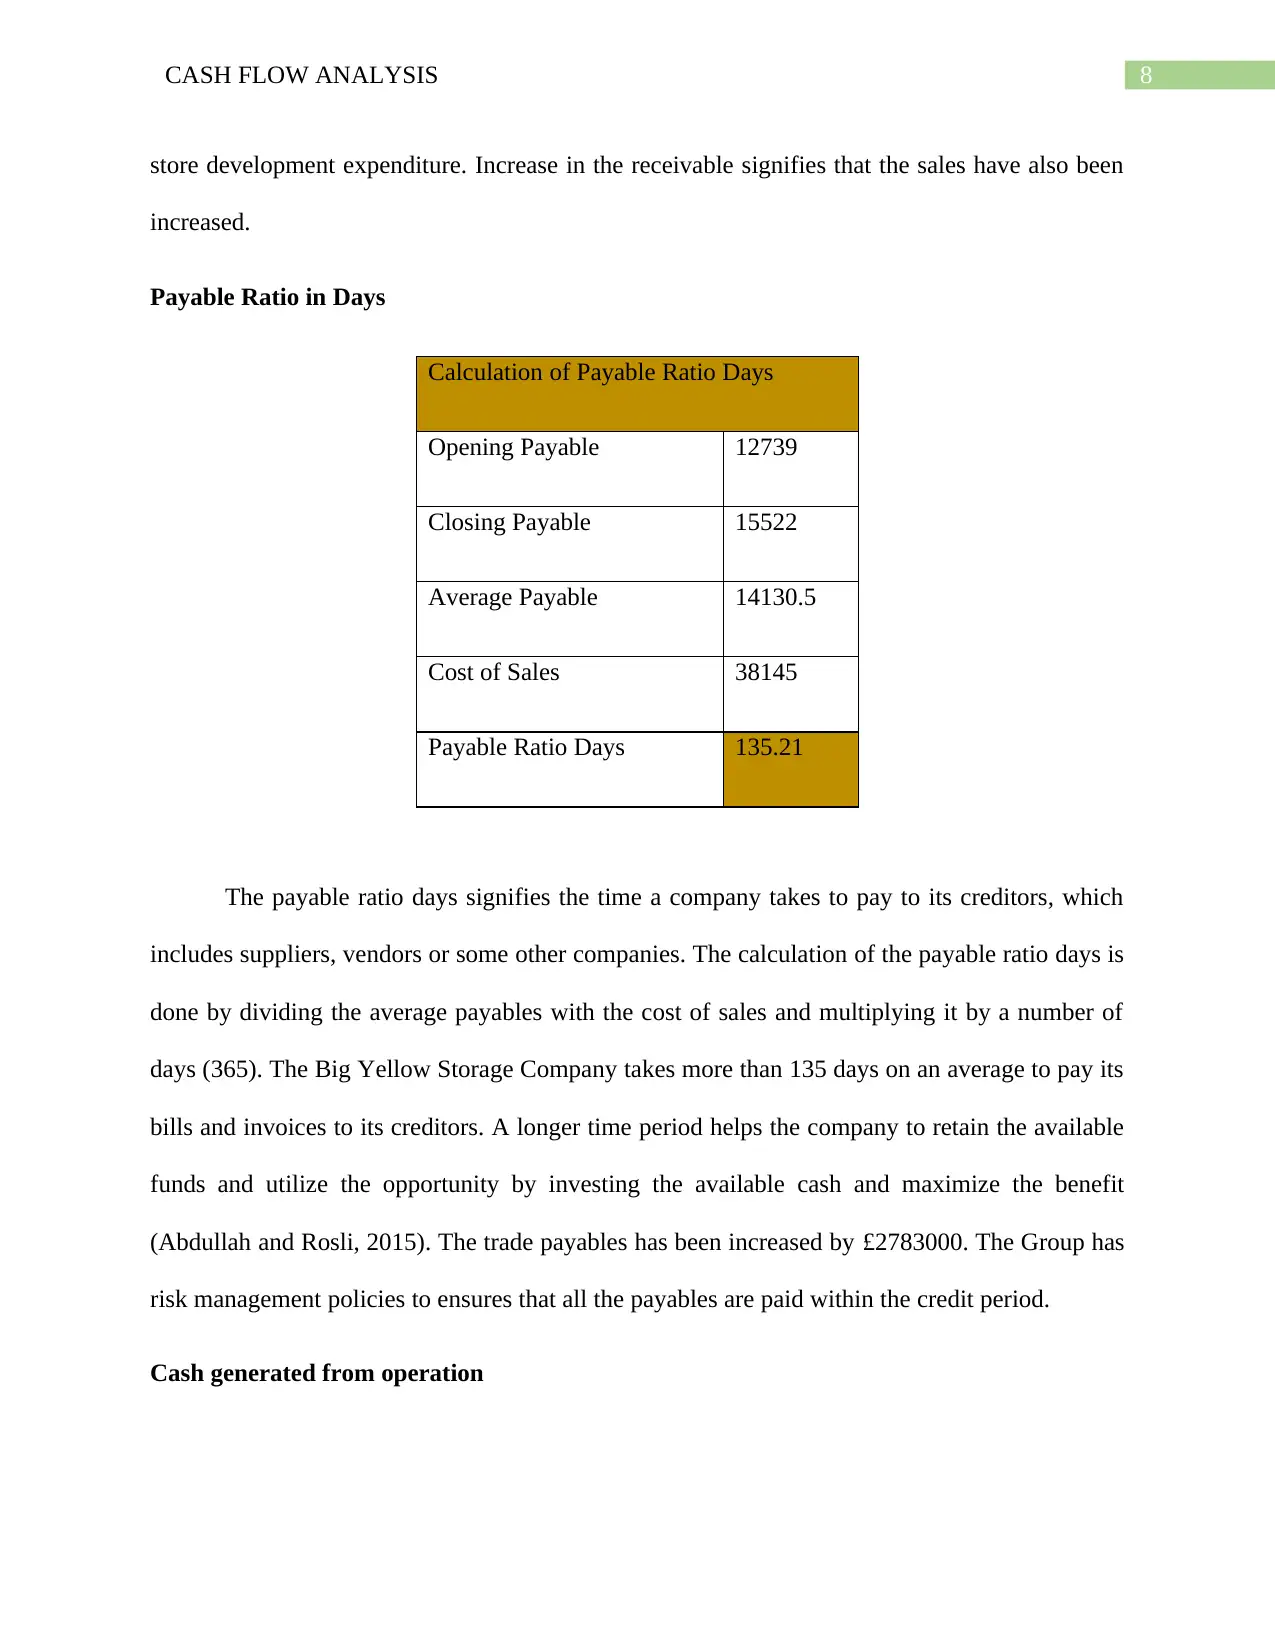
The payable ratio days signifies the time a company takes to pay to its creditors, which
includes suppliers, vendors or some other companies. The calculation of the payable ratio days is
done by dividing the average payables with the cost of sales and multiplying it by a number of
days (365). The Big Yellow Storage Company takes more than 135 days on an average to pay its
bills and invoices to its creditors. A longer time period helps the company to retain the available
funds and utilize the opportunity by investing the available cash and maximize the benefit
(Abdullah and Rosli, 2015). The trade payables has been increased by £2783000. The Group has
risk management policies to ensures that all the payables are paid within the credit period.
Cash generated from operation
store development expenditure. Increase in the receivable signifies that the sales have also been
increased.
Payable Ratio in Days
Calculation of Payable Ratio Days
Opening Payable 12739
Closing Payable 15522
Average Payable 14130.5
Cost of Sales 38145
Payable Ratio Days 135.21
The payable ratio days signifies the time a company takes to pay to its creditors, which
includes suppliers, vendors or some other companies. The calculation of the payable ratio days is
done by dividing the average payables with the cost of sales and multiplying it by a number of
days (365). The Big Yellow Storage Company takes more than 135 days on an average to pay its
bills and invoices to its creditors. A longer time period helps the company to retain the available
funds and utilize the opportunity by investing the available cash and maximize the benefit
(Abdullah and Rosli, 2015). The trade payables has been increased by £2783000. The Group has
risk management policies to ensures that all the payables are paid within the credit period.
Cash generated from operation
⊘ This is a preview!⊘
Do you want full access?
Subscribe today to unlock all pages.
Trusted by 1+ million students worldwide
9CASH FLOW ANALYSIS
The cash generated from the operation is derived after deducting all the gains and adding
back all the expenses. The company has increased the investment on the non-current asset double
fold that includes acquisition of New Malden Store (£29m), purchase of land for new store
(£35m), and construction capital expenditure (£19m) and issued share to raise the capital which
are the major activities of the company during the financial year. The cash flow from the
operating activities has increased by £8829000 (14%), while the cash flow from investing
activity has increased by £41635000 and the cash flow from financing activity increased by
£43908000. The variations in the figure are derived when a comparison is made with the
previous year's data (Corporate.bigyellow.co.uk., 2020).
Interest received and Interest paid.
The cash flow from the investing activities reduced significantly from £24m to £8.8m and
this offset is primarily due to the increased investment in capital expenditure. The valuation of
investment property reflects a revaluation surplus of £59m. Of this 27% increase is because of
the Cap rate used in the valuation and the remaining 73% is due to the increase in the cash flow
from the asset and changes to the operating assumption used in the valuation. The interest
received has decreased by £12000 while interest payable has also been increased by £297000 as
compared from the previous year. Increase in the interest paid is because of the increase in the
Group’s interest cover which was increased by 0.6 times i.e. from 7.6 (2018) to 8.2 (2019). The
increase in the interest received is due to interest received from the banks from the investment
made.
Borrowings and Tax paid
Paraphrase This Document
Need a fresh take? Get an instant paraphrase of this document with our AI Paraphraser
10CASH FLOW ANALYSIS
The weighted average interest rate paid on the borrowings remains unchanged from the
last year. However, the current liability and the non-current liability of the company has been
increased in comparison to the previous year. The movement in the loan is seen in the cash flow
statement as the bank loan is a revolving facility and is redrawn and repaid at the end of each
month and due to which the interest payment has been increased. The loan taken from Aviva
Commercial Finance Limited is a secured loan with a portfolio of 15 freehold self-storage
centers and is a fixed rate loan.
The tax charge in the year reduced from £0.4m to £0.6m. The tax charge in the current
year reflects an increase in the profits from the residual business. The offset is due to the
deduction allowed for tax purpose from the exercise of share options. The tax payment has been
considerably reduced from £769000 to £195000 which is the primary cause of the increase in the
cash flow from operation.
Suitability for Investors
The investors usually measure and compare the cash flow statement of different
companies to reveal the quality of their earning (Tayeh, Al-Jarrah, and Tarhini, 2015). The cash
flow statement is considered as a valuable measure of profitability and a degree of future outlook
through the investor’s point of view. The investors closely look at the three segments of the cash
flows that are operating, investing and financing (Pinto, 2020). The cash flow statement of The
Big Yellow company shows that the company is earning sufficient proceeds from the operating
and financing activities and investing the same for the expansion and development of the
business.
11CASH FLOW ANALYSIS
The final dividend payment for the year ended 2018 increased from 14.1p per share to
15.5p per share in comparison with previous year and the interim dividend for the year ended
2019 increased from 15.3p per share to 16.7p per share, and as a result, the proposed final
dividend for the year 2019 has been increased from 15.5p per share to 16.5p per share (Storage,
2020). The increase in the net cash and cash equivalent for the year ended March 2019 is a
significant boost for the company after a negative net cash outflow from the previous year, and
an increase in the proposed dividend will attract more investors to invest in the company.
Conclusion
The report analyzes the cash flow statement of the Big Yellow Storage Group and
highlights the performance of the company. The company is also ranked as the largest self-
storage company in United kingdom (Newell and Marzuki, 2016) Apart from providing an
insight about the liquidity and solvency of the firm, the cash flow statement also delivers
information regarding the capability of the company to generate cash from its core activities and
helps the investors to project the future outcomes and take decisions regarding investments
accordingly. A systematic analysis of the background and net cash movement from operating,
investing and financing activities has been made in the report. Apart from analyzing on the pre
working capital movement, a light has also been forecasted on the number of days the company
holds inventory, the duration within which the company receives from debtors and pay to its
creditors. From the cash flow statement, it is witnessed that the company has been focusing on
expansion since the company increased its investment on the non-current assets double-fold
when compared to the previous year.
⊘ This is a preview!⊘
Do you want full access?
Subscribe today to unlock all pages.
Trusted by 1+ million students worldwide
1 out of 14
Related Documents


Your All-in-One AI-Powered Toolkit for Academic Success.
+13062052269
info@desklib.com
Available 24*7 on WhatsApp / Email
![[object Object]](/_next/static/media/star-bottom.7253800d.svg)
Unlock your academic potential
Copyright © 2020–2026 A2Z Services. All Rights Reserved. Developed and managed by ZUCOL.