Federation Business School: Billabong Financial Report Analysis, 2018

Verified

Added on  2023/03/20

|21
|3794
|89
Report
AI Summary
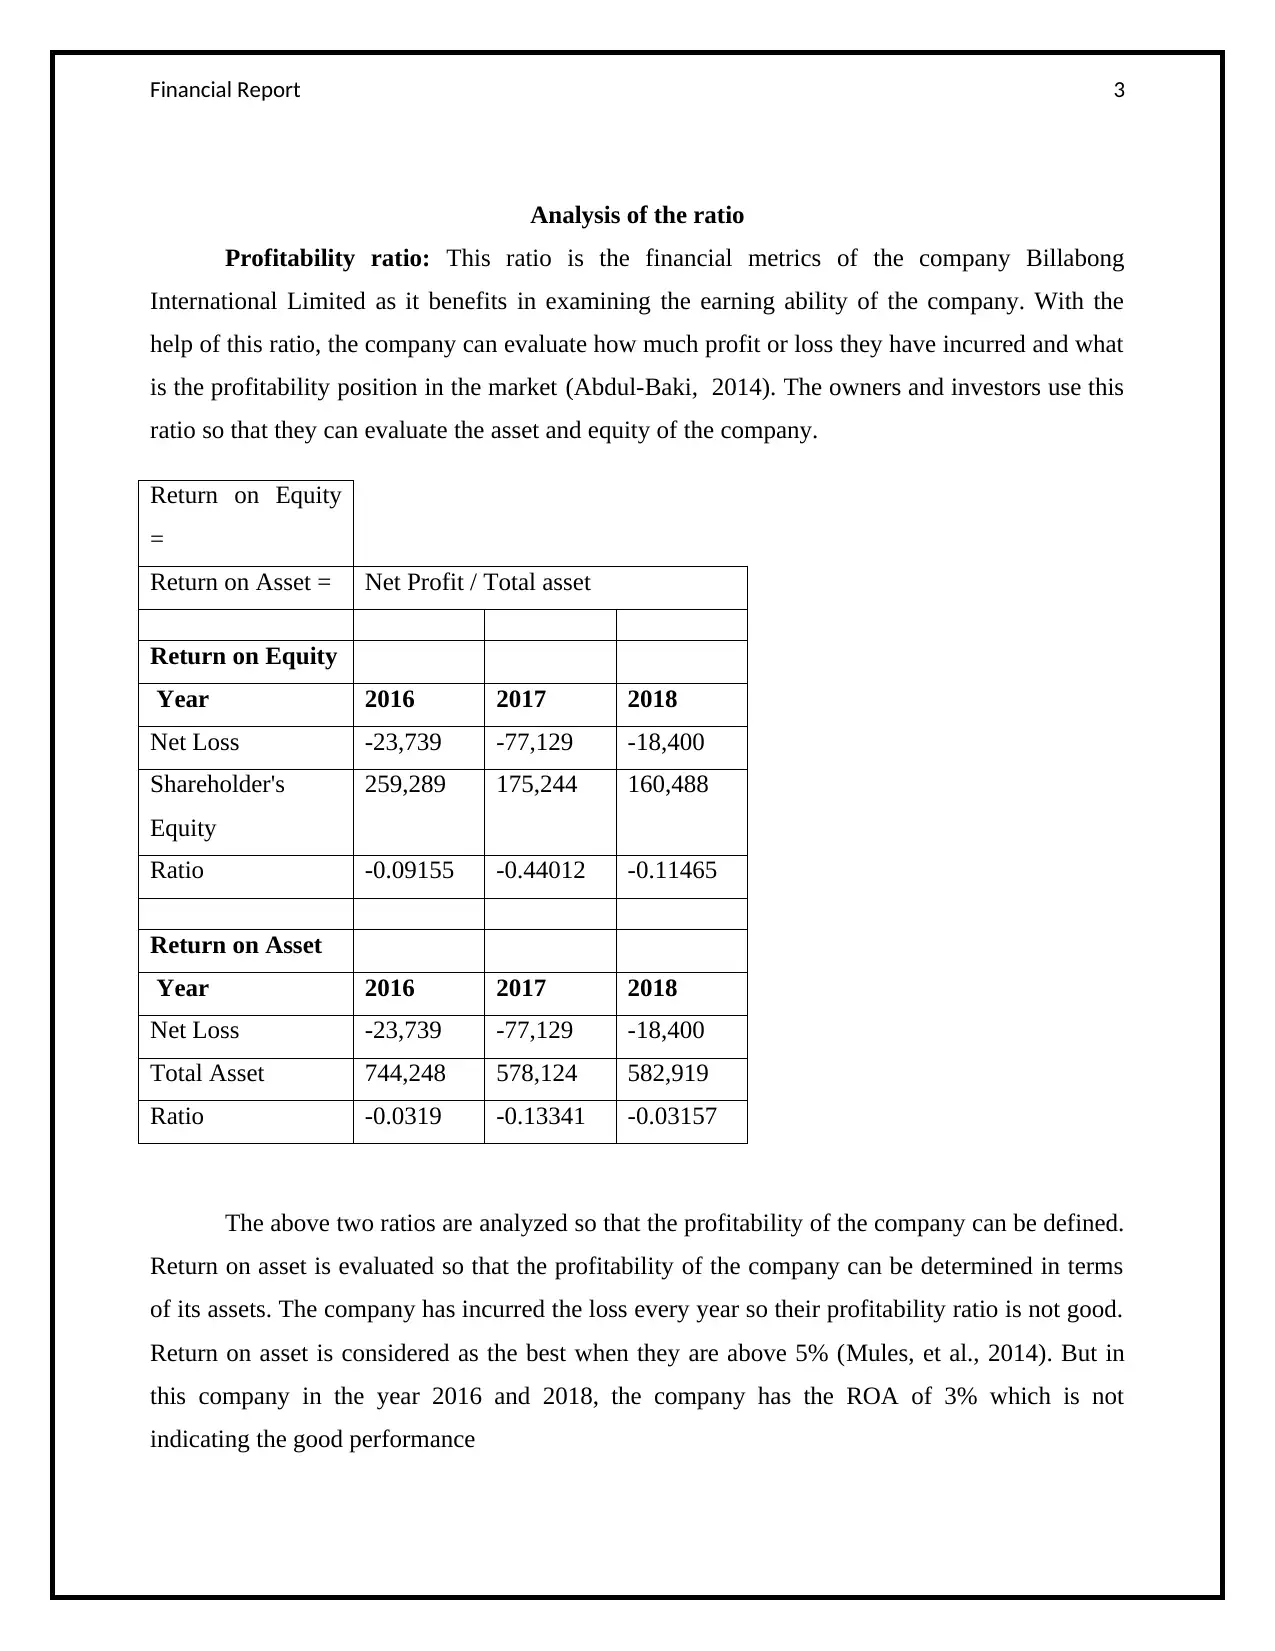
This report provides a detailed analysis of Billabong International Limited's financial performance, focusing on the years 2016, 2017, and 2018. The report examines various financial ratios, including profitability (Return on Equity, Return on Asset), efficiency (Asset Turnover Ratio, Equity Turnover Ratio), liquidity (Current Ratio, Liquid Ratio), gearing (Debt Ratio, Equity Ratio), and investment ratios. The analysis reveals that Billabong experienced financial difficulties, incurring losses and facing challenges related to high debt and declining revenues. The report concludes that the company's financial position is unfavorable, with recommendations for improvement including better budgeting, expense reduction, and marketing strategies. The report also highlights the importance of understanding accounting information and its application in evaluating a company's monetary position. The report utilizes the financial statements of Billabong International Limited to evaluate the company's performance.
Document Page
Running Head: Financial Report 0
Billabong International Limited
Financial Report
5/17/2019
The report has prepared so that the use of the accounting information can be understand. In this
report the practical are evaluated to know the monetary place of the company so that the knowledge
and skills of the accounting information can be ascertained. The annual report of the company
Billabong International Limited has been studies which are the merchandiser of surf wear and other
outdoor action clothing and their financial position is ascertained. By evaluating and ascertaining the
monetarist ratios of the company it is analyzed that the company has incurring the losses and they
have the high debt which is not good for the company. So for improving their financial position of the
company, they have to make the proper budgets and plans and also reduce their operating expenses.
As the company financial leverage position is also not good so by making the budgets and using the
proper marketing techniques, the company can improve their financial position.
tabler-icon-diamond-filled.svg

Paraphrase This Document

Need a fresh take? Get an instant paraphrase of this document with our AI Paraphraser
Document Page
Financial Report 1
Contents
Background Company Overview.................................................................................................................2
Analysis of the ratio....................................................................................................................................3
Conclusion and findings............................................................................................................................13
Recommendation.......................................................................................................................................14
References.................................................................................................................................................15
Appendix...................................................................................................................................................17
Document Page
Financial Report 2
Background Company Overview
Billabong International Limited is a private company which deals in retail products of the
clothing. The company was founded in 1973 in the Gold Coast, Queensland, and Australia. The
company was originated by the Gordon Merchant. The company has the headquartered in the
Burleigh Heads, Queensland, and Australia. The company has earned the net revenue of A$1.27
billion and has the net income of the A$25.7 million in the year 2014 (Beaver, et al., 2015). After
the year 2014, the profit of the company has declined. The company is the surf company which
deals in the clothing products and it also produces some accessories such as the backpacks,
watches, snowboard products, etc.
The company engages in the delivery, advertising, wholesaling and trade of the
accessories, wetsuits, eyewear, etc. The company also provides the hardware products surf,
snow, skate, and sports accessories under the different brand names. The company operates only
online retail e-commerce products (Kanapickienė and Grundienė, 2015). The company offers
many products for more than the 2200 brands which include swimwear, jeans, t-shirts, shorts,
pants, jackets, sports eyewear, fleece tops, jumpers, sweaters, etc. The products of the Billabong
are sold to over the 60 countries world widely through the licensees and it can also be sold
directly from the company. In the Australia Billabong product is the leading product (Legg,
2017).
Document Page
Financial Report 3
Analysis of the ratio
Profitability ratio: This ratio is the financial metrics of the company Billabong
International Limited as it benefits in examining the earning ability of the company. With the
help of this ratio, the company can evaluate how much profit or loss they have incurred and what
is the profitability position in the market (Abdul-Baki, 2014). The owners and investors use this
ratio so that they can evaluate the asset and equity of the company.
Return on Equity
=
Return on Asset = Net Profit / Total asset
Return on Equity
Year 2016 2017 2018
Net Loss -23,739 -77,129 -18,400
Shareholder's
Equity
259,289 175,244 160,488
Ratio -0.09155 -0.44012 -0.11465
Return on Asset
Year 2016 2017 2018
Net Loss -23,739 -77,129 -18,400
Total Asset 744,248 578,124 582,919
Ratio -0.0319 -0.13341 -0.03157
The above two ratios are analyzed so that the profitability of the company can be defined.
Return on asset is evaluated so that the profitability of the company can be determined in terms
of its assets. The company has incurred the loss every year so their profitability ratio is not good.
Return on asset is considered as the best when they are above 5% (Mules, et al., 2014). But in
this company in the year 2016 and 2018, the company has the ROA of 3% which is not
indicating the good performance
tabler-icon-diamond-filled.svg

Paraphrase This Document

Need a fresh take? Get an instant paraphrase of this document with our AI Paraphraser
Document Page
Financial Report 4
The return on equity is also evaluated so that the profitability of the company Billabong
International Limited can be evaluated in terms of its equity. The return on equity is considered
good in the company when it carries in the range between 15- 20%. In the year 2016, the net loss
of the company 23739 which has increased in the year 2017. In the year 2018, the company has
done better performance from the last two years but still, they had incurred the loss of 18400
(Billabong International Limited, 2018). In the year 2017 and 2018, the company has issued less
equity in comparison to the year 2016 which also results in declining their profit.
Document Page
Financial Report 5
Efficiency Ratio: This ratio is helpful in analyzing the efficiency of the company. It
helps in evaluating and analyzing the assets, equities, and liabilities of the company (Terry-
Armstrong, 2014). As the company Billabong International Limited deals in the commercial
things so this ratio is helpful in tracking the performance. It measures the current performance of
the company and shows the capacity of the company to produce revenue by using its properties.
Asset Turnover Ratio = Net Revenue / Average Total Assets
Equity Turnover Ratio = Net Revenue / Average Shareholder's
Equity
Asset Turnover Ratio
Year 2016 2017 2018
Net Revenue 1,103,535 979,452 476,465
Average Total Asset 1146238 950248 871981
Ratio 0.962745 1.030733 0.546417
Equity Turnover Ratio
Year 2016 2017 2018
Net Revenue 1,103,535 979,452 476,465
Average Shareholder's
Equity
400081 304888.5 248110
Ratio 2.758279 3.212492 1.920378
The asset turnover ratio and the equity turnover ratio is evaluated so that the efficiency of
the company Billabong International Limited can be ascertained (Lantto and Sahlström, 2019).
The above two ratios are evaluated so that the efficiency ratio in the company can be determined
and the monetary situation of the company can be ascertained with the help of the assets and the
equity. With the help of the asset turnover ratio, the company can evaluate the sales income of
the company by using the assets of the company.
As the company is incurring the losses so they have a high turnover ratio. The net
revenue of the company is declining from the previous year 2016 and 2017 as a comparison to
Document Page
Financial Report 6
the year 2018 (Billabong International Limited, 2018). The equity turnover ratio of the company
states the revenue of the company Billabong International Limited in relations to its shareholder's
equity. The average shareholder’s equity of the company is declining which is stating that the
company financial performance is not good.
tabler-icon-diamond-filled.svg

Paraphrase This Document

Need a fresh take? Get an instant paraphrase of this document with our AI Paraphraser
Document Page
Financial Report 7
Liquidity Ratio: This ratio of the company issued to determine the current position of
the company whether they can meet with the short term obligations or not. This is the ratios
which can be rapidly transformed into the money and they are the short term ratios which affect
the credibility of the company.
Current Asset
=
Current Asset / Current
liability
Liquid Asset
=
Liquid Asset/ Current
liability
Current
Asset
Year 2016 2017 2018
Current Asset 464,454 421,718 424,393
Current
Liability
197,932 174,489 188,051
Ratio 2.34653
3
2.41687
4
2.25679
7
Liquid Asset
Year 2016 2017 2018
Liquid Asset 278,898 259,407 234,684
Inventories 185,556 162,311 189,709
Current
Liability
197,932 174,489 188,051
Ratio 1.40906 1.48666
7
1.24798
1
The two ratios are evaluated which are the current ratio and the liquidity ratio which
helps in determining the short term obligations and the company Billabong International Limited
current asset. The liquescency situation of the company is very decent as the current ratio is
above 1 in the year 2016, 2017 and 2018 (Billabong International Limited, 2016). The company
Document Page
Financial Report 8
Billabong International Limited has the ability to meet the short term obligation on time and they
have enough assets which can be easily converted into the cash. The liquid position of the
company is also good. The company Billabong International Limited has sufficient liquid assets
which can meet the short term obligations on time. In the liquid assets, the inventories are not
included but in the year 2018, the company has enough inventories which can meet the demands
of the people.
Document Page
Financial Report 9
Gearing (Leverage): This ratio also helps in determining the financial situation of the
company as it helps in measuring the financial leverage of the company (Parent, et al., 2013).
This ratio assistance in evaluating the proportion of the company’s borrowed fund in relation to
its equity. High leverage is considered as good in the good which is more than 50% as it is
considered that high risk is taken by the company.
Debt Ratio
=
Total debt / Total asset
Equity
Ratio =
Equity / Assets
Debt Ratio
Year 2016 2017 2018
Total Debt 274,377 220,321 222,738
Total Asset 744,248 578,124 582,919
Ratio 0.36866
3
0.38109
6
0.38210
8
Equity
Ratio
Year 2016 2017 2018
Total
Equity
259,289 175,244 160,488
Total Assets 744,248 578,124 582,919
Ratio 0.34839
1
0.30312
5
0.27531
8
The debt ratio of the company Billabong International Limited is good as it is below 40
% in three years. The company can take the risk of generating enough cash flow services in
relation to its debt. The company can borrow more money as they didn't have high debt. Equity
tabler-icon-diamond-filled.svg

Paraphrase This Document

Need a fresh take? Get an instant paraphrase of this document with our AI Paraphraser
Document Page
Financial Report 10
ratio helps in analyzing how much assets the company has which were financed by their
investors. The company equity ratio is also good as it is less than the 0.4 which is indicating that
the company doesn't take any advantage of the increasing profit (Billabong International
Limited, 2017). In the year 2017 and 2018, the debt of the company is upper than the equity of
the company which is indicating that the company Billabong International Limited is not able to
make sufficient money to satisfy its debt obligation. The company has a high degree of debt
finance which is not good as per the context of the company.
Document Page
Financial Report 11
Investment Ratios: This ratio helps in examining the concert of the company Billabong
International Limited shares (Pech, et al., 2015). This ratio is helpful for potential investors and
competitors in examining the performance of the company. It helps the investors in taking the
decisions about whether to invest in the company or not. The ratio is the relationship between the
amount invested in the company and the profit made by the company.
Net Profit
Ratio =
Net Profit/ Net Revenue
Gross Profit
Ratio =
Gross Profit/ Net Revenue
Net Profit
Ratio
Year 2016 2017 2018
Net Profit
Ratio
-23,739 -
77,129
-18,400
Net Revenue 1,103,53
5
979,45
2
476,465
Ratio -0.02151 -
0.0787
5
-
0.03861
8
Net Profit
Ratio
-2.15118 -
7.8747
1
-
3.86177
4
Gross Profit Ratio
Year 2016 2017 2018
Gross Loss -15,895 -
120,79
2
-16,241
Net Revenue 1,103,53
5
979,45
2
476,465
chevron_up_icon
1 out of 21
circle_padding
hide_on_mobile
zoom_out_icon
[object Object]