Analysis of Billabong International Ltd's Financial Performance Report
VerifiedAdded on 2020/09/17
|14
|3142
|40
Report
AI Summary
This report provides a comprehensive financial analysis of Billabong International Ltd (BI Ltd), focusing on its performance in 2015 and 2016. The analysis utilizes ratio analysis to assess the company's profitability, liquidity, efficiency, and solvency. The report examines key financial ratios, including gross profit margin, operating profit margin, net profit margin, current ratio, quick ratio, total assets turnover ratio, fixed assets turnover ratio, inventory turnover ratio, and debt-equity ratio. The findings indicate that BI Ltd faced challenges in profitability, with declining gross and net profit margins. Liquidity remained sound, while efficiency ratios revealed areas for improvement. The solvency position showed an increase in the debt-equity ratio. Investment ratios highlighted the lack of dividends and declining earnings per share, indicating a need for strategic financial improvements. The report concludes with recommendations for BI Ltd to enhance its financial performance, emphasizing the importance of budgeting and promotional strategies to improve productivity and profitability.

Accounting and Finance
Paraphrase This Document
Need a fresh take? Get an instant paraphrase of this document with our AI Paraphraser
EXECUTIVE SUMMARY
Accounting implies for the measurement and disclosure of the crucial information that
gives input to the managers and stakeholders in taking decisions. Hence, accounting is highly
concerned with the summarization, analysis and reporting of financial transactions. For this
project report, Billabong International Ltd has been selected which offer clothes and other
accessories to the customers. The present report clearly presented the extent to which company is
financially sound. It can be summarized from the report that profitability, solvency, efficiency
and investment ratio of BI Ltd was not sound. Thus, business unit should focus on budgeting and
promotional aspects which in turn aid in the productivity as well as profitability aspect of firm.
TABLE OF CONTENTS
INTRODUCTION...........................................................................................................................1
MAIN BODY..................................................................................................................................1
Assessing financial health and performance of Billabong International Limited.......................1
CONCLUSION................................................................................................................................9
RECOMMENDATIONS.................................................................................................................9
REFERENCES..............................................................................................................................11
⊘ This is a preview!⊘
Do you want full access?
Subscribe today to unlock all pages.
Trusted by 1+ million students worldwide
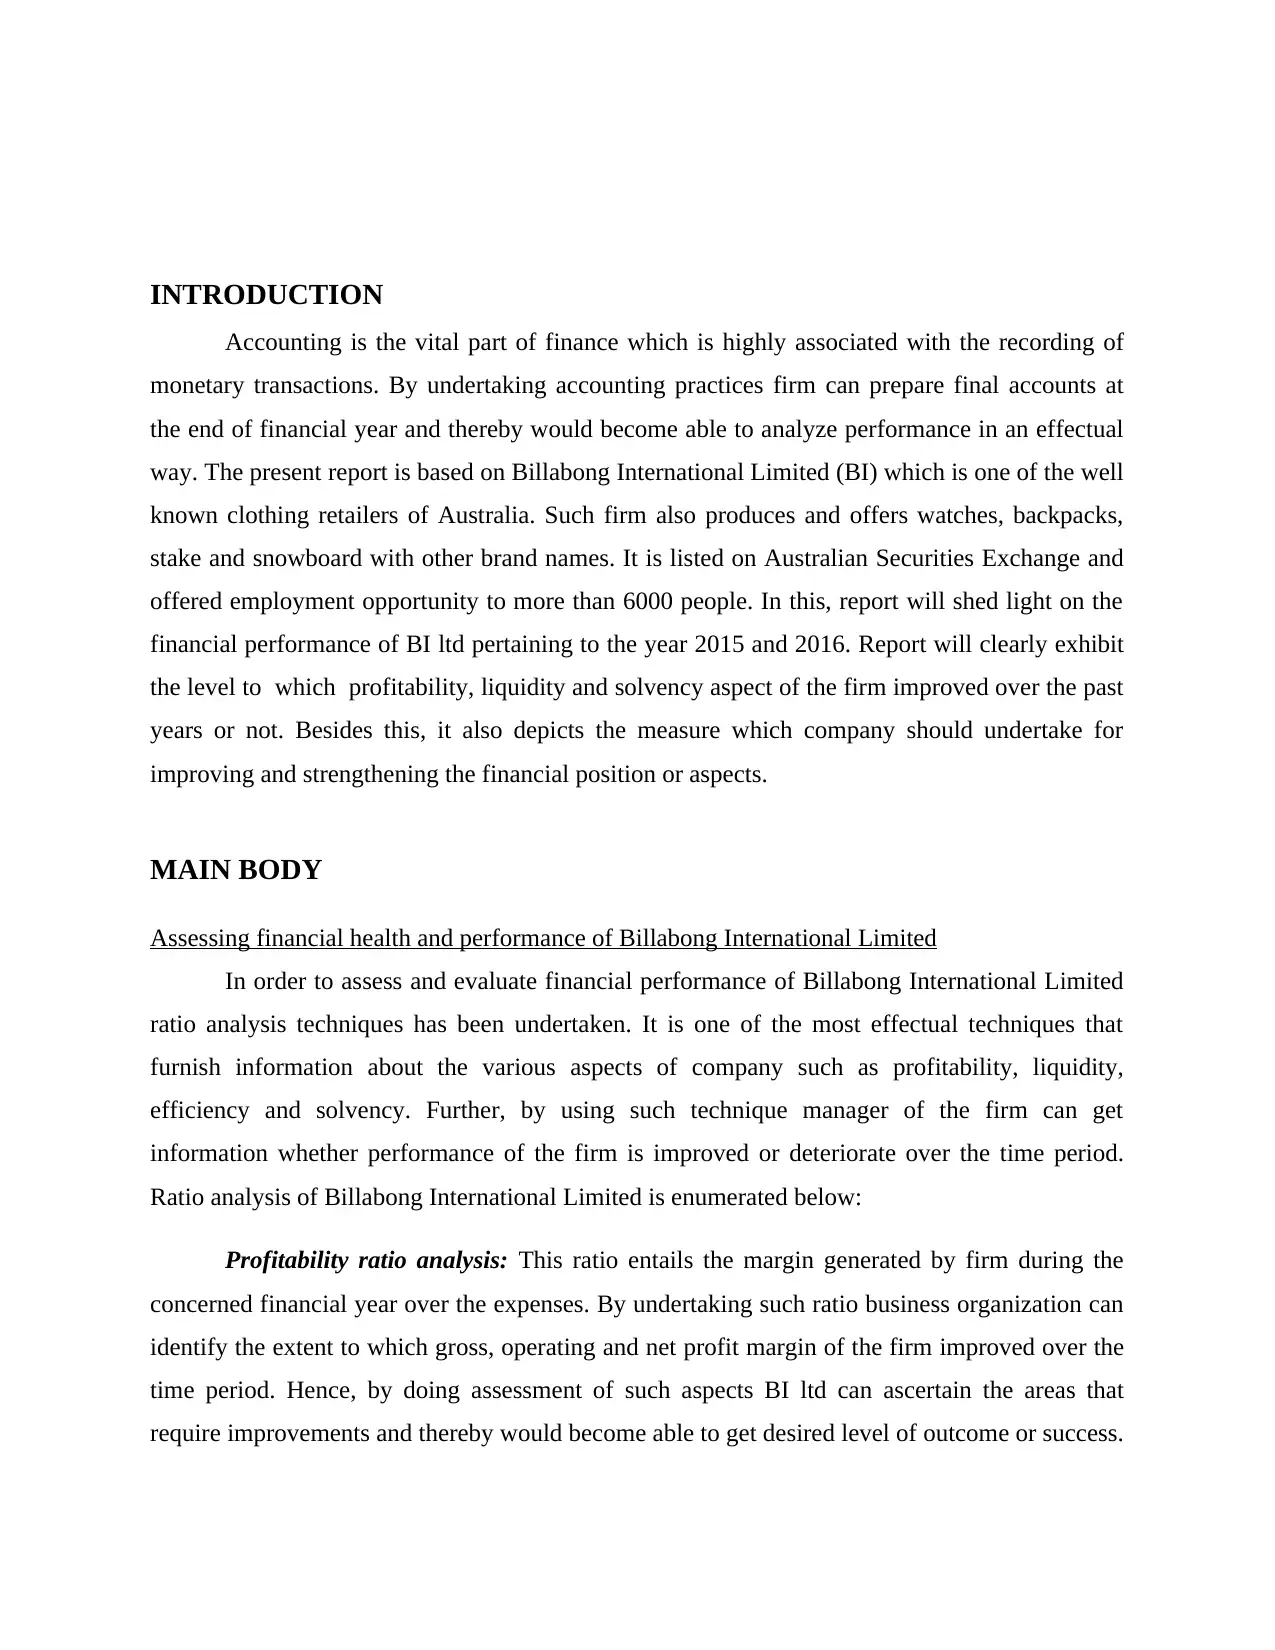
INTRODUCTION
Accounting is the vital part of finance which is highly associated with the recording of
monetary transactions. By undertaking accounting practices firm can prepare final accounts at
the end of financial year and thereby would become able to analyze performance in an effectual
way. The present report is based on Billabong International Limited (BI) which is one of the well
known clothing retailers of Australia. Such firm also produces and offers watches, backpacks,
stake and snowboard with other brand names. It is listed on Australian Securities Exchange and
offered employment opportunity to more than 6000 people. In this, report will shed light on the
financial performance of BI ltd pertaining to the year 2015 and 2016. Report will clearly exhibit
the level to which profitability, liquidity and solvency aspect of the firm improved over the past
years or not. Besides this, it also depicts the measure which company should undertake for
improving and strengthening the financial position or aspects.
MAIN BODY
Assessing financial health and performance of Billabong International Limited
In order to assess and evaluate financial performance of Billabong International Limited
ratio analysis techniques has been undertaken. It is one of the most effectual techniques that
furnish information about the various aspects of company such as profitability, liquidity,
efficiency and solvency. Further, by using such technique manager of the firm can get
information whether performance of the firm is improved or deteriorate over the time period.
Ratio analysis of Billabong International Limited is enumerated below:
Profitability ratio analysis: This ratio entails the margin generated by firm during the
concerned financial year over the expenses. By undertaking such ratio business organization can
identify the extent to which gross, operating and net profit margin of the firm improved over the
time period. Hence, by doing assessment of such aspects BI ltd can ascertain the areas that
require improvements and thereby would become able to get desired level of outcome or success.
Paraphrase This Document
Need a fresh take? Get an instant paraphrase of this document with our AI Paraphraser
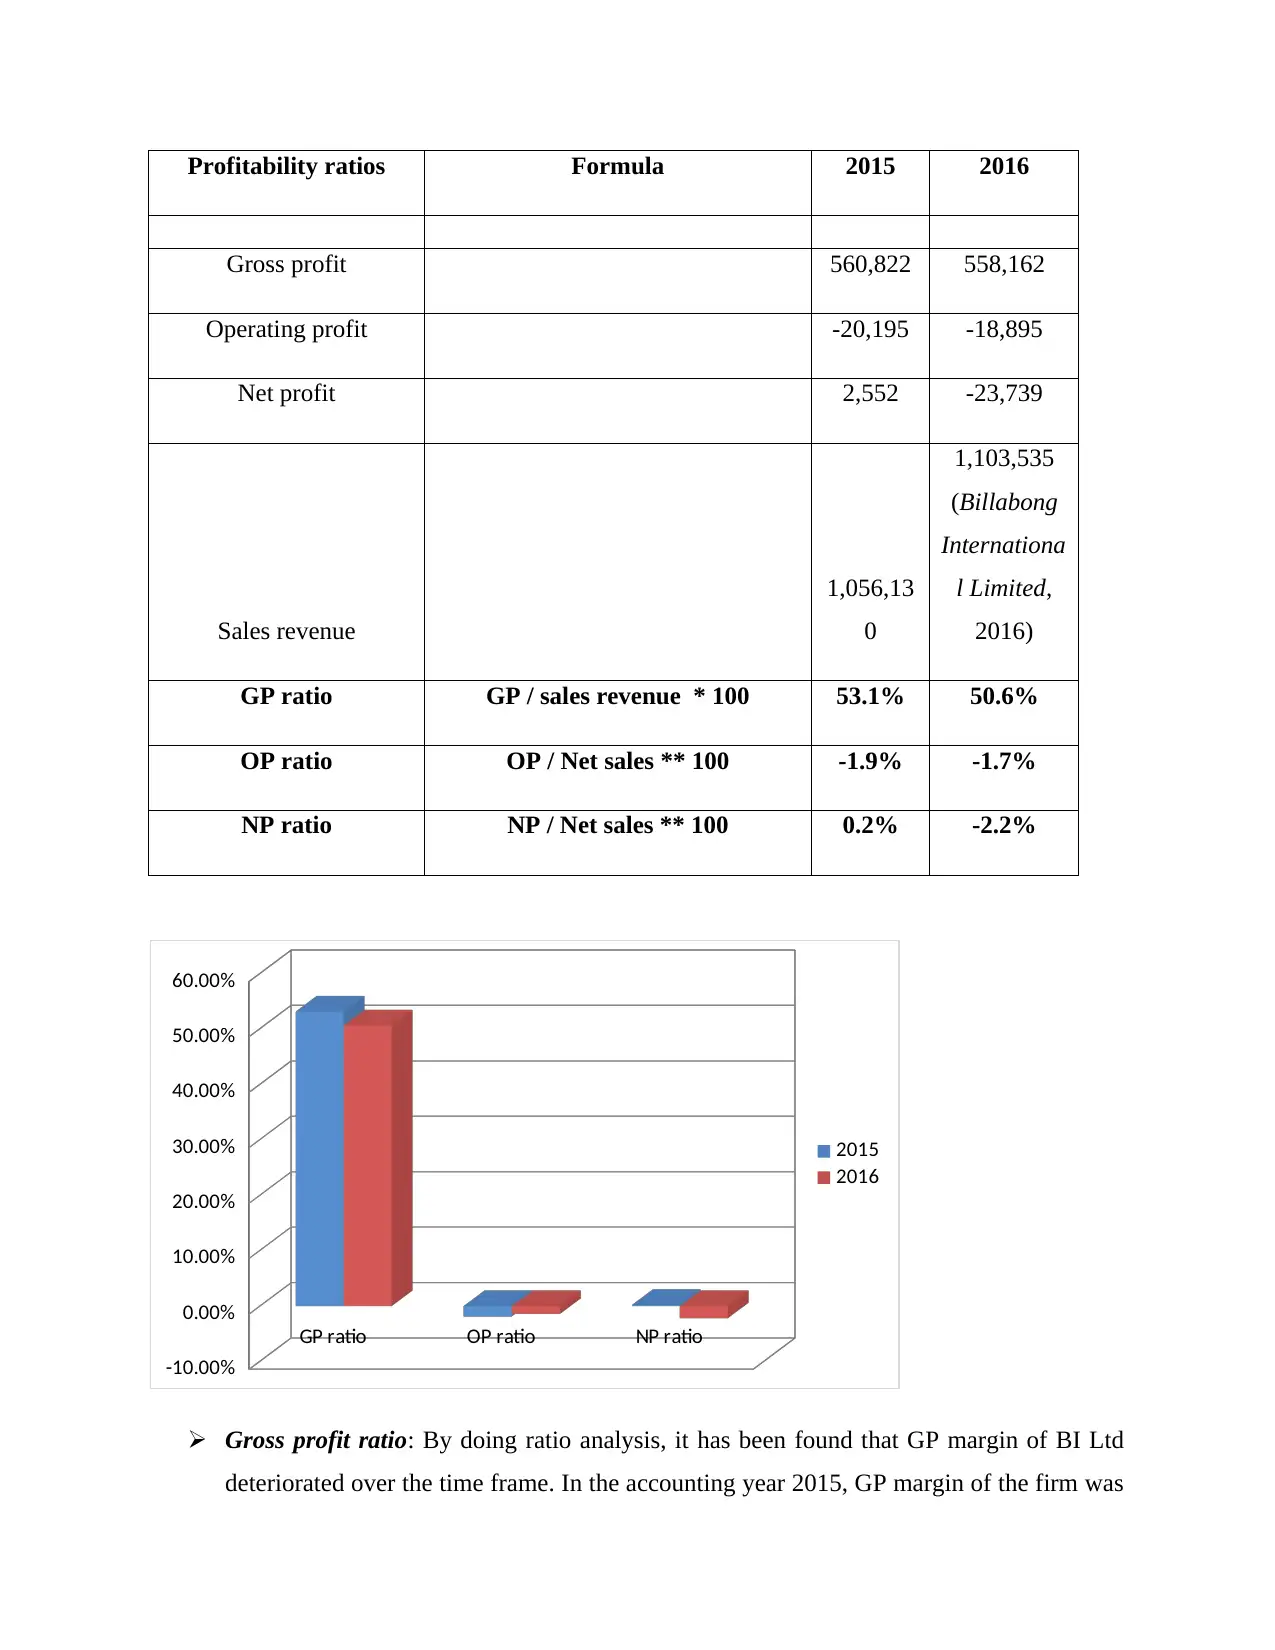
Profitability ratios Formula 2015 2016
Gross profit 560,822 558,162
Operating profit -20,195 -18,895
Net profit 2,552 -23,739
Sales revenue
1,056,13
0
1,103,535
(Billabong
Internationa
l Limited,
2016)
GP ratio GP / sales revenue * 100 53.1% 50.6%
OP ratio OP / Net sales ** 100 -1.9% -1.7%
NP ratio NP / Net sales ** 100 0.2% -2.2%
GP ratio OP ratio NP ratio
-10.00%
0.00%
10.00%
20.00%
30.00%
40.00%
50.00%
60.00%
2015
2016
Gross profit ratio: By doing ratio analysis, it has been found that GP margin of BI Ltd
deteriorated over the time frame. In the accounting year 2015, GP margin of the firm was
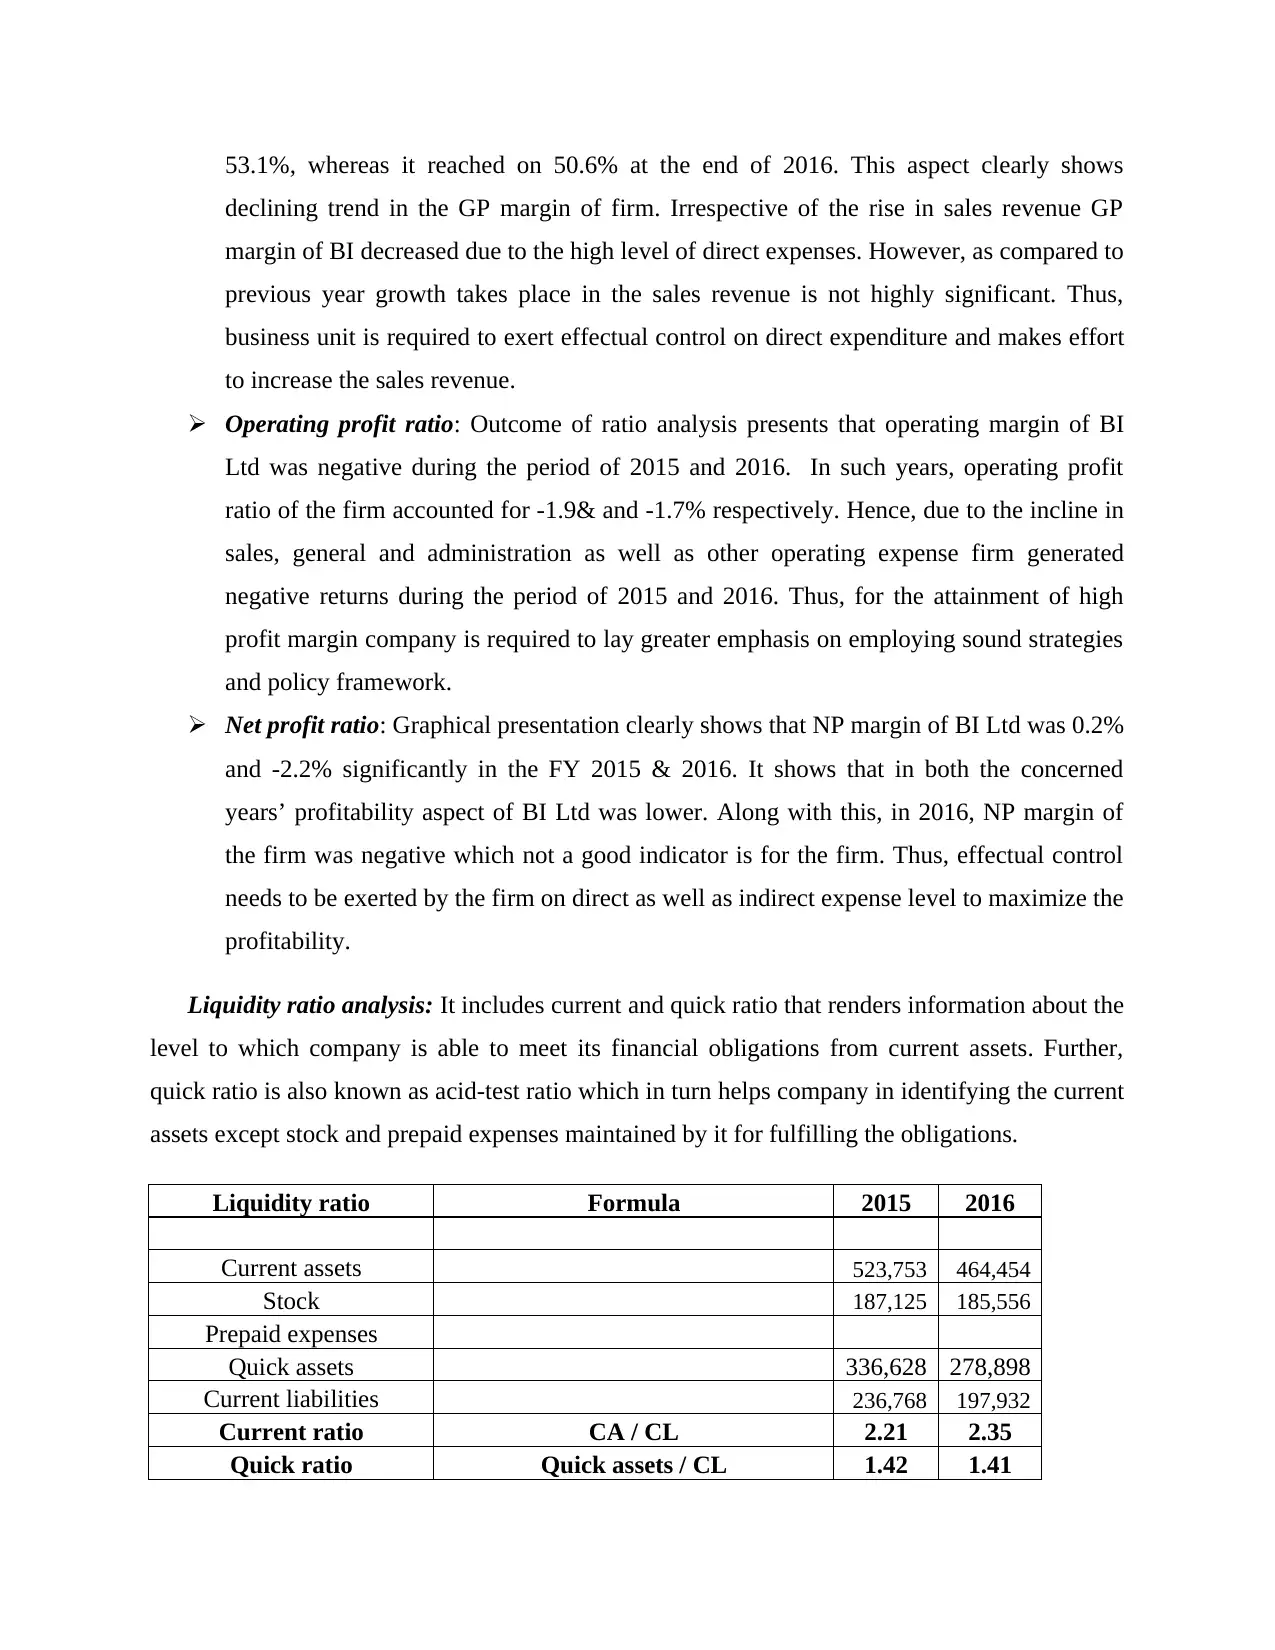
53.1%, whereas it reached on 50.6% at the end of 2016. This aspect clearly shows
declining trend in the GP margin of firm. Irrespective of the rise in sales revenue GP
margin of BI decreased due to the high level of direct expenses. However, as compared to
previous year growth takes place in the sales revenue is not highly significant. Thus,
business unit is required to exert effectual control on direct expenditure and makes effort
to increase the sales revenue.
Operating profit ratio: Outcome of ratio analysis presents that operating margin of BI
Ltd was negative during the period of 2015 and 2016. In such years, operating profit
ratio of the firm accounted for -1.9& and -1.7% respectively. Hence, due to the incline in
sales, general and administration as well as other operating expense firm generated
negative returns during the period of 2015 and 2016. Thus, for the attainment of high
profit margin company is required to lay greater emphasis on employing sound strategies
and policy framework.
Net profit ratio: Graphical presentation clearly shows that NP margin of BI Ltd was 0.2%
and -2.2% significantly in the FY 2015 & 2016. It shows that in both the concerned
years’ profitability aspect of BI Ltd was lower. Along with this, in 2016, NP margin of
the firm was negative which not a good indicator is for the firm. Thus, effectual control
needs to be exerted by the firm on direct as well as indirect expense level to maximize the
profitability.
Liquidity ratio analysis: It includes current and quick ratio that renders information about the
level to which company is able to meet its financial obligations from current assets. Further,
quick ratio is also known as acid-test ratio which in turn helps company in identifying the current
assets except stock and prepaid expenses maintained by it for fulfilling the obligations.
Liquidity ratio Formula 2015 2016
Current assets 523,753 464,454
Stock 187,125 185,556
Prepaid expenses
Quick assets 336,628 278,898
Current liabilities 236,768 197,932
Current ratio CA / CL 2.21 2.35
Quick ratio Quick assets / CL 1.42 1.41
⊘ This is a preview!⊘
Do you want full access?
Subscribe today to unlock all pages.
Trusted by 1+ million students worldwide

2015 2016
0
0.5
1
1.5
2
2.5
Current ratio
Quick ratio
Current ratio: Results of ratio analysis shows that current ratio of BI Ltd increased in
2016 as compared to 2015. Moreover, in the year of 2016, current ratio of the firm
increased from 2.21:1 to 2.35:1. Hence, during both the periods, current ratio of the firm
was equal to the ideal ratio such as 2:1. By considering this, it can be stated that
corporation has maintained 2 current assets for meeting an obligation. This aspect clearly
shows that liquidity position of BI Ltd was sound in both the financial years. Quick ratio: By making assessment of financial statements it has been identified that
quick ratio of BI Ltd was constant during both the years 2015 and 2016 such as 1.4:1. In
comparison to ideal ratio such as .5:1, company’s quick ratio was high. Moreover, ideal
ratio entails that firm should have 1 current asset except inventory and prepaid expenses
for meeting its quick obligations (Zhu and et.al., 2015). Thus, quick ratio assessed
through ratio analysis clearly exhibits that firm were highly capable to meet its current
obligations from quick assets in 2015 & 2016.
Efficiency ratio analysis: Such measure provides high level of assistance to the business unit
in analyzing how well it used assets and liabilities internally during the specific period. Hence,
by undertaking efficiency ratios business unit can identify the extent to which assets are utilized
effectually for the generation of income.
Efficiency ratio Formula 2015 2016
Paraphrase This Document
Need a fresh take? Get an instant paraphrase of this document with our AI Paraphraser
Total assets 803,980 744,248
Fixed assets 280,227 279,794
Sales revenue 1,056,130 1,103,535
Inventory 187,125 185,556
Average stock 187,125 186340.5
COGS 495308 545373
Total assets turnover
ratio Total assets / net sales 0.76 0.67
Fixed assets turnover
ratio Fixed assets / net sales 0.27 0.25
Stock turnover ratio COGS / Average inventory 2.65 2.93
Total assets turnover
ratio Fixed assets
turnover ratio Stock turnover ratio
0
0.5
1
1.5
2
2.5
3
2015
2016
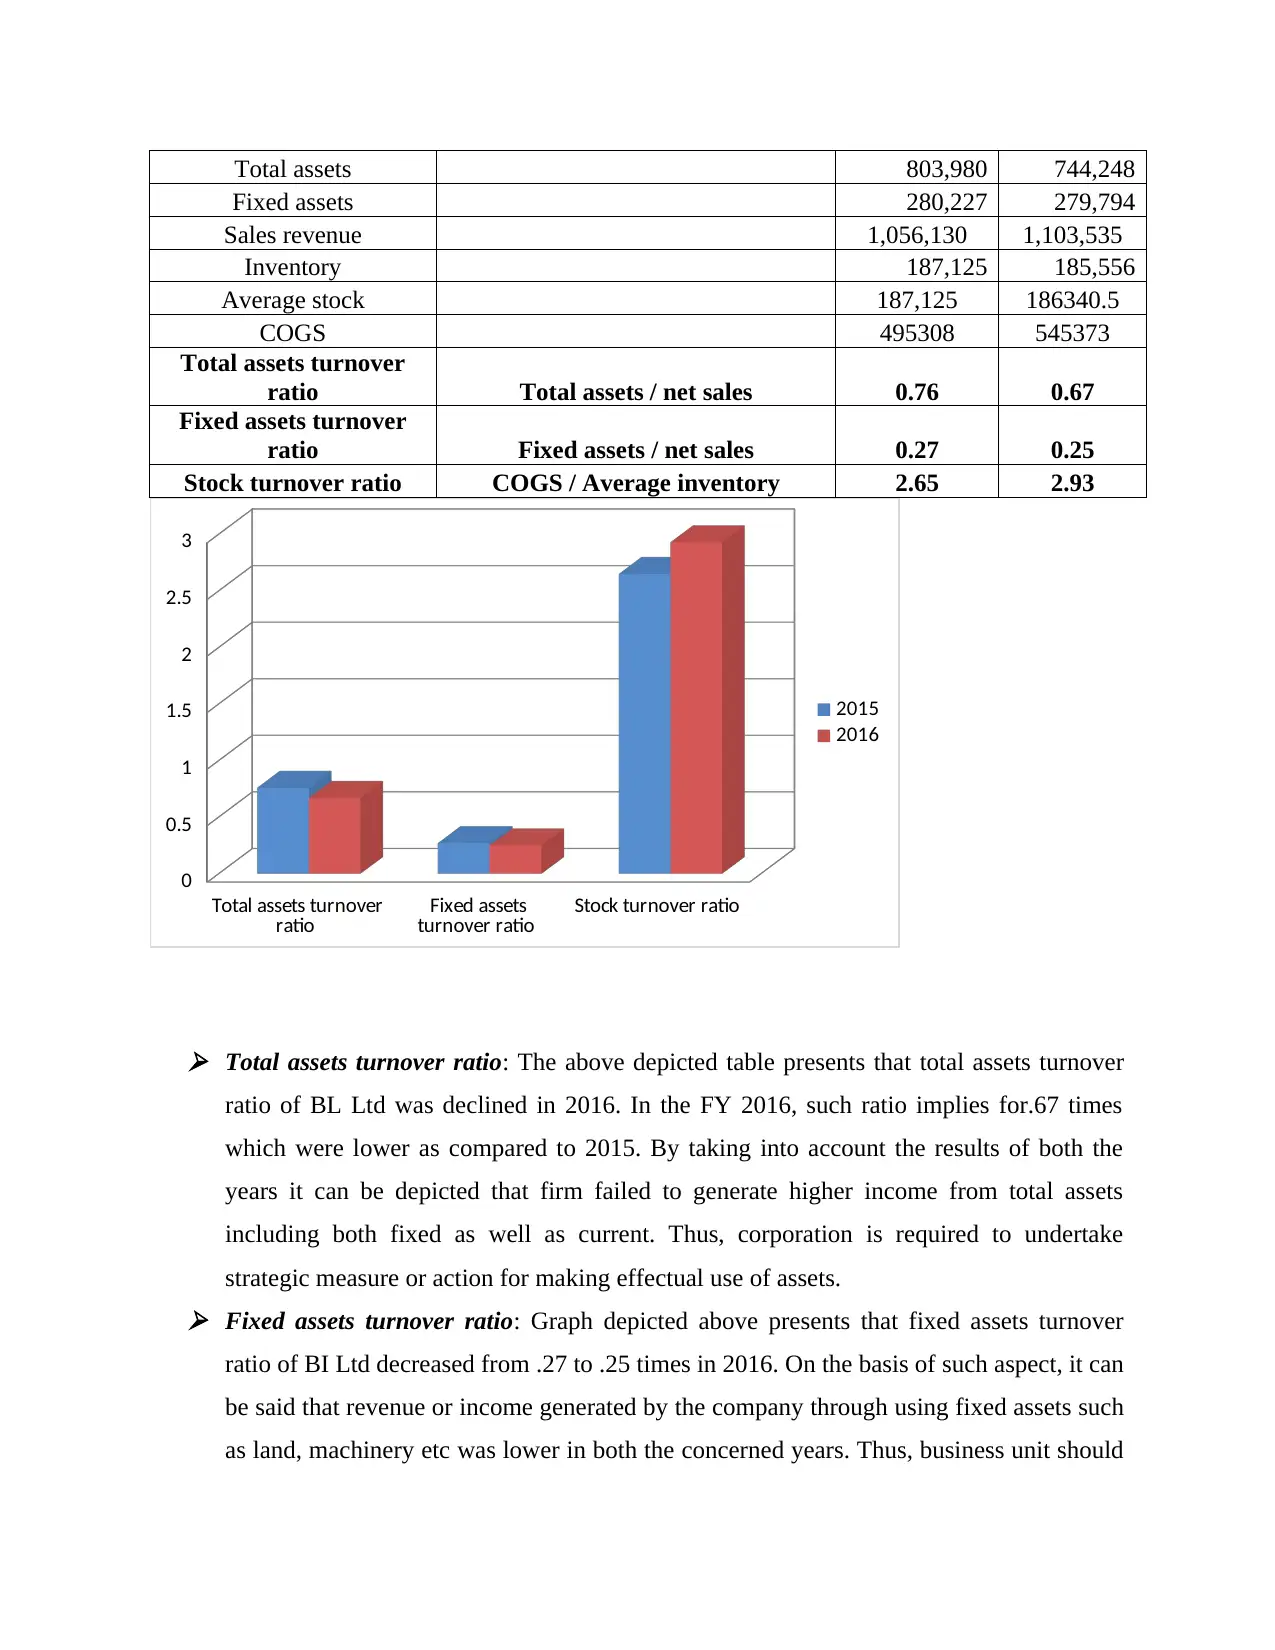
Total assets turnover ratio: The above depicted table presents that total assets turnover
ratio of BL Ltd was declined in 2016. In the FY 2016, such ratio implies for.67 times
which were lower as compared to 2015. By taking into account the results of both the
years it can be depicted that firm failed to generate higher income from total assets
including both fixed as well as current. Thus, corporation is required to undertake
strategic measure or action for making effectual use of assets. Fixed assets turnover ratio: Graph depicted above presents that fixed assets turnover
ratio of BI Ltd decreased from .27 to .25 times in 2016. On the basis of such aspect, it can
be said that revenue or income generated by the company through using fixed assets such
as land, machinery etc was lower in both the concerned years. Thus, business unit should
Fixed assets 280,227 279,794
Sales revenue 1,056,130 1,103,535
Inventory 187,125 185,556
Average stock 187,125 186340.5
COGS 495308 545373
Total assets turnover
ratio Total assets / net sales 0.76 0.67
Fixed assets turnover
ratio Fixed assets / net sales 0.27 0.25
Stock turnover ratio COGS / Average inventory 2.65 2.93
Total assets turnover
ratio Fixed assets
turnover ratio Stock turnover ratio
0
0.5
1
1.5
2
2.5
3
2015
2016
Total assets turnover ratio: The above depicted table presents that total assets turnover
ratio of BL Ltd was declined in 2016. In the FY 2016, such ratio implies for.67 times
which were lower as compared to 2015. By taking into account the results of both the
years it can be depicted that firm failed to generate higher income from total assets
including both fixed as well as current. Thus, corporation is required to undertake
strategic measure or action for making effectual use of assets. Fixed assets turnover ratio: Graph depicted above presents that fixed assets turnover
ratio of BI Ltd decreased from .27 to .25 times in 2016. On the basis of such aspect, it can
be said that revenue or income generated by the company through using fixed assets such
as land, machinery etc was lower in both the concerned years. Thus, business unit should

focus on the maintenance of machinery which in turn helps in maximizing both
productivity as well as profitability. Inventory turnover ratio: It has found from financial statement analysis that inventory
turnover ratio of BI Ltd inclined from 2.65 times to 2.93 times. It shows that company is
effectually controlling its merchandise. It also reflects that company has avoided wastage
related to inventory. However, still inventory turnover ratio of the firm was not highly
sound (Inventory Turnover Ratio, 2017). Thus, corporation is needed to undertake
suitable actions that aid in the profit, growth and success of the firm. On the basis of
overall assessment it can be depicted that inventory turnover ratio of firm was good in
2015 and 2016 but not highly sound.
Gearing ratio analysis: It is also considered as debt-equity ratio that gives detail about the
extent to which funds were raised by the firm through equity and debt sources. By evaluating
such aspects business unit measure its solvency aspect. Hence, by dividing debt from
shareholders equity one can measure solvency aspect.
Gearing ratios Formula 2015 2016
Long term debt
259,95
0 266,209
Shareholders’ equity
281,58
4
259,289
(Billabong
Internation
al Limited,
2016)
Debt-equity ratio
Long term debt / shareholders
equity 0.92 1.03
⊘ This is a preview!⊘
Do you want full access?
Subscribe today to unlock all pages.
Trusted by 1+ million students worldwide
2015 2016
0.86
0.88
0.9
0.92
0.94
0.96
0.98
1
1.02
1.04
Debt-equity ratio
Debt-equity ratio
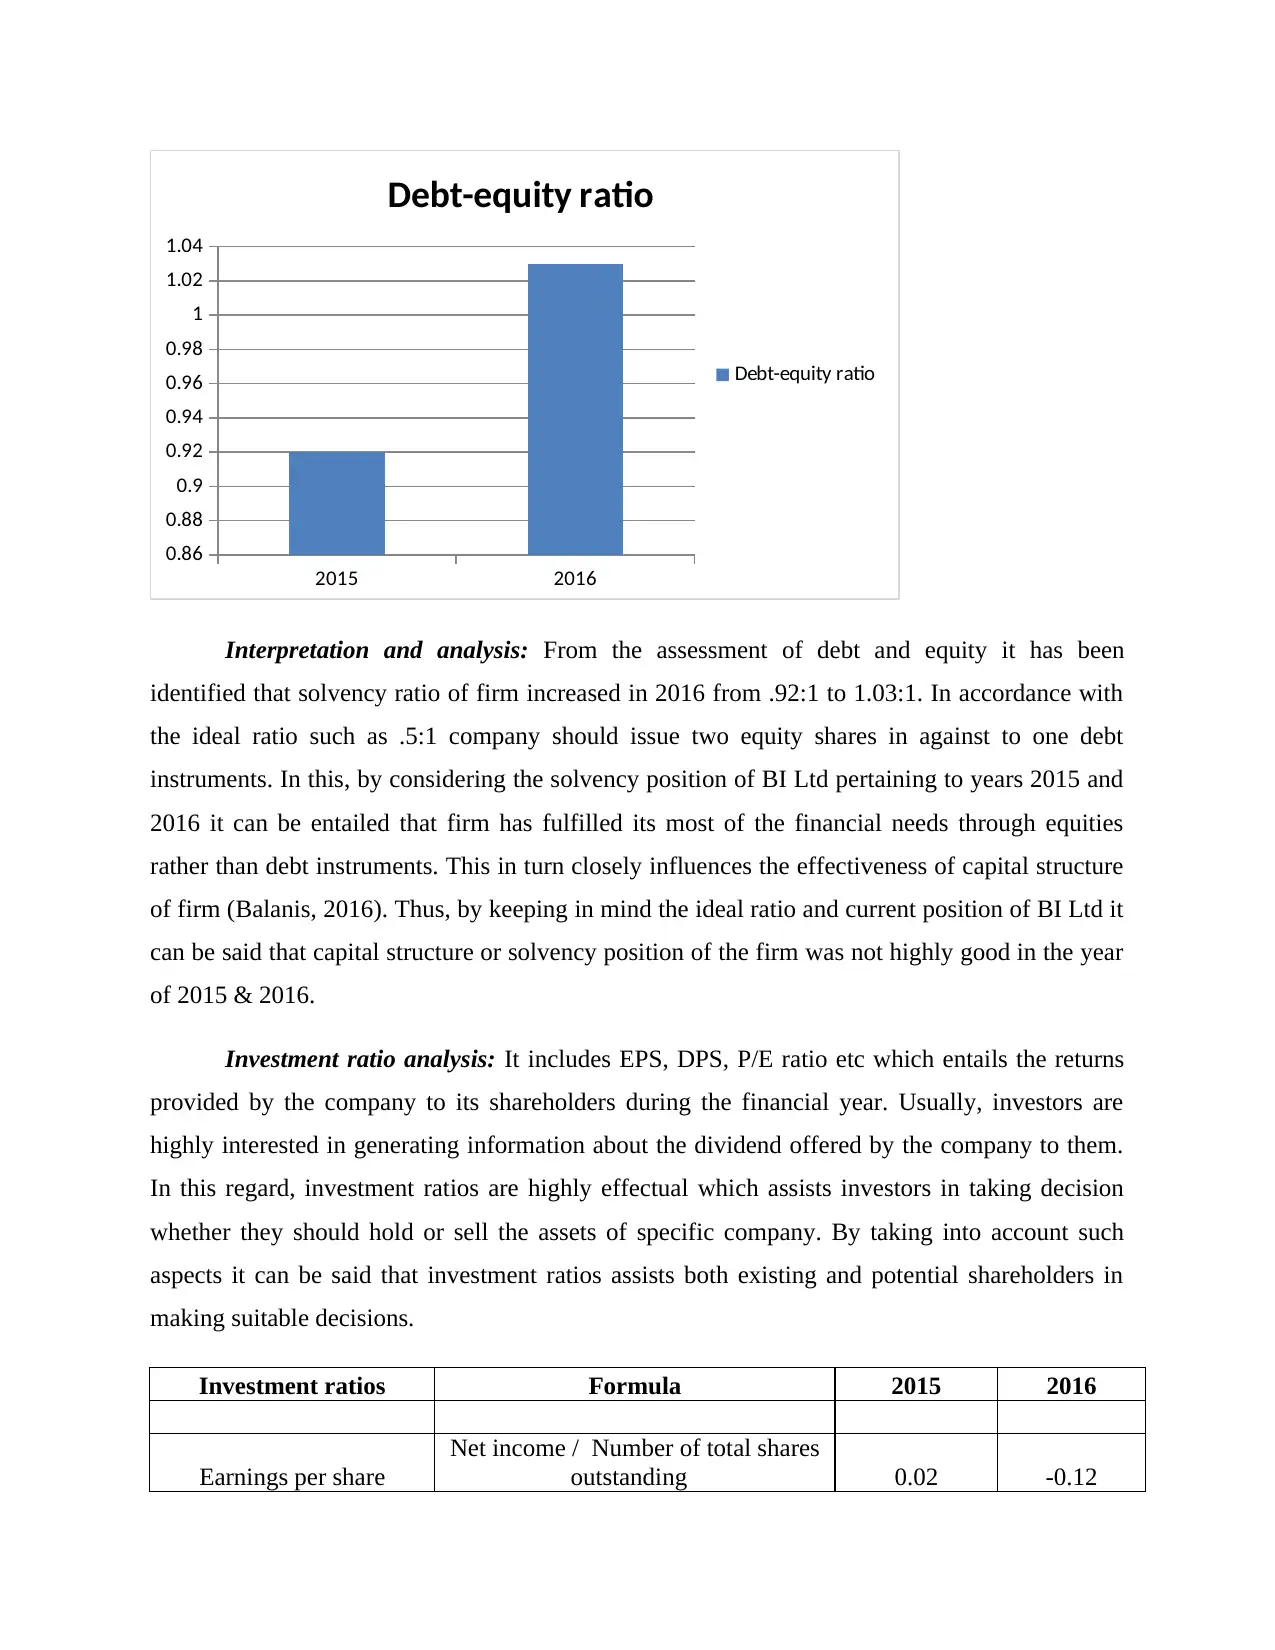
Interpretation and analysis: From the assessment of debt and equity it has been
identified that solvency ratio of firm increased in 2016 from .92:1 to 1.03:1. In accordance with
the ideal ratio such as .5:1 company should issue two equity shares in against to one debt
instruments. In this, by considering the solvency position of BI Ltd pertaining to years 2015 and
2016 it can be entailed that firm has fulfilled its most of the financial needs through equities
rather than debt instruments. This in turn closely influences the effectiveness of capital structure
of firm (Balanis, 2016). Thus, by keeping in mind the ideal ratio and current position of BI Ltd it
can be said that capital structure or solvency position of the firm was not highly good in the year
of 2015 & 2016.
Investment ratio analysis: It includes EPS, DPS, P/E ratio etc which entails the returns
provided by the company to its shareholders during the financial year. Usually, investors are
highly interested in generating information about the dividend offered by the company to them.
In this regard, investment ratios are highly effectual which assists investors in taking decision
whether they should hold or sell the assets of specific company. By taking into account such
aspects it can be said that investment ratios assists both existing and potential shareholders in
making suitable decisions.
Investment ratios Formula 2015 2016
Earnings per share
Net income / Number of total shares
outstanding 0.02 -0.12
0.86
0.88
0.9
0.92
0.94
0.96
0.98
1
1.02
1.04
Debt-equity ratio
Debt-equity ratio
Interpretation and analysis: From the assessment of debt and equity it has been
identified that solvency ratio of firm increased in 2016 from .92:1 to 1.03:1. In accordance with
the ideal ratio such as .5:1 company should issue two equity shares in against to one debt
instruments. In this, by considering the solvency position of BI Ltd pertaining to years 2015 and
2016 it can be entailed that firm has fulfilled its most of the financial needs through equities
rather than debt instruments. This in turn closely influences the effectiveness of capital structure
of firm (Balanis, 2016). Thus, by keeping in mind the ideal ratio and current position of BI Ltd it
can be said that capital structure or solvency position of the firm was not highly good in the year
of 2015 & 2016.
Investment ratio analysis: It includes EPS, DPS, P/E ratio etc which entails the returns
provided by the company to its shareholders during the financial year. Usually, investors are
highly interested in generating information about the dividend offered by the company to them.
In this regard, investment ratios are highly effectual which assists investors in taking decision
whether they should hold or sell the assets of specific company. By taking into account such
aspects it can be said that investment ratios assists both existing and potential shareholders in
making suitable decisions.
Investment ratios Formula 2015 2016
Earnings per share
Net income / Number of total shares
outstanding 0.02 -0.12
Paraphrase This Document
Need a fresh take? Get an instant paraphrase of this document with our AI Paraphraser
Dividend per share
Annual dividend paid / Number of
shares outstanding - -
2015 2016
-0.14
-0.12
-0.1
-0.08
-0.06
-0.04
-0.02
0
0.02
0.04
Earnings per share
Earnings per share
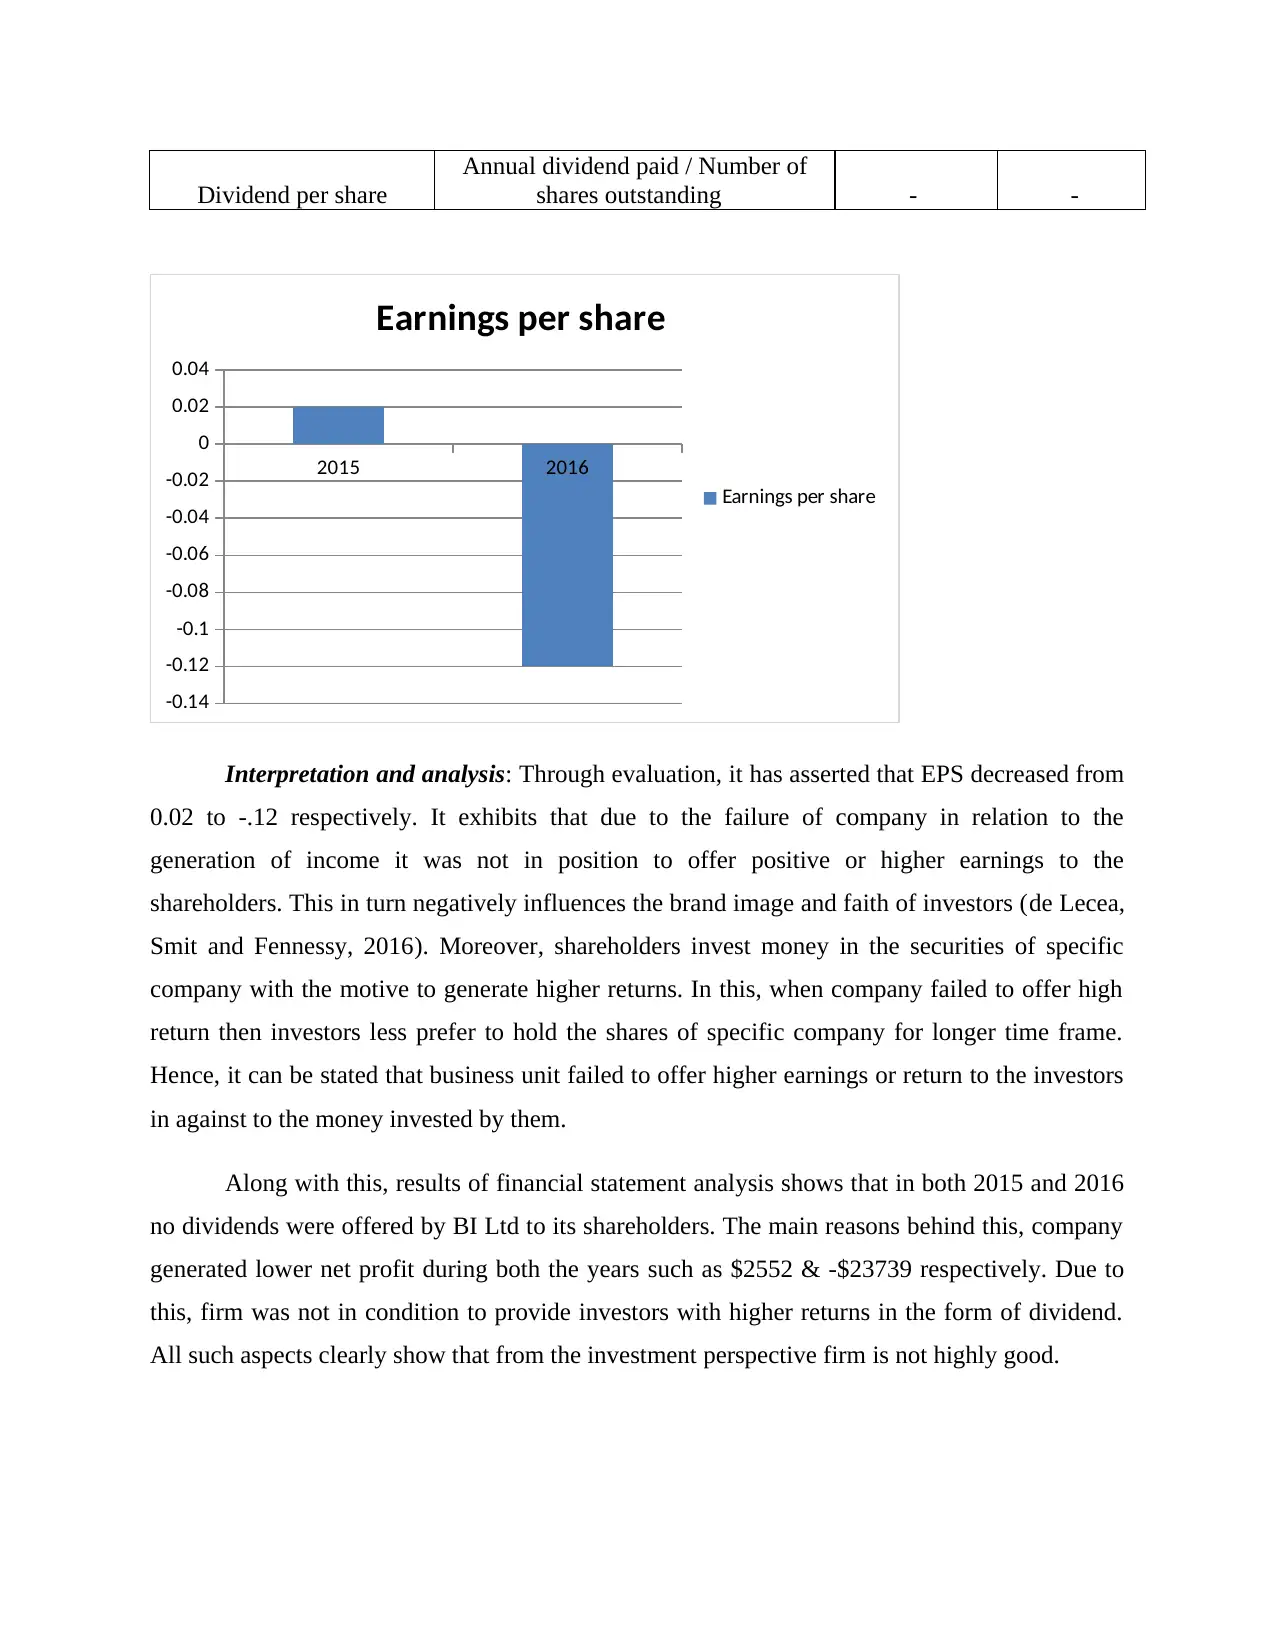
Interpretation and analysis: Through evaluation, it has asserted that EPS decreased from
0.02 to -.12 respectively. It exhibits that due to the failure of company in relation to the
generation of income it was not in position to offer positive or higher earnings to the
shareholders. This in turn negatively influences the brand image and faith of investors (de Lecea,
Smit and Fennessy, 2016). Moreover, shareholders invest money in the securities of specific
company with the motive to generate higher returns. In this, when company failed to offer high
return then investors less prefer to hold the shares of specific company for longer time frame.
Hence, it can be stated that business unit failed to offer higher earnings or return to the investors
in against to the money invested by them.
Along with this, results of financial statement analysis shows that in both 2015 and 2016
no dividends were offered by BI Ltd to its shareholders. The main reasons behind this, company
generated lower net profit during both the years such as $2552 & -$23739 respectively. Due to
this, firm was not in condition to provide investors with higher returns in the form of dividend.
All such aspects clearly show that from the investment perspective firm is not highly good.
Annual dividend paid / Number of
shares outstanding - -
2015 2016
-0.14
-0.12
-0.1
-0.08
-0.06
-0.04
-0.02
0
0.02
0.04
Earnings per share
Earnings per share
Interpretation and analysis: Through evaluation, it has asserted that EPS decreased from
0.02 to -.12 respectively. It exhibits that due to the failure of company in relation to the
generation of income it was not in position to offer positive or higher earnings to the
shareholders. This in turn negatively influences the brand image and faith of investors (de Lecea,
Smit and Fennessy, 2016). Moreover, shareholders invest money in the securities of specific
company with the motive to generate higher returns. In this, when company failed to offer high
return then investors less prefer to hold the shares of specific company for longer time frame.
Hence, it can be stated that business unit failed to offer higher earnings or return to the investors
in against to the money invested by them.
Along with this, results of financial statement analysis shows that in both 2015 and 2016
no dividends were offered by BI Ltd to its shareholders. The main reasons behind this, company
generated lower net profit during both the years such as $2552 & -$23739 respectively. Due to
this, firm was not in condition to provide investors with higher returns in the form of dividend.
All such aspects clearly show that from the investment perspective firm is not highly good.
CONCLUSION
From the above report, it has been articulated that ratio analysis is highly significant
which helps in discovering suitable information for further decision making. It can be seen in the
report that profitability aspect of BI Ltd was not good in the year of 2015 and 2016. Further, it
has been articulated that company has marinated enough liquidity within the firm and able to
meet current obligations on due date. Besides this, it can be inferred that solvency, efficiency and
investment ratios of the firm are not highly good. It can be stated from overall evaluation that
financial performance of BI Ltd was not good in the year of 2015 and 2016. Thus, for attracting
large number of investors and maintaining the faith of other stakeholders firm is required to
make modifications in the existing strategies as per market trend, customers expectations and
competitors policies.
RECOMMENDATIONS
From financial statement analysis it has discovered that there are several areas of finance
that demand for improvements. Thus, for making improvement in the profitability, liquidity,
efficiency, solvency and investment aspect BI Ltd should work on the following aspects:
On the basis of the outcome of ratio analysis, it is recommended to BI Ltd to employ
budgeting tools and techniques for controlling both direct as well as indirect expenditure.
Moreover, budget or financial framework provides deeper insight to the personnel about
the money they should spend in different areas such as sales, administration etc. In this,
by comparing actual spending with the budgeted figures on a periodical basis firm can
assess deviations and thereby would become able to take effectual measures for
improvement (Zimmerman and Yahya-Zadeh, 2011). In this way, by undertaking
budgeting technique firm can reduce the level of both direct and indirect expenses.
Along with this, firm should lay emphasis on undertaking zero base budgeting which in
turn facilitates effective allocation of resources and thereby helps in avoiding
overspending to a great extent.
In addition to this, it is suggested to BI Ltd to make focus on investing current assets
other than stock and prepaid expenses in the productive activities. By this, firm would
⊘ This is a preview!⊘
Do you want full access?
Subscribe today to unlock all pages.
Trusted by 1+ million students worldwide
1 out of 14
Related Documents


Your All-in-One AI-Powered Toolkit for Academic Success.
+13062052269
info@desklib.com
Available 24*7 on WhatsApp / Email
![[object Object]](/_next/static/media/star-bottom.7253800d.svg)
Unlock your academic potential
Copyright © 2020–2026 A2Z Services. All Rights Reserved. Developed and managed by ZUCOL.