BUACC1508 Group Assignment: Billabong Performance Evaluation Report
VerifiedAdded on 2022/10/19
|11
|3186
|383
Report
AI Summary
This report presents a comprehensive performance evaluation of Billabong International, focusing on its financial performance from 2016 to the half-year of 2018. The analysis utilizes ratio analysis, covering profitability, efficiency, liquidity, gearing, and investment ratios. The report highlights the company's poor profitability, particularly the losses incurred during the analyzed period, and provides insights into the reasons behind these losses, including impairment charges and divestments. Efficiency and liquidity ratios present a mixed picture, while gearing ratios indicate overleveraging and an inability to meet interest obligations. The report concludes with recommendations for management and investors, emphasizing the need for proactive measures to improve profitability and divest non-value-accretive brands. The report also suggests that investors should avoid the stock until the company demonstrates a turnaround. The analysis is based on the provided financial statements and aims to provide a detailed understanding of Billabong's financial health and operational efficiency during the specified period.
PERFORMANCE EVALUATION
BILLABONG INTERNATIONAL
STUDENT ID:
[Pick the date]
BILLABONG INTERNATIONAL
STUDENT ID:
[Pick the date]
Paraphrase This Document
Need a fresh take? Get an instant paraphrase of this document with our AI Paraphraser
PERFORMANCE EVALUATION
Table of Contents
Executive Summary...................................................................................................................2
Company Overview...................................................................................................................2
Ratio Analysis............................................................................................................................2
Profitability Ratios..................................................................................................................2
Efficiency Ratios....................................................................................................................3
Liquidity Ratios......................................................................................................................5
Gearing Ratios........................................................................................................................5
Investment Ratios...................................................................................................................6
Conclusions & Findings.............................................................................................................6
Recommendations......................................................................................................................7
Appendixes.................................................................................................................................8
Appendix 1: Summary of ratios.............................................................................................8
Appendix 2: Data used for ratio computation........................................................................9
References................................................................................................................................10
1
PERFORMANCE EVALUATION
Executive Summary
The objective of the given report is to carry out a ratio analysis of Billabong International
considering the financial statements for 2016, 2017 and half year 2018 so as to offer
recommendations to management as well as investors. The ratio analysis indicates that the
key concern for the company is poor profitability ratios as the company has made losses for
all the three periods. The liquidity and efficiency ratios of the company do not pose any issue.
However, the gearing ratios indicate overleveraging of balance sheet and inability of meet
interest obligations. As a result, it has been recommended that management should take
proactive measures to enhance profitability and divest in various brands that are not value
accretive. Further, a strategic investor may also be brought on board. Till the time the
company is able to bring about a turnaround, the investors should stay away from the stock.
Company Overview
Billabong International was established as a clothing business in 1973. The company did not
diversify into other businesses till the time it got listed in 2000 on ASX. Soon after, the
company diversified by entering into skateboard products for which it made a host of
acquisitions which included both international as well as domestic businesses. The
acquisition timing of these businesses was not appropriate as the company acquired these
businesses at lofty premiums. However, soon after, there was the global economic crisis in
2008 which had a significant adverse impact on the business. Owing to this, the goodwill
recorded on the acquisitions had to be impaired which led to hefty losses by the company.
The company also sold off some of the businesses in order to make the business profitable.
There was a management change in 2013 and the company did manage to post profits in 2014
and 2015 (Billabong, 2016). The current report aims to carry out a ratio analysis of the
company based on financial statements for 2016, 2017 and 2018 (half year). Based on the
ratio analysis, recommendations would be offered to both investors as well the management
of the company.
Ratio Analysis
In order to analyse the financial and operational performance of the company from July 1,
2015 to December 31, 2017, a ratio analysis has been conducted. These ratios have been
computed which highlight different aspects of the performance of the company during the
above mentioned period. A detailed interpretation of these ratios is carried out below.
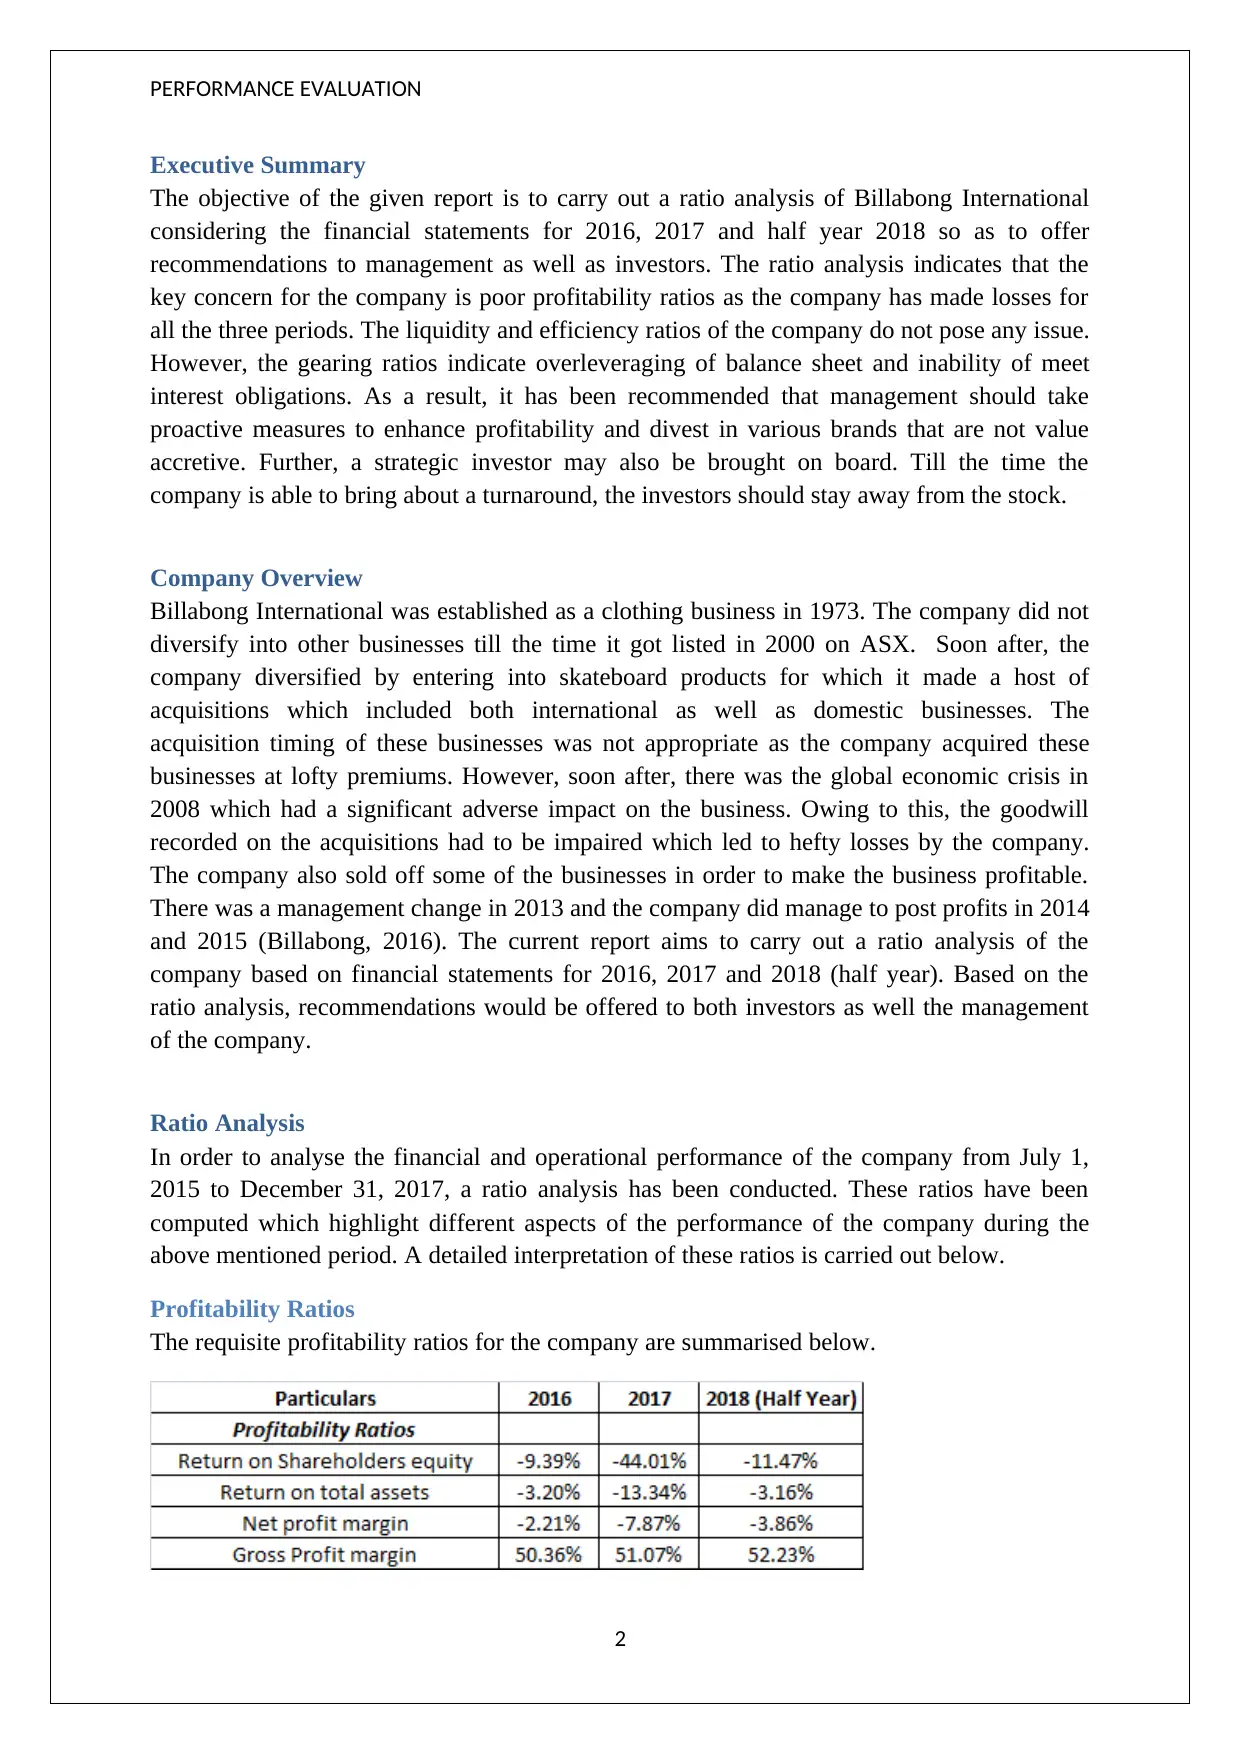
Profitability Ratios
The requisite profitability ratios for the company are summarised below.
2
Executive Summary
The objective of the given report is to carry out a ratio analysis of Billabong International
considering the financial statements for 2016, 2017 and half year 2018 so as to offer
recommendations to management as well as investors. The ratio analysis indicates that the
key concern for the company is poor profitability ratios as the company has made losses for
all the three periods. The liquidity and efficiency ratios of the company do not pose any issue.
However, the gearing ratios indicate overleveraging of balance sheet and inability of meet
interest obligations. As a result, it has been recommended that management should take
proactive measures to enhance profitability and divest in various brands that are not value
accretive. Further, a strategic investor may also be brought on board. Till the time the
company is able to bring about a turnaround, the investors should stay away from the stock.
Company Overview
Billabong International was established as a clothing business in 1973. The company did not
diversify into other businesses till the time it got listed in 2000 on ASX. Soon after, the
company diversified by entering into skateboard products for which it made a host of
acquisitions which included both international as well as domestic businesses. The
acquisition timing of these businesses was not appropriate as the company acquired these
businesses at lofty premiums. However, soon after, there was the global economic crisis in
2008 which had a significant adverse impact on the business. Owing to this, the goodwill
recorded on the acquisitions had to be impaired which led to hefty losses by the company.
The company also sold off some of the businesses in order to make the business profitable.
There was a management change in 2013 and the company did manage to post profits in 2014
and 2015 (Billabong, 2016). The current report aims to carry out a ratio analysis of the
company based on financial statements for 2016, 2017 and 2018 (half year). Based on the
ratio analysis, recommendations would be offered to both investors as well the management
of the company.
Ratio Analysis
In order to analyse the financial and operational performance of the company from July 1,
2015 to December 31, 2017, a ratio analysis has been conducted. These ratios have been
computed which highlight different aspects of the performance of the company during the
above mentioned period. A detailed interpretation of these ratios is carried out below.
Profitability Ratios
The requisite profitability ratios for the company are summarised below.
2
⊘ This is a preview!⊘
Do you want full access?
Subscribe today to unlock all pages.
Trusted by 1+ million students worldwide
PERFORMANCE EVALUATION
The only positive aspect for the company with regards to the profitability ratios is the fact
that gross profit margin has witnessed an improvement on a y-o-y basis. This improvement in
gross margins may be attributed to the global sourcing initiatives that have been undertaken
by the management in order to lower the cost of goods sold as a percentage of sales and
thereby expand profitability of business operations (Billabong, 2016).
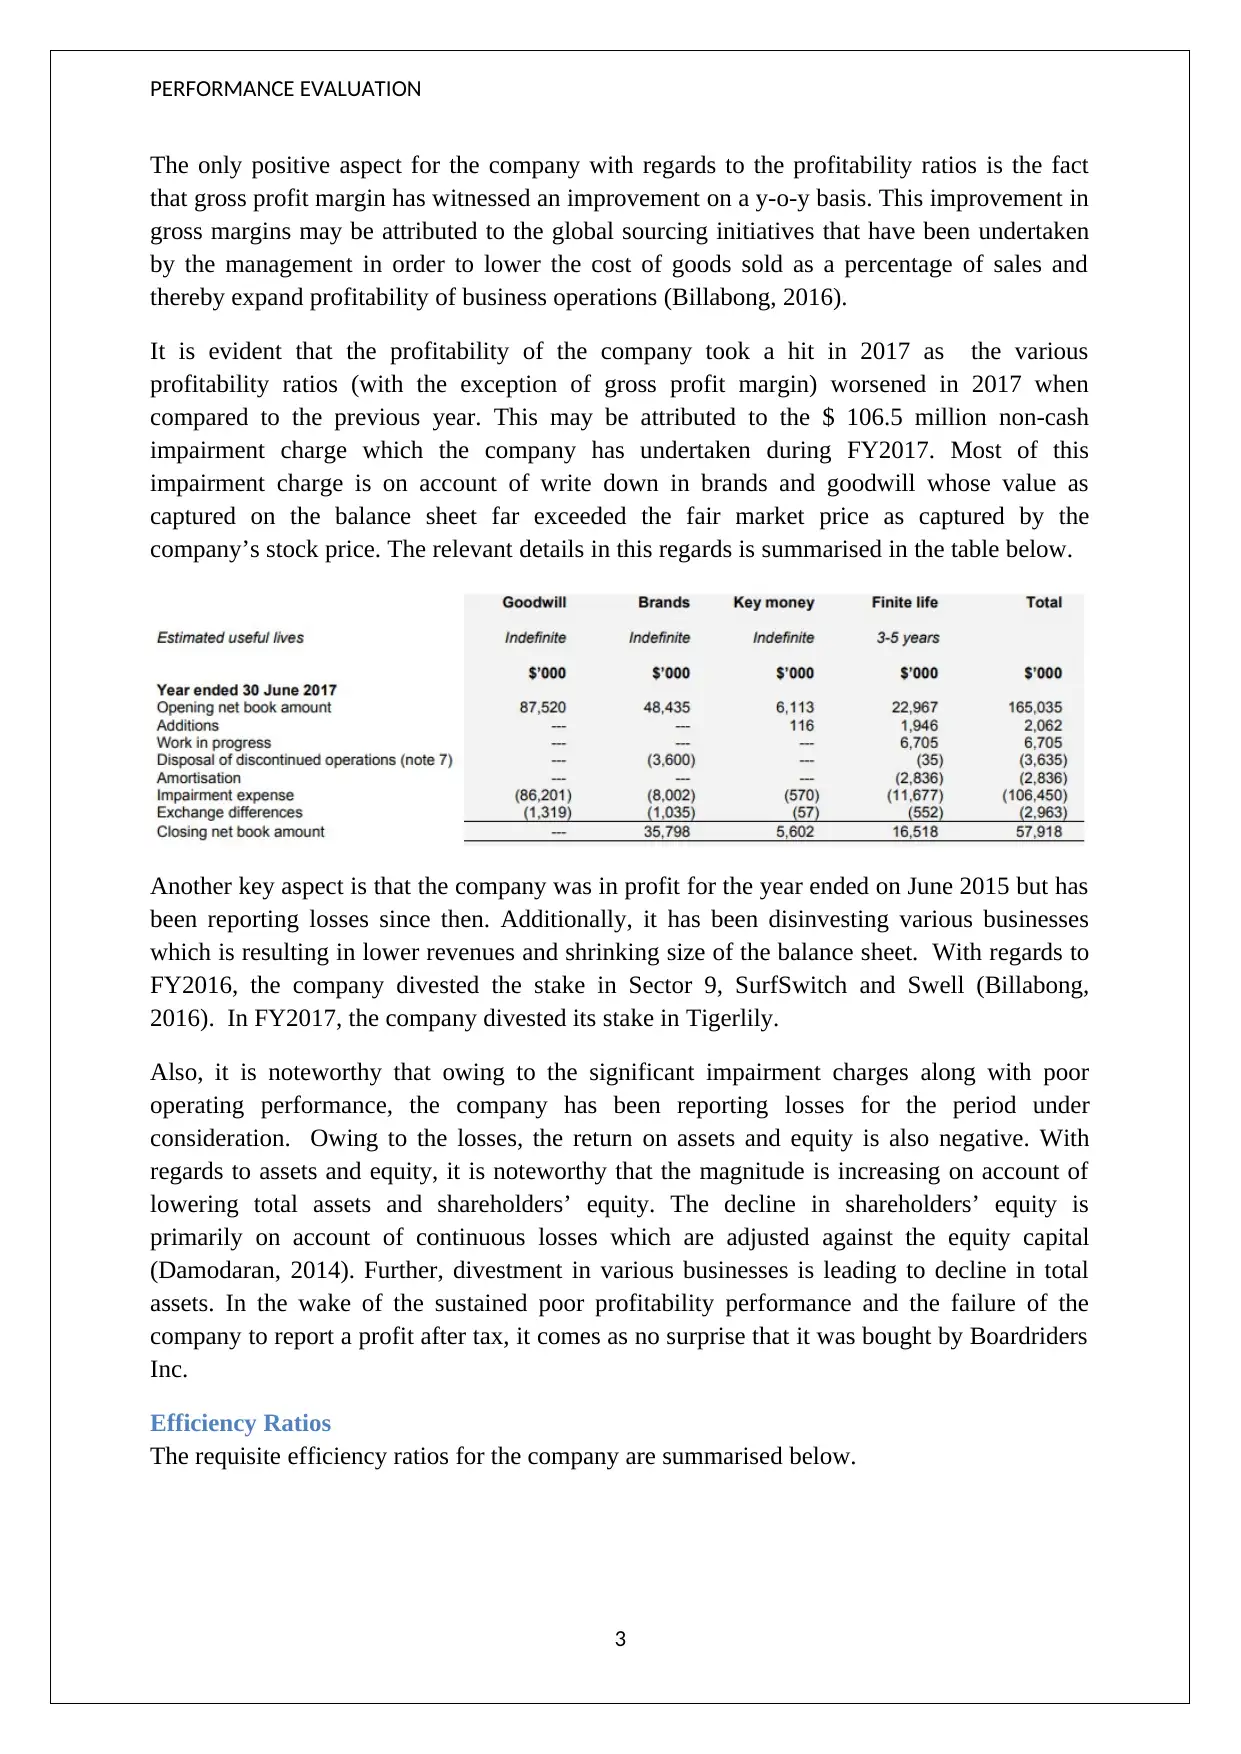
It is evident that the profitability of the company took a hit in 2017 as the various
profitability ratios (with the exception of gross profit margin) worsened in 2017 when
compared to the previous year. This may be attributed to the $ 106.5 million non-cash
impairment charge which the company has undertaken during FY2017. Most of this
impairment charge is on account of write down in brands and goodwill whose value as
captured on the balance sheet far exceeded the fair market price as captured by the
company’s stock price. The relevant details in this regards is summarised in the table below.
Another key aspect is that the company was in profit for the year ended on June 2015 but has
been reporting losses since then. Additionally, it has been disinvesting various businesses
which is resulting in lower revenues and shrinking size of the balance sheet. With regards to
FY2016, the company divested the stake in Sector 9, SurfSwitch and Swell (Billabong,
2016). In FY2017, the company divested its stake in Tigerlily.
Also, it is noteworthy that owing to the significant impairment charges along with poor
operating performance, the company has been reporting losses for the period under
consideration. Owing to the losses, the return on assets and equity is also negative. With
regards to assets and equity, it is noteworthy that the magnitude is increasing on account of
lowering total assets and shareholders’ equity. The decline in shareholders’ equity is
primarily on account of continuous losses which are adjusted against the equity capital
(Damodaran, 2014). Further, divestment in various businesses is leading to decline in total
assets. In the wake of the sustained poor profitability performance and the failure of the
company to report a profit after tax, it comes as no surprise that it was bought by Boardriders
Inc.
Efficiency Ratios
The requisite efficiency ratios for the company are summarised below.
3
The only positive aspect for the company with regards to the profitability ratios is the fact
that gross profit margin has witnessed an improvement on a y-o-y basis. This improvement in
gross margins may be attributed to the global sourcing initiatives that have been undertaken
by the management in order to lower the cost of goods sold as a percentage of sales and
thereby expand profitability of business operations (Billabong, 2016).
It is evident that the profitability of the company took a hit in 2017 as the various
profitability ratios (with the exception of gross profit margin) worsened in 2017 when
compared to the previous year. This may be attributed to the $ 106.5 million non-cash
impairment charge which the company has undertaken during FY2017. Most of this
impairment charge is on account of write down in brands and goodwill whose value as
captured on the balance sheet far exceeded the fair market price as captured by the
company’s stock price. The relevant details in this regards is summarised in the table below.
Another key aspect is that the company was in profit for the year ended on June 2015 but has
been reporting losses since then. Additionally, it has been disinvesting various businesses
which is resulting in lower revenues and shrinking size of the balance sheet. With regards to
FY2016, the company divested the stake in Sector 9, SurfSwitch and Swell (Billabong,
2016). In FY2017, the company divested its stake in Tigerlily.
Also, it is noteworthy that owing to the significant impairment charges along with poor
operating performance, the company has been reporting losses for the period under
consideration. Owing to the losses, the return on assets and equity is also negative. With
regards to assets and equity, it is noteworthy that the magnitude is increasing on account of
lowering total assets and shareholders’ equity. The decline in shareholders’ equity is
primarily on account of continuous losses which are adjusted against the equity capital
(Damodaran, 2014). Further, divestment in various businesses is leading to decline in total
assets. In the wake of the sustained poor profitability performance and the failure of the
company to report a profit after tax, it comes as no surprise that it was bought by Boardriders
Inc.
Efficiency Ratios
The requisite efficiency ratios for the company are summarised below.
3
Paraphrase This Document
Need a fresh take? Get an instant paraphrase of this document with our AI Paraphraser
PERFORMANCE EVALUATION
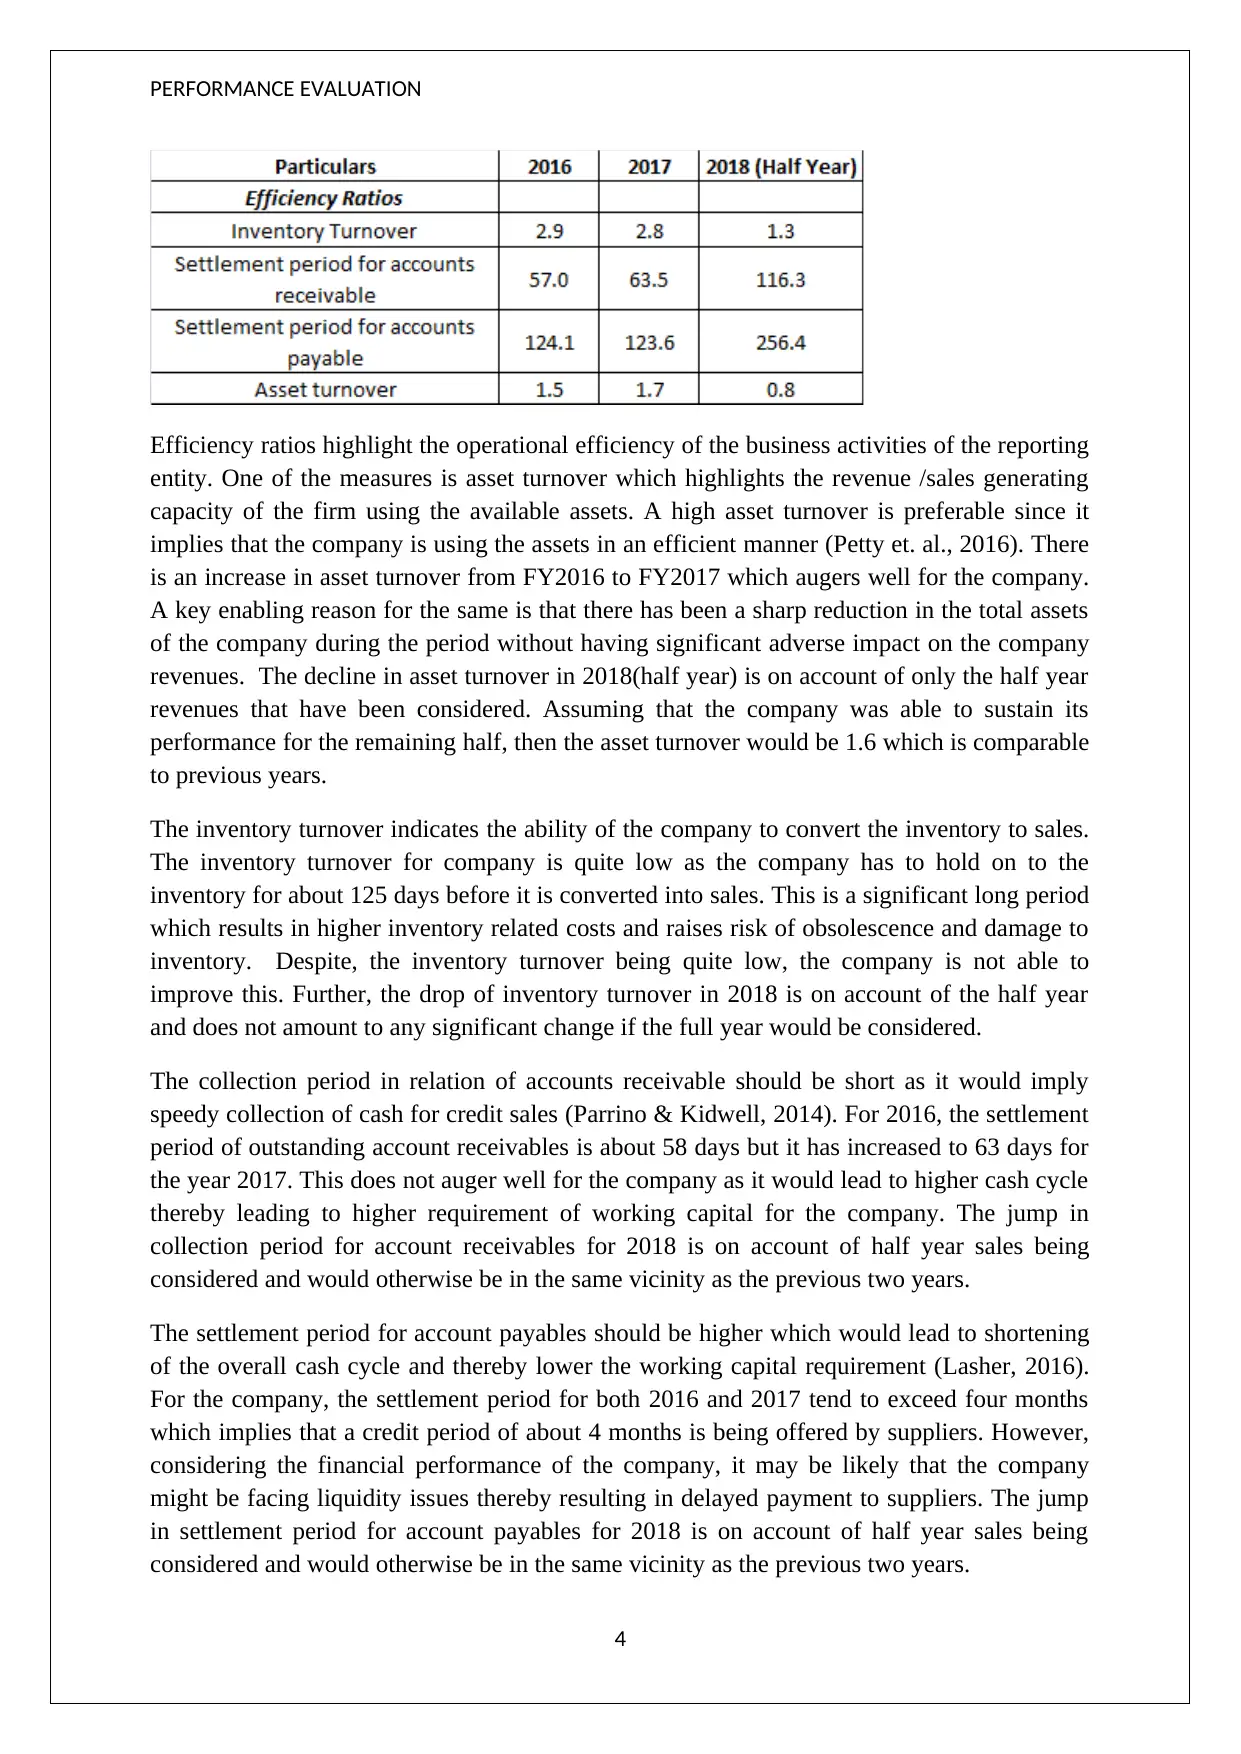
Efficiency ratios highlight the operational efficiency of the business activities of the reporting
entity. One of the measures is asset turnover which highlights the revenue /sales generating
capacity of the firm using the available assets. A high asset turnover is preferable since it
implies that the company is using the assets in an efficient manner (Petty et. al., 2016). There
is an increase in asset turnover from FY2016 to FY2017 which augers well for the company.
A key enabling reason for the same is that there has been a sharp reduction in the total assets
of the company during the period without having significant adverse impact on the company
revenues. The decline in asset turnover in 2018(half year) is on account of only the half year
revenues that have been considered. Assuming that the company was able to sustain its
performance for the remaining half, then the asset turnover would be 1.6 which is comparable
to previous years.
The inventory turnover indicates the ability of the company to convert the inventory to sales.
The inventory turnover for company is quite low as the company has to hold on to the
inventory for about 125 days before it is converted into sales. This is a significant long period
which results in higher inventory related costs and raises risk of obsolescence and damage to
inventory. Despite, the inventory turnover being quite low, the company is not able to
improve this. Further, the drop of inventory turnover in 2018 is on account of the half year
and does not amount to any significant change if the full year would be considered.
The collection period in relation of accounts receivable should be short as it would imply
speedy collection of cash for credit sales (Parrino & Kidwell, 2014). For 2016, the settlement
period of outstanding account receivables is about 58 days but it has increased to 63 days for
the year 2017. This does not auger well for the company as it would lead to higher cash cycle
thereby leading to higher requirement of working capital for the company. The jump in
collection period for account receivables for 2018 is on account of half year sales being
considered and would otherwise be in the same vicinity as the previous two years.
The settlement period for account payables should be higher which would lead to shortening
of the overall cash cycle and thereby lower the working capital requirement (Lasher, 2016).
For the company, the settlement period for both 2016 and 2017 tend to exceed four months
which implies that a credit period of about 4 months is being offered by suppliers. However,
considering the financial performance of the company, it may be likely that the company
might be facing liquidity issues thereby resulting in delayed payment to suppliers. The jump
in settlement period for account payables for 2018 is on account of half year sales being
considered and would otherwise be in the same vicinity as the previous two years.
4
PERFORMANCE EVALUATION
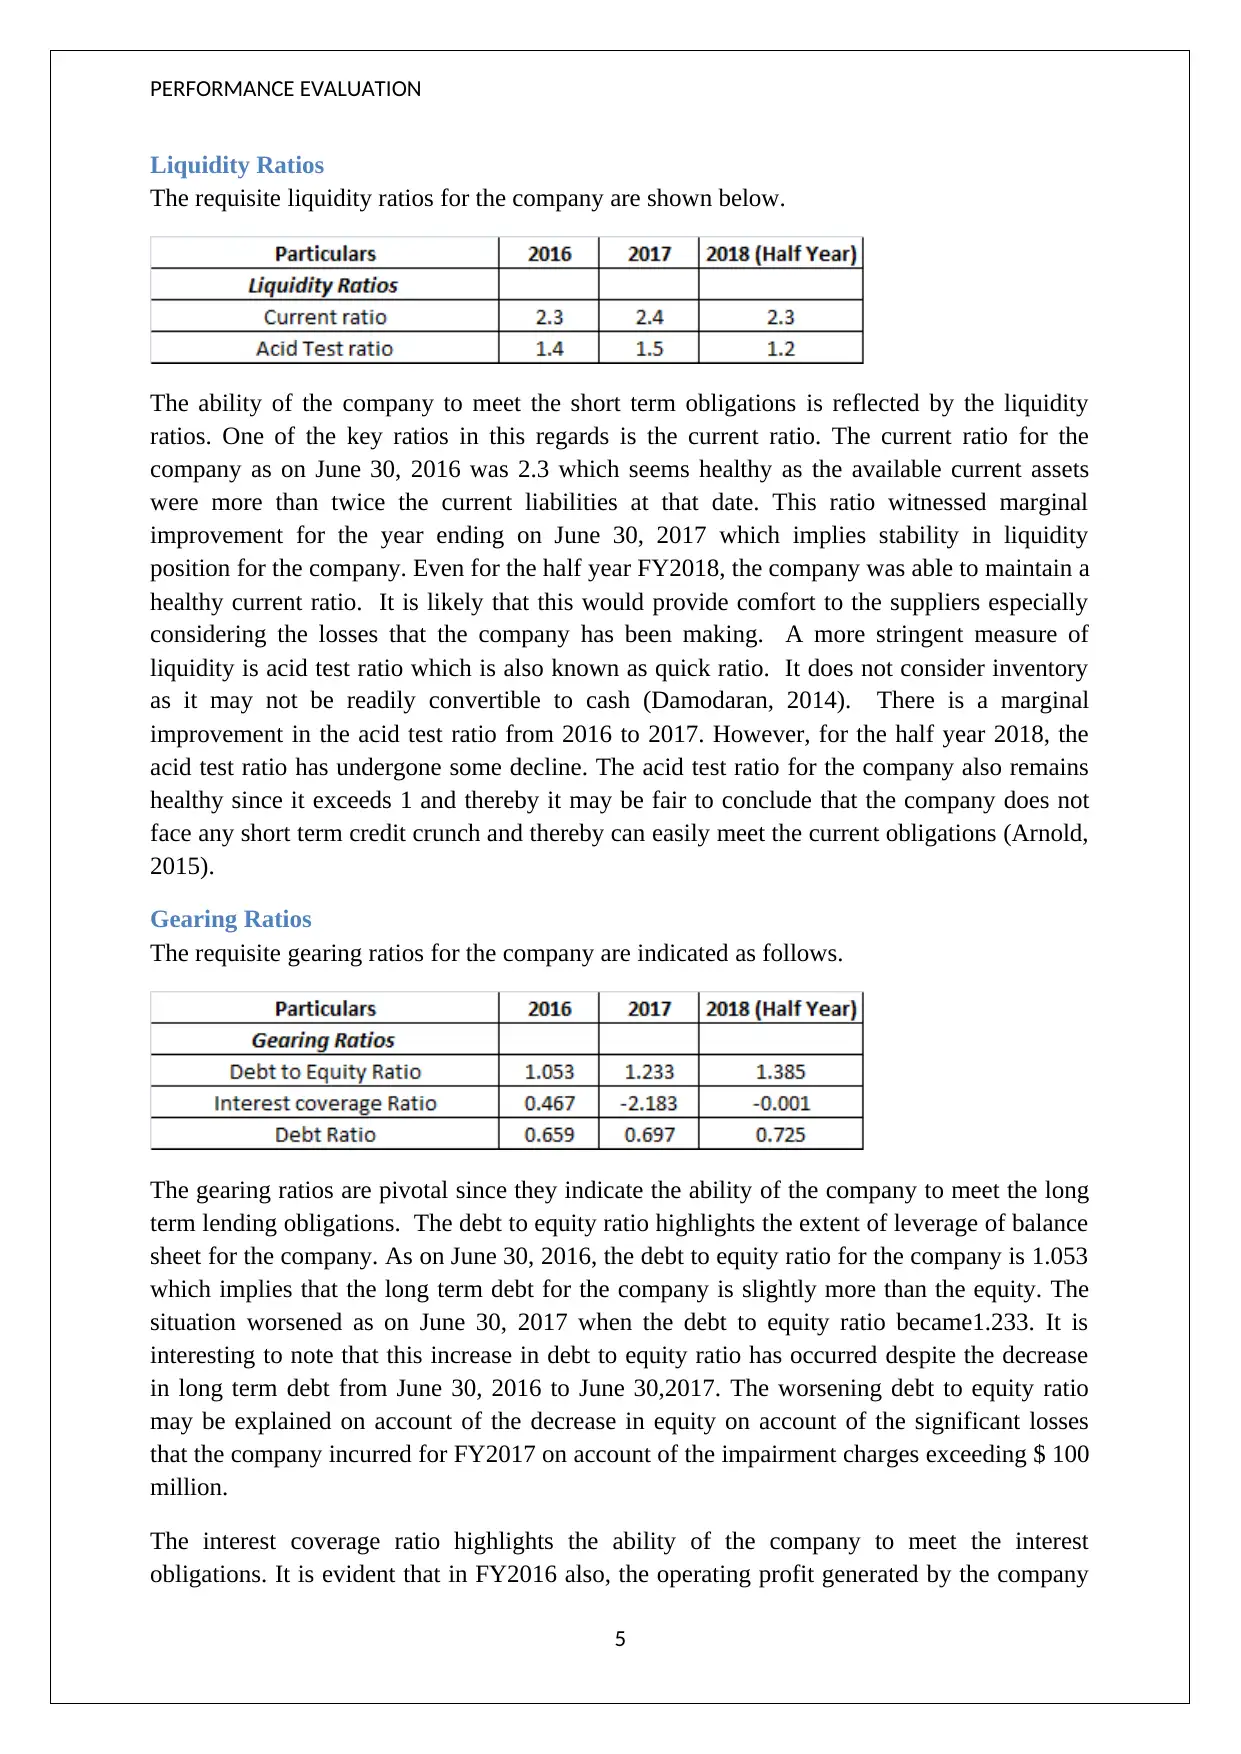
Liquidity Ratios
The requisite liquidity ratios for the company are shown below.
The ability of the company to meet the short term obligations is reflected by the liquidity
ratios. One of the key ratios in this regards is the current ratio. The current ratio for the
company as on June 30, 2016 was 2.3 which seems healthy as the available current assets
were more than twice the current liabilities at that date. This ratio witnessed marginal
improvement for the year ending on June 30, 2017 which implies stability in liquidity
position for the company. Even for the half year FY2018, the company was able to maintain a
healthy current ratio. It is likely that this would provide comfort to the suppliers especially
considering the losses that the company has been making. A more stringent measure of
liquidity is acid test ratio which is also known as quick ratio. It does not consider inventory
as it may not be readily convertible to cash (Damodaran, 2014). There is a marginal
improvement in the acid test ratio from 2016 to 2017. However, for the half year 2018, the
acid test ratio has undergone some decline. The acid test ratio for the company also remains
healthy since it exceeds 1 and thereby it may be fair to conclude that the company does not
face any short term credit crunch and thereby can easily meet the current obligations (Arnold,
2015).
Gearing Ratios
The requisite gearing ratios for the company are indicated as follows.
The gearing ratios are pivotal since they indicate the ability of the company to meet the long
term lending obligations. The debt to equity ratio highlights the extent of leverage of balance
sheet for the company. As on June 30, 2016, the debt to equity ratio for the company is 1.053
which implies that the long term debt for the company is slightly more than the equity. The
situation worsened as on June 30, 2017 when the debt to equity ratio became1.233. It is
interesting to note that this increase in debt to equity ratio has occurred despite the decrease
in long term debt from June 30, 2016 to June 30,2017. The worsening debt to equity ratio
may be explained on account of the decrease in equity on account of the significant losses
that the company incurred for FY2017 on account of the impairment charges exceeding $ 100
million.
The interest coverage ratio highlights the ability of the company to meet the interest
obligations. It is evident that in FY2016 also, the operating profit generated by the company
5
⊘ This is a preview!⊘
Do you want full access?
Subscribe today to unlock all pages.
Trusted by 1+ million students worldwide
PERFORMANCE EVALUATION
is not sufficient to meet the interest obligations for the company. In FY2017, the situation
further worsened on account of the impairment expense leading to an operating loss which
was more than twice the interest expense for the year. The operating losses continued for the
half year FY2018 continued. This clearly highlights that the company is not in a position to
meet the interest obligations which raises serious concerns about the company’s ability to
service the outstanding debt (Ross,Tryaler, Bird, Westerfield & Jorden, 2016).
The debt ratio of the company also shows a worrying trend as the increasing value indicates a
higher contribution of liabilities towards debt funding. The contribution of equity is
continuously on the decline which is not surprising since the company had been mounting
losses during the period under consideration. Also, taking into regards the struggles of the
company since 2008, the stock price of the company has suffered significant erosion, thereby
making equity raising difficult (Arnold, 2015).
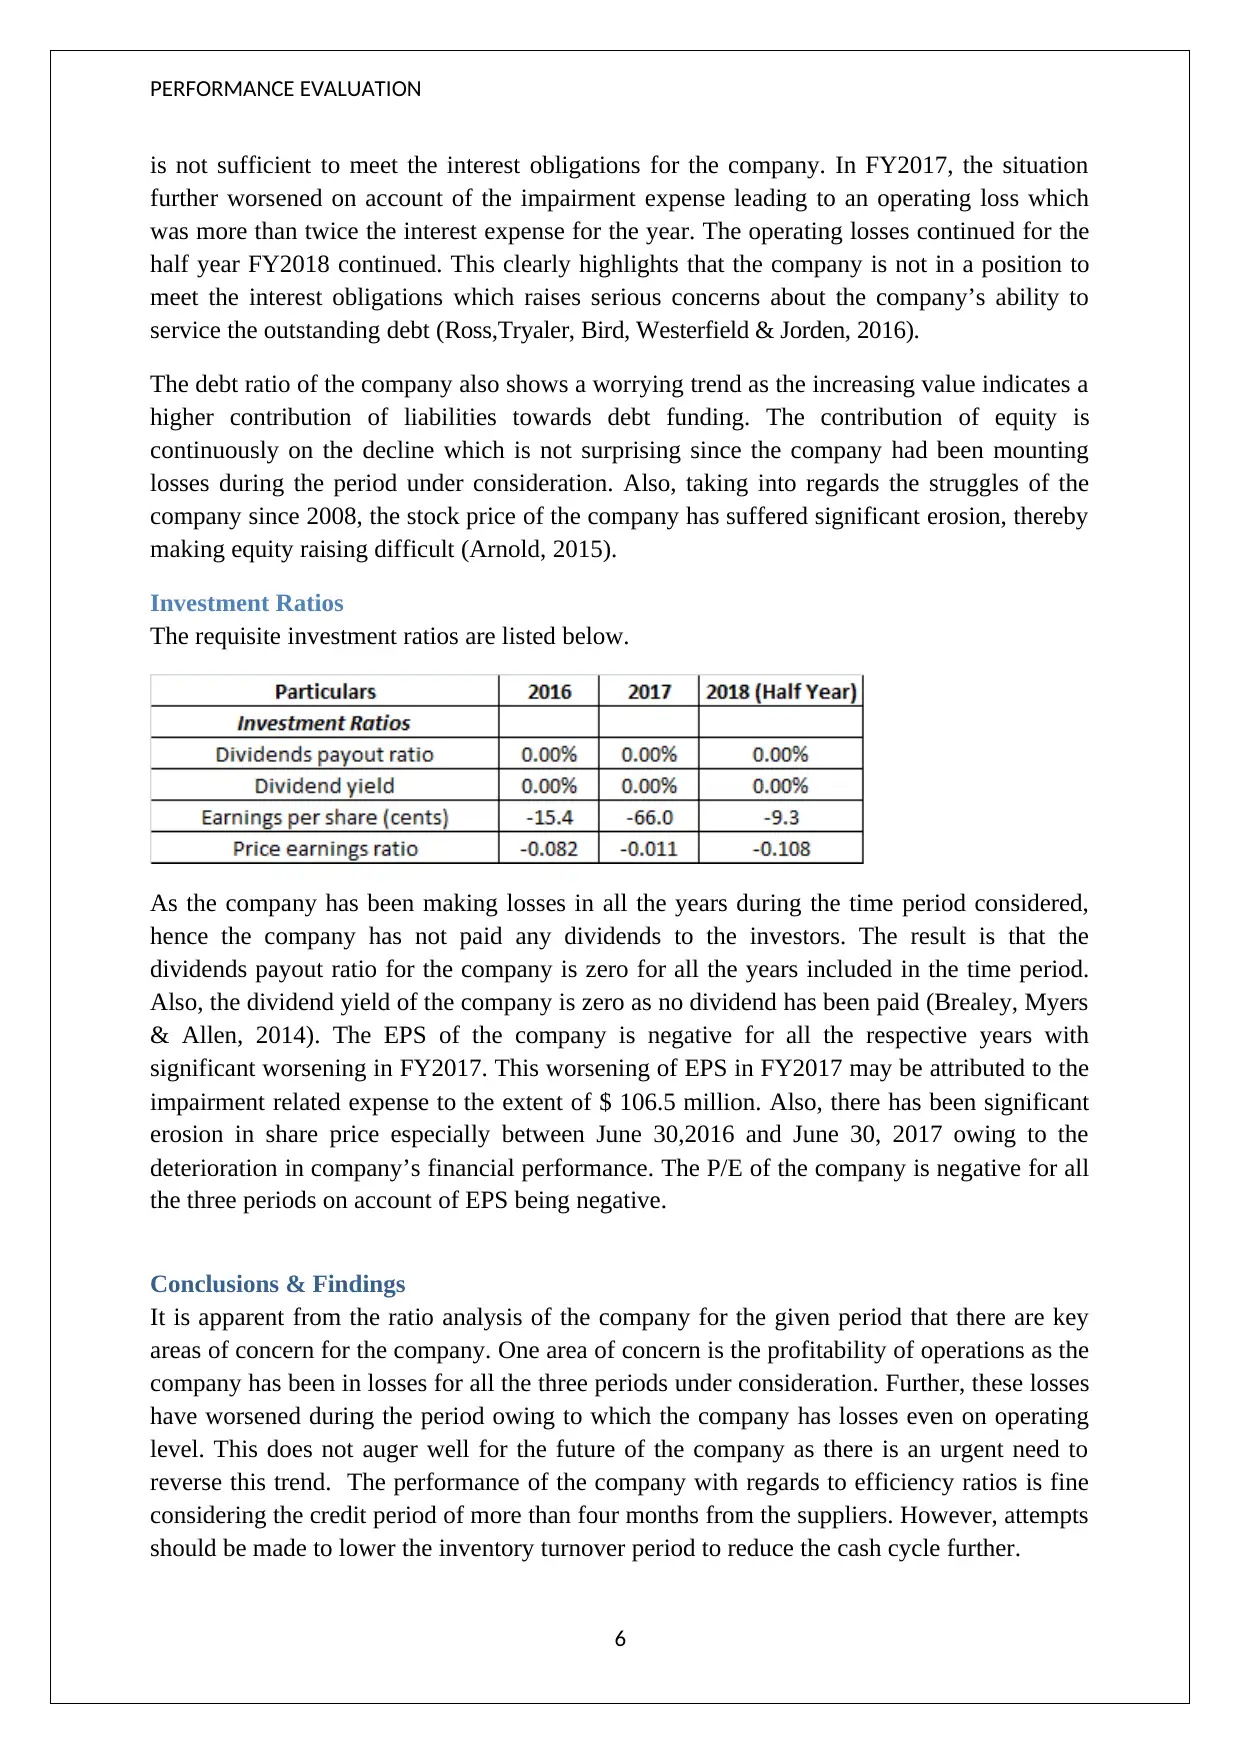
Investment Ratios
The requisite investment ratios are listed below.
As the company has been making losses in all the years during the time period considered,
hence the company has not paid any dividends to the investors. The result is that the
dividends payout ratio for the company is zero for all the years included in the time period.
Also, the dividend yield of the company is zero as no dividend has been paid (Brealey, Myers
& Allen, 2014). The EPS of the company is negative for all the respective years with
significant worsening in FY2017. This worsening of EPS in FY2017 may be attributed to the
impairment related expense to the extent of $ 106.5 million. Also, there has been significant
erosion in share price especially between June 30,2016 and June 30, 2017 owing to the
deterioration in company’s financial performance. The P/E of the company is negative for all
the three periods on account of EPS being negative.
Conclusions & Findings
It is apparent from the ratio analysis of the company for the given period that there are key
areas of concern for the company. One area of concern is the profitability of operations as the
company has been in losses for all the three periods under consideration. Further, these losses
have worsened during the period owing to which the company has losses even on operating
level. This does not auger well for the future of the company as there is an urgent need to
reverse this trend. The performance of the company with regards to efficiency ratios is fine
considering the credit period of more than four months from the suppliers. However, attempts
should be made to lower the inventory turnover period to reduce the cash cycle further.
6
is not sufficient to meet the interest obligations for the company. In FY2017, the situation
further worsened on account of the impairment expense leading to an operating loss which
was more than twice the interest expense for the year. The operating losses continued for the
half year FY2018 continued. This clearly highlights that the company is not in a position to
meet the interest obligations which raises serious concerns about the company’s ability to
service the outstanding debt (Ross,Tryaler, Bird, Westerfield & Jorden, 2016).
The debt ratio of the company also shows a worrying trend as the increasing value indicates a
higher contribution of liabilities towards debt funding. The contribution of equity is
continuously on the decline which is not surprising since the company had been mounting
losses during the period under consideration. Also, taking into regards the struggles of the
company since 2008, the stock price of the company has suffered significant erosion, thereby
making equity raising difficult (Arnold, 2015).
Investment Ratios
The requisite investment ratios are listed below.
As the company has been making losses in all the years during the time period considered,
hence the company has not paid any dividends to the investors. The result is that the
dividends payout ratio for the company is zero for all the years included in the time period.
Also, the dividend yield of the company is zero as no dividend has been paid (Brealey, Myers
& Allen, 2014). The EPS of the company is negative for all the respective years with
significant worsening in FY2017. This worsening of EPS in FY2017 may be attributed to the
impairment related expense to the extent of $ 106.5 million. Also, there has been significant
erosion in share price especially between June 30,2016 and June 30, 2017 owing to the
deterioration in company’s financial performance. The P/E of the company is negative for all
the three periods on account of EPS being negative.
Conclusions & Findings
It is apparent from the ratio analysis of the company for the given period that there are key
areas of concern for the company. One area of concern is the profitability of operations as the
company has been in losses for all the three periods under consideration. Further, these losses
have worsened during the period owing to which the company has losses even on operating
level. This does not auger well for the future of the company as there is an urgent need to
reverse this trend. The performance of the company with regards to efficiency ratios is fine
considering the credit period of more than four months from the suppliers. However, attempts
should be made to lower the inventory turnover period to reduce the cash cycle further.
6
Paraphrase This Document
Need a fresh take? Get an instant paraphrase of this document with our AI Paraphraser
PERFORMANCE EVALUATION
The liquidity ratios clearly indicate that the company is in a comfortable position to meet the
short term obligations without any issues. However, the same cannot be concluded about the
gearing ratios which indicate that the balance sheet of the company continues to be over
leveraged. There are additionally concerns in regards to company meeting the interest
obligations as the company is making operating losses in some periods. Also, owing to
accumulated losses rising, there is an erosion of equity owing to which increasingly the
capital structure is becoming skewed towards debt. The investment ratios of the company are
also not impressive as the EPS for the company has been negative for all the three periods
considered. Further, the company has not paid any dividends on account of the sustained
losses that it has suffered. Also, the share price of the company has seen significant
deterioration on account of lacklustre financial performance of the company.
Recommendations
The management of the company needs to ensure that proactive measures ought to be taken
so as to divest the various non-performing businesses and brands so that the company can
show profits which seems elusive at the moment. Additionally, the cash inflows from these
divestments would also enable lowering of debt which would help deleveraging of the
balance sheet along with lowering of the finance costs. Further, it would also be prudent for
the management to rope in a strategic partner which would not only provide strategic
direction but would also require incremental capital for the business which is necessary
considering the losses that the business has sustained which has ended up eroding the capital
(Petty et. al., 2016).
With regards to current and prospective shareholders, it is essential to note that the company
has been making losses for the whole period under consideration. The fact that there is no
certainty of company returning to black in the future is a major concern for the investors.
Additionally, considering the solvency situation of the company combined with profitability,
it is unlikely that the company would announce any dividends in the near future. As a result,
any returns for the shareholders would be expected only if there is an appreciation in the
stock price. This is unlikely to happen if the management fails to take prudent measures to
return the business to profitability. The reduction of debt would also help as it would lead to
lowering of finance costs and thereby aid profitability. It is advisable for investors that till the
time such signs are clearly visible on part of the management, it would be prudent not to
bottom fish and one should continue to avoid the stock (Parrino & Kidwell,2014).
7
PERFORMANCE EVALUATION
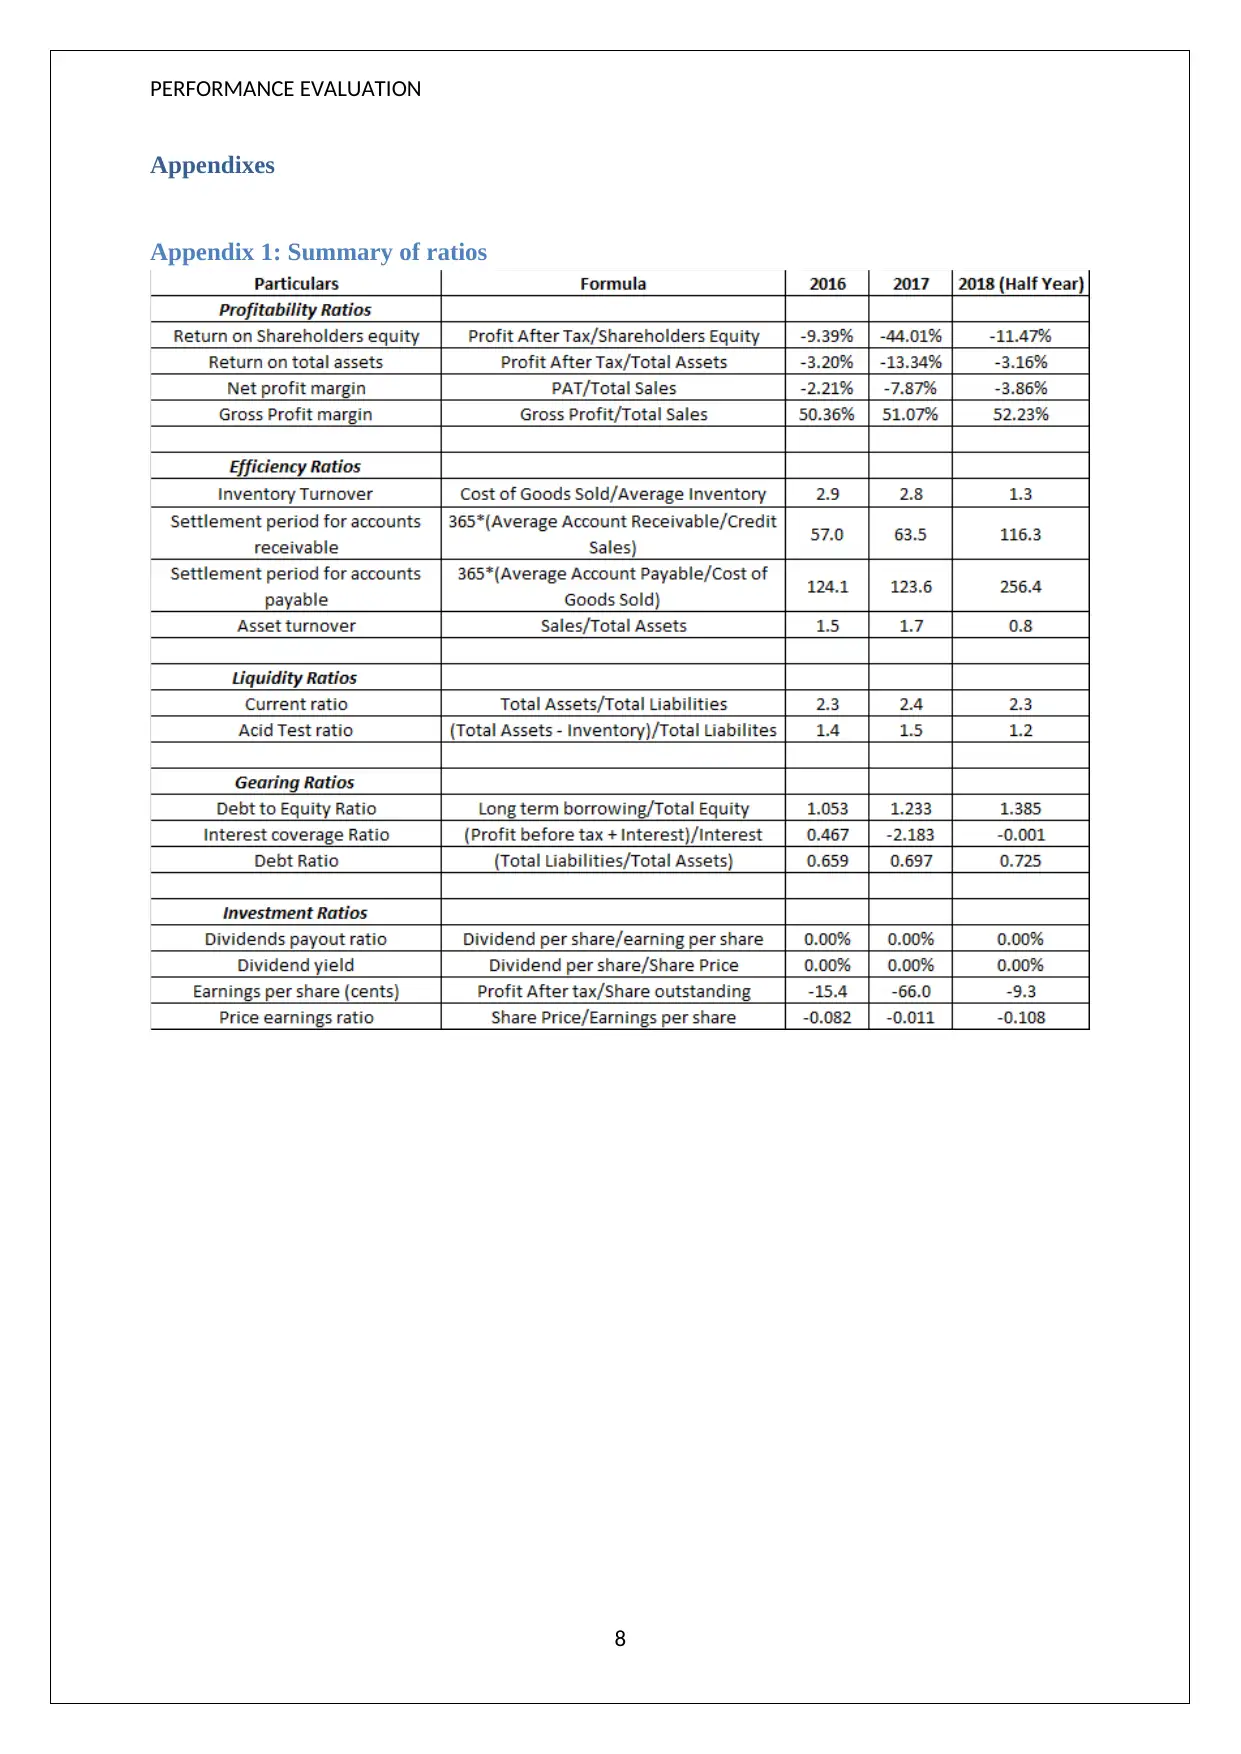
Appendixes
Appendix 1: Summary of ratios
8
Appendixes
Appendix 1: Summary of ratios
8
⊘ This is a preview!⊘
Do you want full access?
Subscribe today to unlock all pages.
Trusted by 1+ million students worldwide
PERFORMANCE EVALUATION
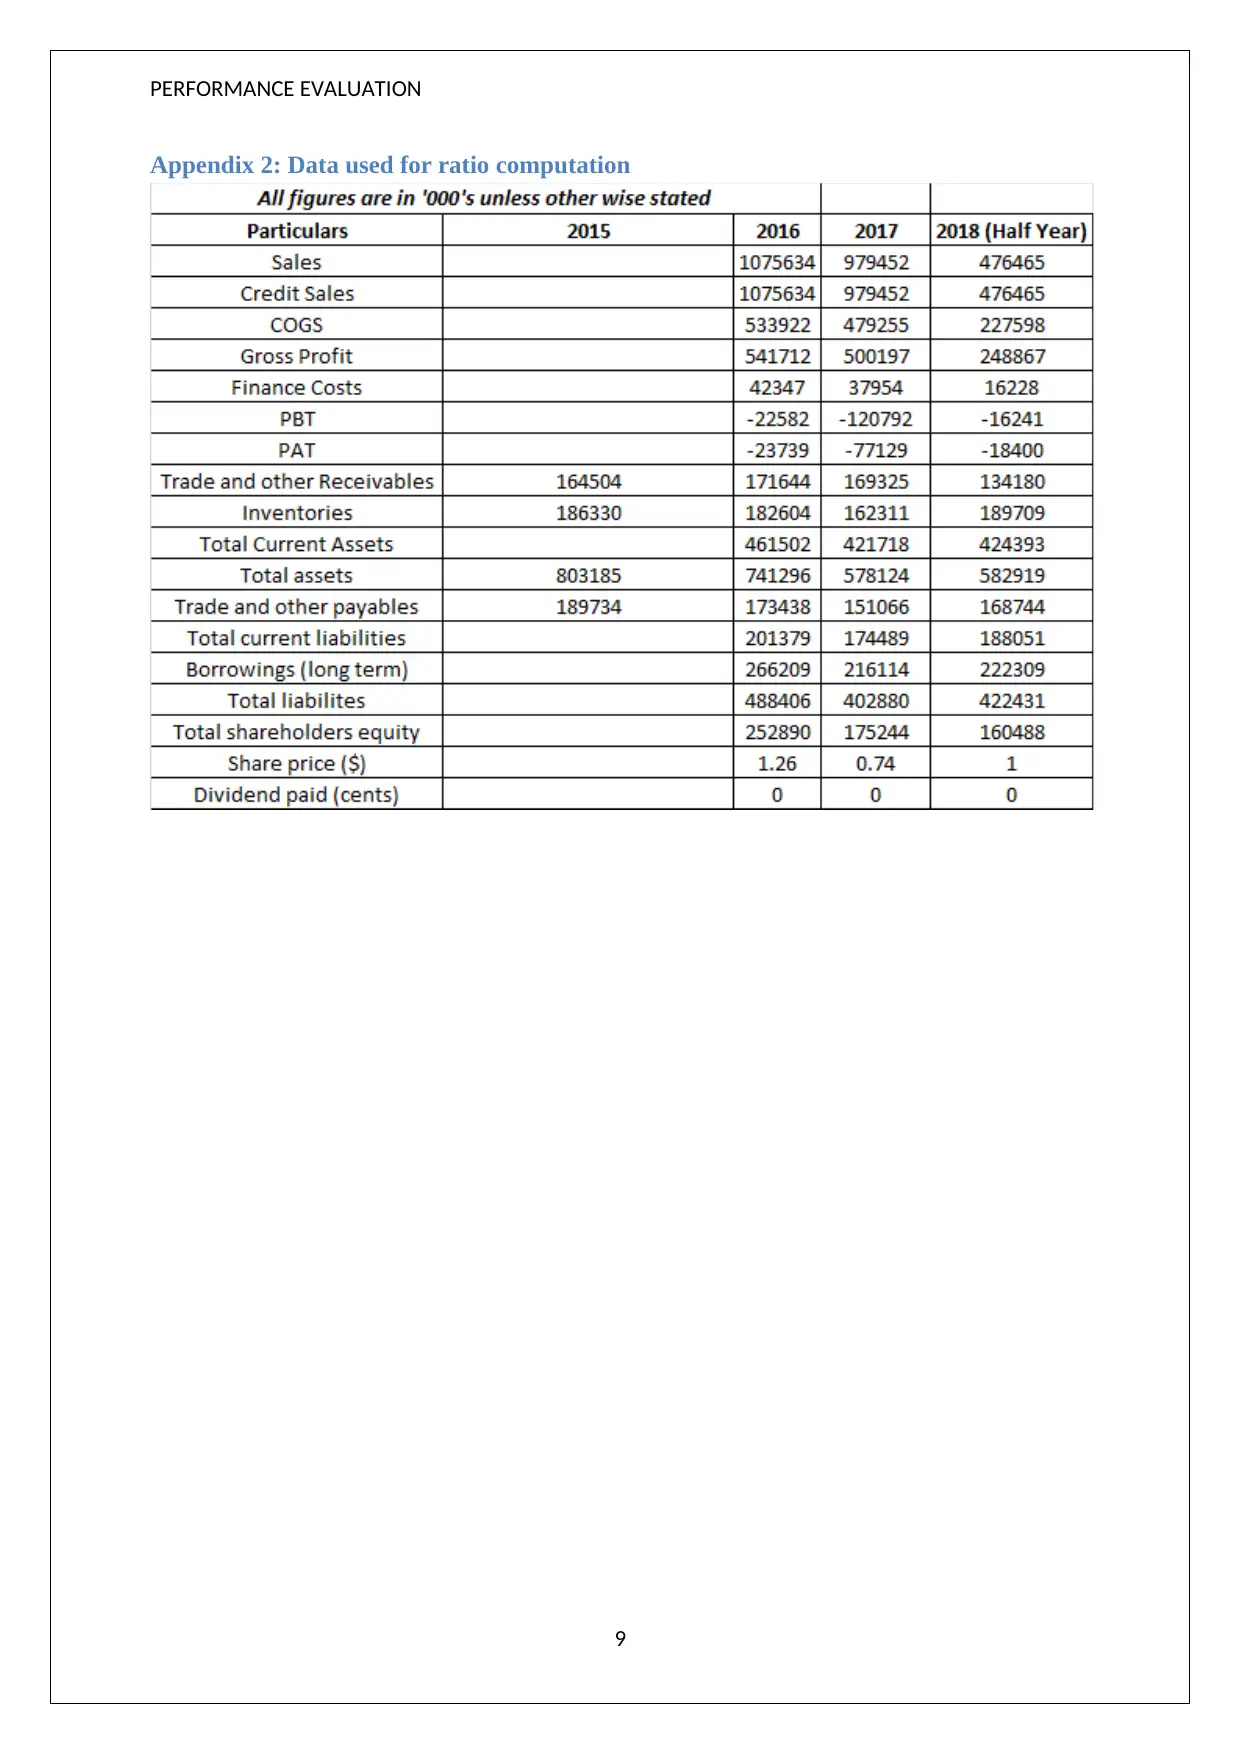
Appendix 2: Data used for ratio computation
9
Appendix 2: Data used for ratio computation
9
Paraphrase This Document
Need a fresh take? Get an instant paraphrase of this document with our AI Paraphraser
PERFORMANCE EVALUATION
References
Arnold,G. (2015). Corporate Financial Management (3rded.). Sydney: Financial Times
Management.
Billabong (2016), Financial Report 2016, Retrieved on September 18, 2019 from
https://www.asx.com.au/asxpdf/20160825/pdf/439m1tgqdj814v.pdf
Brealey, R. A., Myers, S. C., & Allen, F. (2014). Principles of corporate finance (2nd ed.).
New York: McGraw-Hill Inc.
Damodaran, A. (2014) Applied corporate finance: A user’s manual, (3rd ed.) New York:
Wiley, John & Sons.
Lasher, W. R., (2016) Practical Financial Management (5thed.). London: South- Western
College Publisher.
Parrino, R. & Kidwell, D. (2014) ,Fundamentals of Corporate Finance, (4th ed.), London:
Wiley Publications
Petty, J.W., Titman, S., Keown, A., Martin, J.D., Martin, P., Burrow, M., & Nguyen, H. (2016).
Financial Management, Principles and Applications (6thed.). NSW: Pearson Education,
French Forest Australia.
Ross,S.A., Tryaler,R., Bird, R.,Westerfield, R.W. & Jorden,B.D. (2016). Essentials of
Corporate Finance (2nded.). New York City: McGraw-Hill.
10
1 out of 11
Related Documents


Your All-in-One AI-Powered Toolkit for Academic Success.
+13062052269
info@desklib.com
Available 24*7 on WhatsApp / Email
![[object Object]](/_next/static/media/star-bottom.7253800d.svg)
Unlock your academic potential
Copyright © 2020–2026 A2Z Services. All Rights Reserved. Developed and managed by ZUCOL.