Research Report: Energy Output and Emissions of Ethanol-Based Biofuels
VerifiedAdded on 2022/10/11
|20
|3801
|18
Report
AI Summary
This research report examines the viability of ethanol-based biofuels as an alternative to fossil fuels, focusing on energy output and greenhouse gas emissions, particularly carbon dioxide. The study investigates the energy content of different feedstocks for ethanol production, comparing ethanol's enthalpy of combustion with that of gasoline. It explores the CO2 emissions associated with ethanol production from sources like sugarcane and corn, highlighting the advantages of biofuels in reducing emissions compared to petroleum. The report analyzes the production processes of corn-based and sugarcane-based biofuels, including steps like milling, liquefaction, and fermentation, and compares the energy densities of various fuels. Ultimately, the research aims to determine the efficiency of ethanol-based biofuels compared to fossil fuels and provides recommendations for future fuel use based on these comparative factors.

Biofuels 1
Chemistry- Research assignment
Name:
College:
Chemistry- Research assignment
Name:
College:
Paraphrase This Document
Need a fresh take? Get an instant paraphrase of this document with our AI Paraphraser
Biofuels 2
Abstract
For a long time, biofuels have been explored and utilized as an alternative source of fuel,
however in small scale. Despite the rising popularity of these fuels, their sustainability has
been questioned regarding food versus fuel trade-off and land use. This research seeks to
examine the viability of ethanol-based biofuels as potential superiors to fossil fuels in terms
of energy output capabilities and greenhouse gas emission, especially carbon (iv) oxide.
Different types of feedstock for ethanol production are examined and compared in terms of
their energy content. Based on the gathered information, reasonable conclusions are drawn
and recommendations for improvement put forward.
Biofuels 3
Introduction
The preference of biofuels over other energy sources such as fossil fuels is driven by a wide
range of policy objectives (Kern, Kivimaa, Rogge, & Rosenow, 2018). Most importantly,
they have low greenhouse gas emissions which is a great advantage especially in this age
when environmental conservation is a major concern. Besides, biofuels are renewable energy
sources hence provide a significant contribution towards a sustainable transport sector
especially when combined with electric vehicles. In aviation, heavy freight, and marine
transport, bio-energy has been considered as the reasonable alternative to fossil fuels
regarding greenhouse gas emissions (De Baan, Alkemade, & Koellner, 2012). Despite the
myriad opportunities and interests for biofuels, plant construction is slowing down. This can
be partly attributed to the growing concern about sustainability of these energy sources with
respect to food and land use (Araújo, Mahajan, Kerr, & Silva, 2017).
Claim
Biofuels are more efficient and have less environmental impact than fossil fuels.
Research question
Is the combustion of ethanol-based biofuels (sugarcane) more efficient than standard fossil
fuels (petroleum) in terms of energy output (enthalpy) and carbon dioxide (CO2) emissions?
Rationale
In order to understand and appreciate how bioenergy contributes to the mitigation of climate
change, it’s important to carry out comparisons between conventional fuel sources such as
petroleum and alternative sources such as ethanol-based fuels. An investigation into the
⊘ This is a preview!⊘
Do you want full access?
Subscribe today to unlock all pages.
Trusted by 1+ million students worldwide
Biofuels 4
energy output and corresponding carbon (iv) oxide emissions for different types of fuels is
necessary to determine the best fuel sources to be adopted for the development of a
sustainable transport system and other energy requirements.
Background
The economic status of developing countries as well as their growth is largely determined by
sources of energy and their utilization (Grammelis, 2016). In 2013, the Statistical Review of
World Energy estimated that the primary energy sources consisted of natural gas at 23.7 %,
coal at 30 % and petroleum at 32.9 % which amounted to 87 % share for fossil fuels
(Muktham, K. Bhargava, Bankupalli, & S. Ball, 2016). Modern day activities ranging from
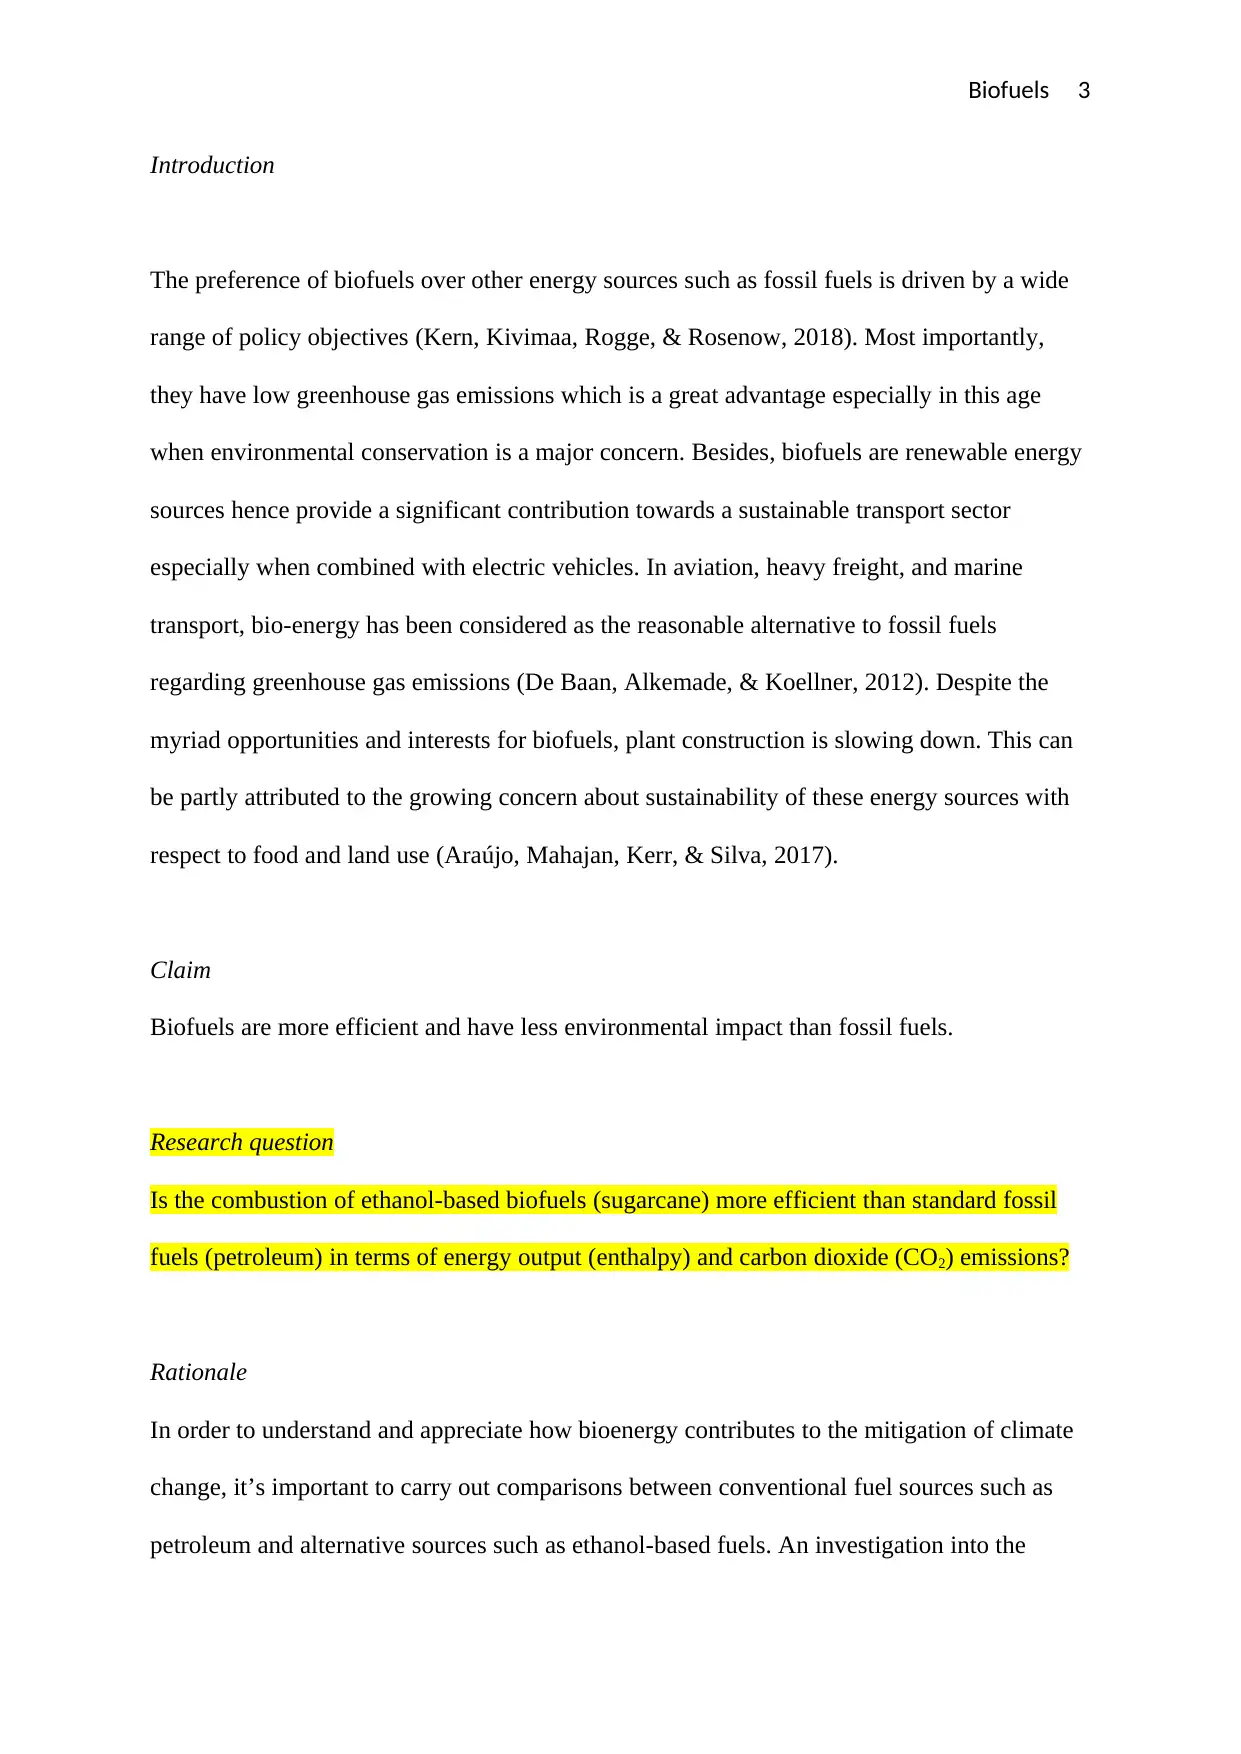
cooking to transportation are highly dependent on fossil fuels. The figure below shows world
energy consumption by fuel type. It can be observed that oil, natural gas and coal
consumption greatly overshadow the consumption of renewable energy sources combined.
Figure 1: World energy consumption by fuel type
http://www.bp.com/en/global/corporate/energy-economics/statistical-review-of-world-
energy.html
energy output and corresponding carbon (iv) oxide emissions for different types of fuels is
necessary to determine the best fuel sources to be adopted for the development of a
sustainable transport system and other energy requirements.
Background
The economic status of developing countries as well as their growth is largely determined by
sources of energy and their utilization (Grammelis, 2016). In 2013, the Statistical Review of
World Energy estimated that the primary energy sources consisted of natural gas at 23.7 %,
coal at 30 % and petroleum at 32.9 % which amounted to 87 % share for fossil fuels
(Muktham, K. Bhargava, Bankupalli, & S. Ball, 2016). Modern day activities ranging from
cooking to transportation are highly dependent on fossil fuels. The figure below shows world
energy consumption by fuel type. It can be observed that oil, natural gas and coal
consumption greatly overshadow the consumption of renewable energy sources combined.
Figure 1: World energy consumption by fuel type
http://www.bp.com/en/global/corporate/energy-economics/statistical-review-of-world-
energy.html
Paraphrase This Document
Need a fresh take? Get an instant paraphrase of this document with our AI Paraphraser
Biofuels 5
The standard molar enthalpy of combustion of ethanol is about -1366.8 kJ/mol. This is the
heat amount released on completely burning a mole of ethanol at the standard state conditions
of 25 degree Celsius and a pressure of 1 atm. This is significantly lower than that of gasoline
(octane) which is approximately -5460 kJ/mol. Therefore, the burning of gasoline releases
more energy compared to ethanol. However, in terms of CO2 emission, ethanol reduces
emissions by about 34 % on average compared to octane. This is because the carbon (iv)
oxide emitted during the burning of ethanol is reused by the growing of feedstocks for
ethanol production. Compared to pure gasoline, ethanol and other fuels obtained from its
mixture with gasoline have higher levels of octane and therefore have lower emissions.
However, ethanol and its derivatives have higher ground-level emissions which result from
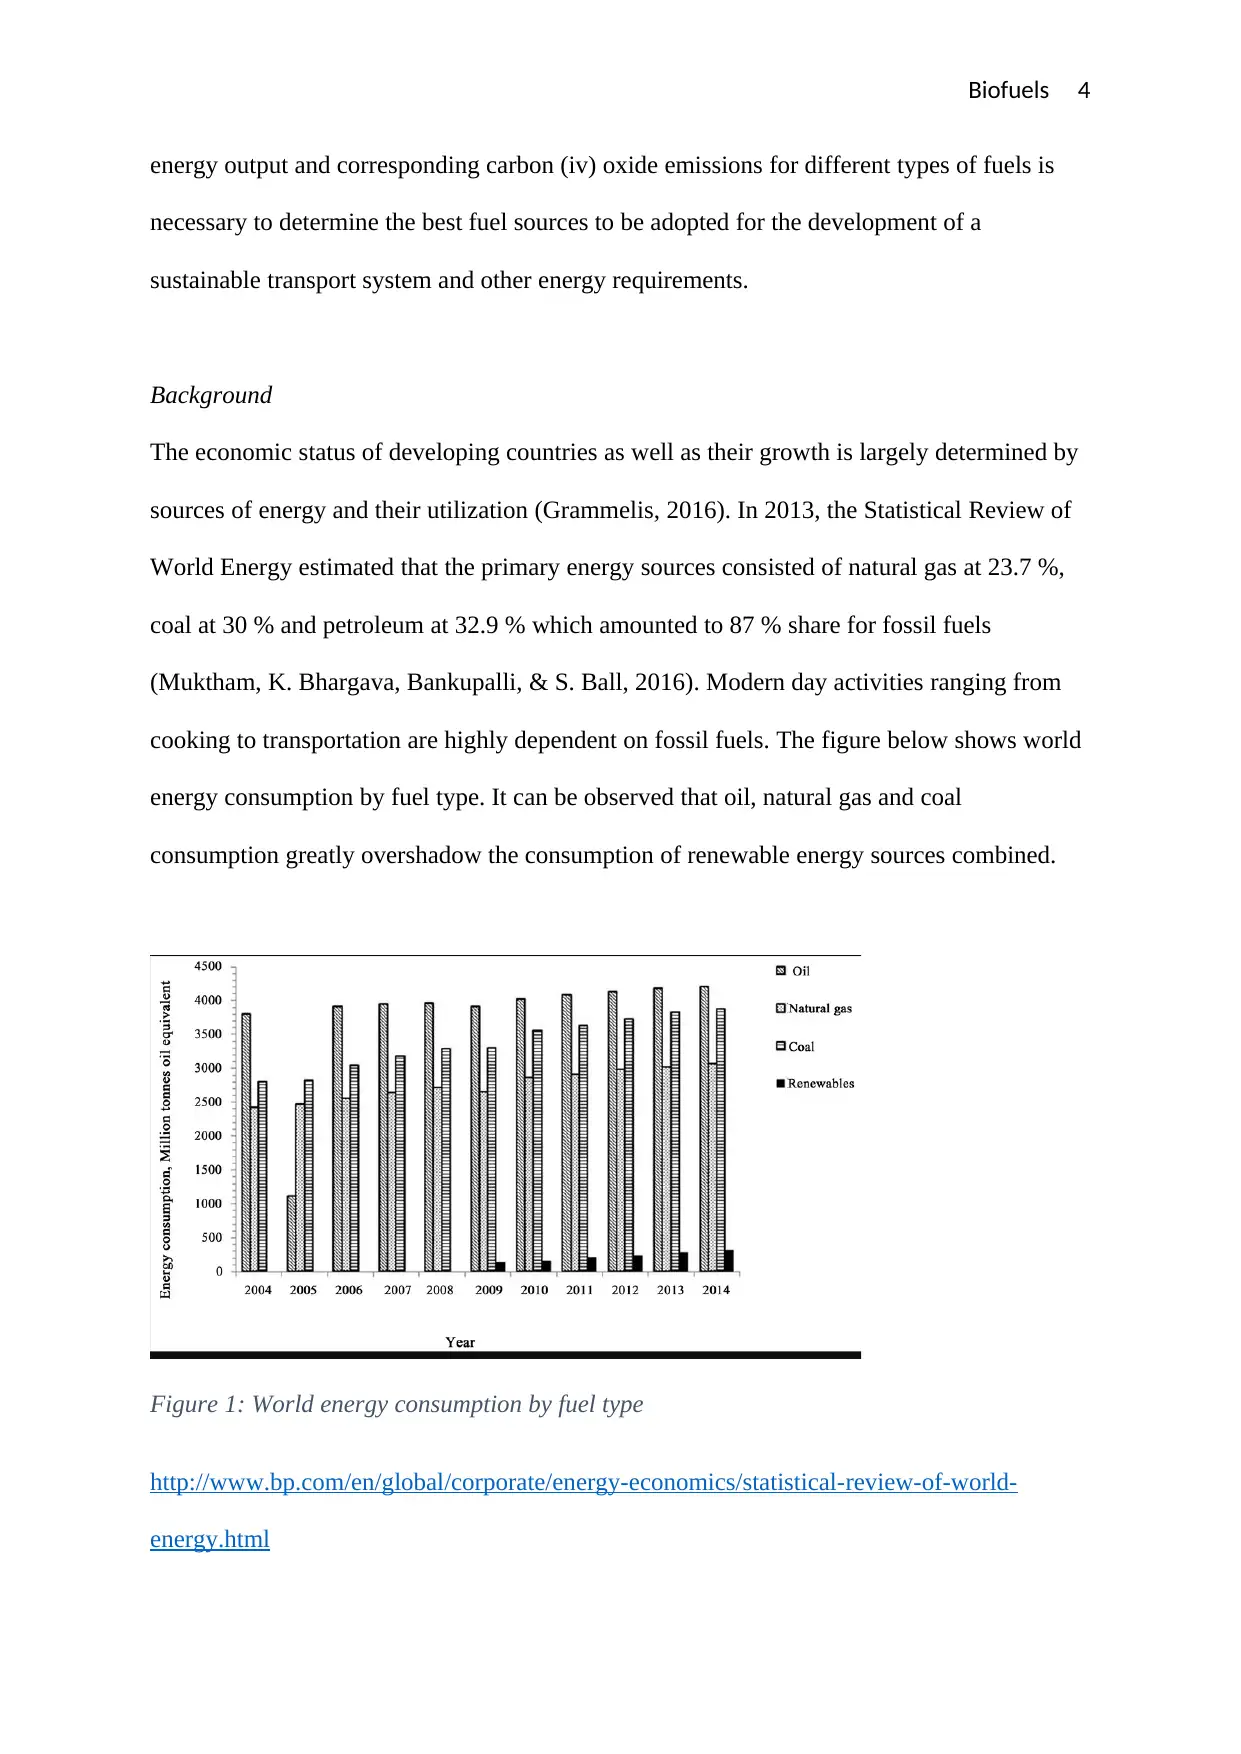
fuel tanks and other dispensing apparatus. The table below shows the CO2 emissions for
different fuel types.
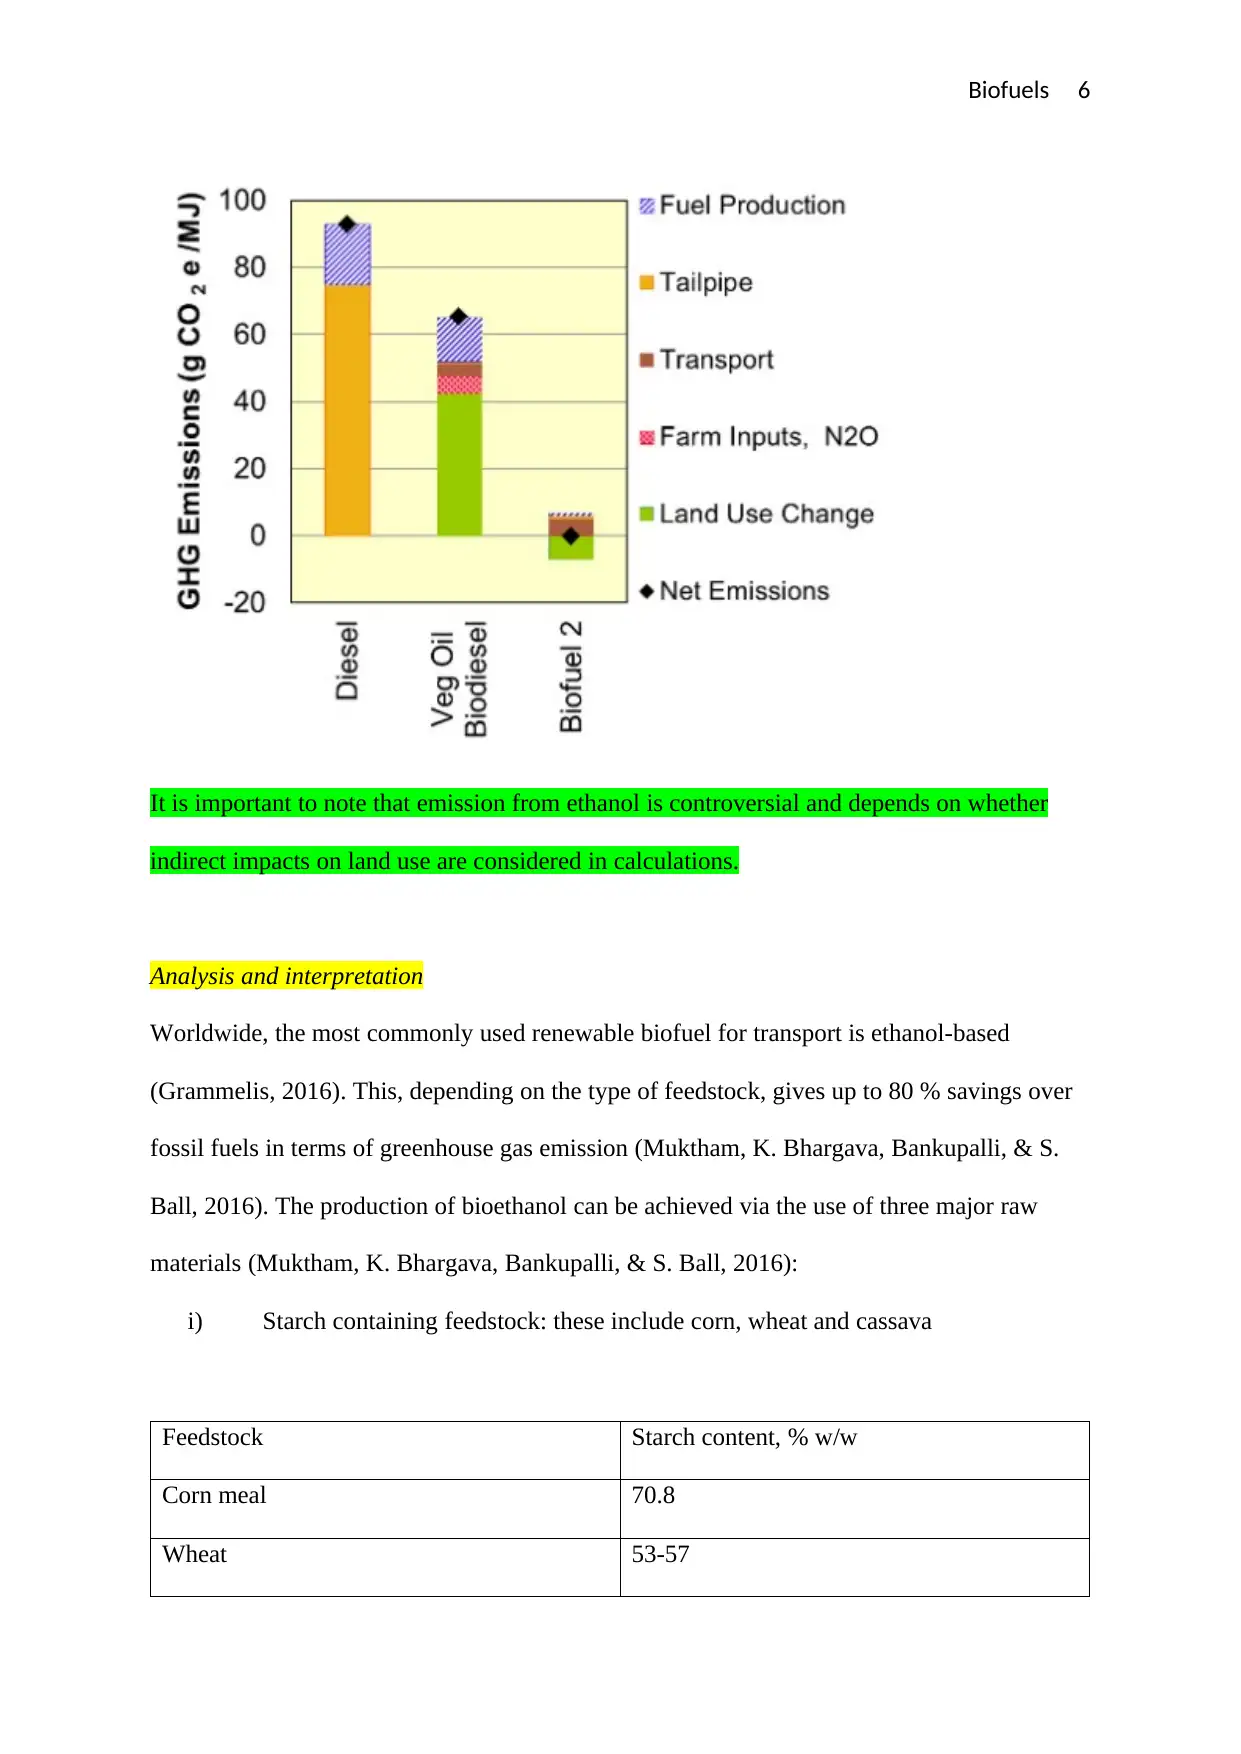
The chart below shows the CO2 contributions for different types of fuels at different stages of
fuel production. The chart shows that, the carbon (iv) oxide emissions associated with the
production of biofuels is very low compared to the CO2 emissions associated with the
production of fossil fuels such as diesesl.
The standard molar enthalpy of combustion of ethanol is about -1366.8 kJ/mol. This is the
heat amount released on completely burning a mole of ethanol at the standard state conditions
of 25 degree Celsius and a pressure of 1 atm. This is significantly lower than that of gasoline
(octane) which is approximately -5460 kJ/mol. Therefore, the burning of gasoline releases
more energy compared to ethanol. However, in terms of CO2 emission, ethanol reduces
emissions by about 34 % on average compared to octane. This is because the carbon (iv)
oxide emitted during the burning of ethanol is reused by the growing of feedstocks for
ethanol production. Compared to pure gasoline, ethanol and other fuels obtained from its
mixture with gasoline have higher levels of octane and therefore have lower emissions.
However, ethanol and its derivatives have higher ground-level emissions which result from
fuel tanks and other dispensing apparatus. The table below shows the CO2 emissions for
different fuel types.
The chart below shows the CO2 contributions for different types of fuels at different stages of
fuel production. The chart shows that, the carbon (iv) oxide emissions associated with the
production of biofuels is very low compared to the CO2 emissions associated with the
production of fossil fuels such as diesesl.
Biofuels 6
It is important to note that emission from ethanol is controversial and depends on whether
indirect impacts on land use are considered in calculations.
Analysis and interpretation
Worldwide, the most commonly used renewable biofuel for transport is ethanol-based
(Grammelis, 2016). This, depending on the type of feedstock, gives up to 80 % savings over
fossil fuels in terms of greenhouse gas emission (Muktham, K. Bhargava, Bankupalli, & S.
Ball, 2016). The production of bioethanol can be achieved via the use of three major raw
materials (Muktham, K. Bhargava, Bankupalli, & S. Ball, 2016):
i) Starch containing feedstock: these include corn, wheat and cassava
Feedstock Starch content, % w/w
Corn meal 70.8
Wheat 53-57
⊘ This is a preview!⊘
Do you want full access?
Subscribe today to unlock all pages.
Trusted by 1+ million students worldwide

Biofuels 7
Cassava 76-81
Table 1: Starch content for different types of starch-based feedstock
html.scirp.org/file/_3-2210171_1.htm
ii) Sucrose containing feedstock: these include sugar beet and sugarcane
Feedstock Sucrose content, % w/w
Sugarcane 31.8
Sugar beet juice 16.5
Sweet sorghum stalks 67.4
Table 2: Sucrose content for different types of sucrose-based feedstock
html.scirp.org/file/_3-2210171_1.htm
iii) Cellulose containing feedstock: for example wood, straw and grass
Figure 2: Ethanol yield per tonne of feedstock
Paraphrase This Document
Need a fresh take? Get an instant paraphrase of this document with our AI Paraphraser
Biofuels 8
https://www.ambientediritto.it/dottrina/Politiche%20energetiche%20ambientali/politiche
%20e.a/img_food_crops/img11.jpg
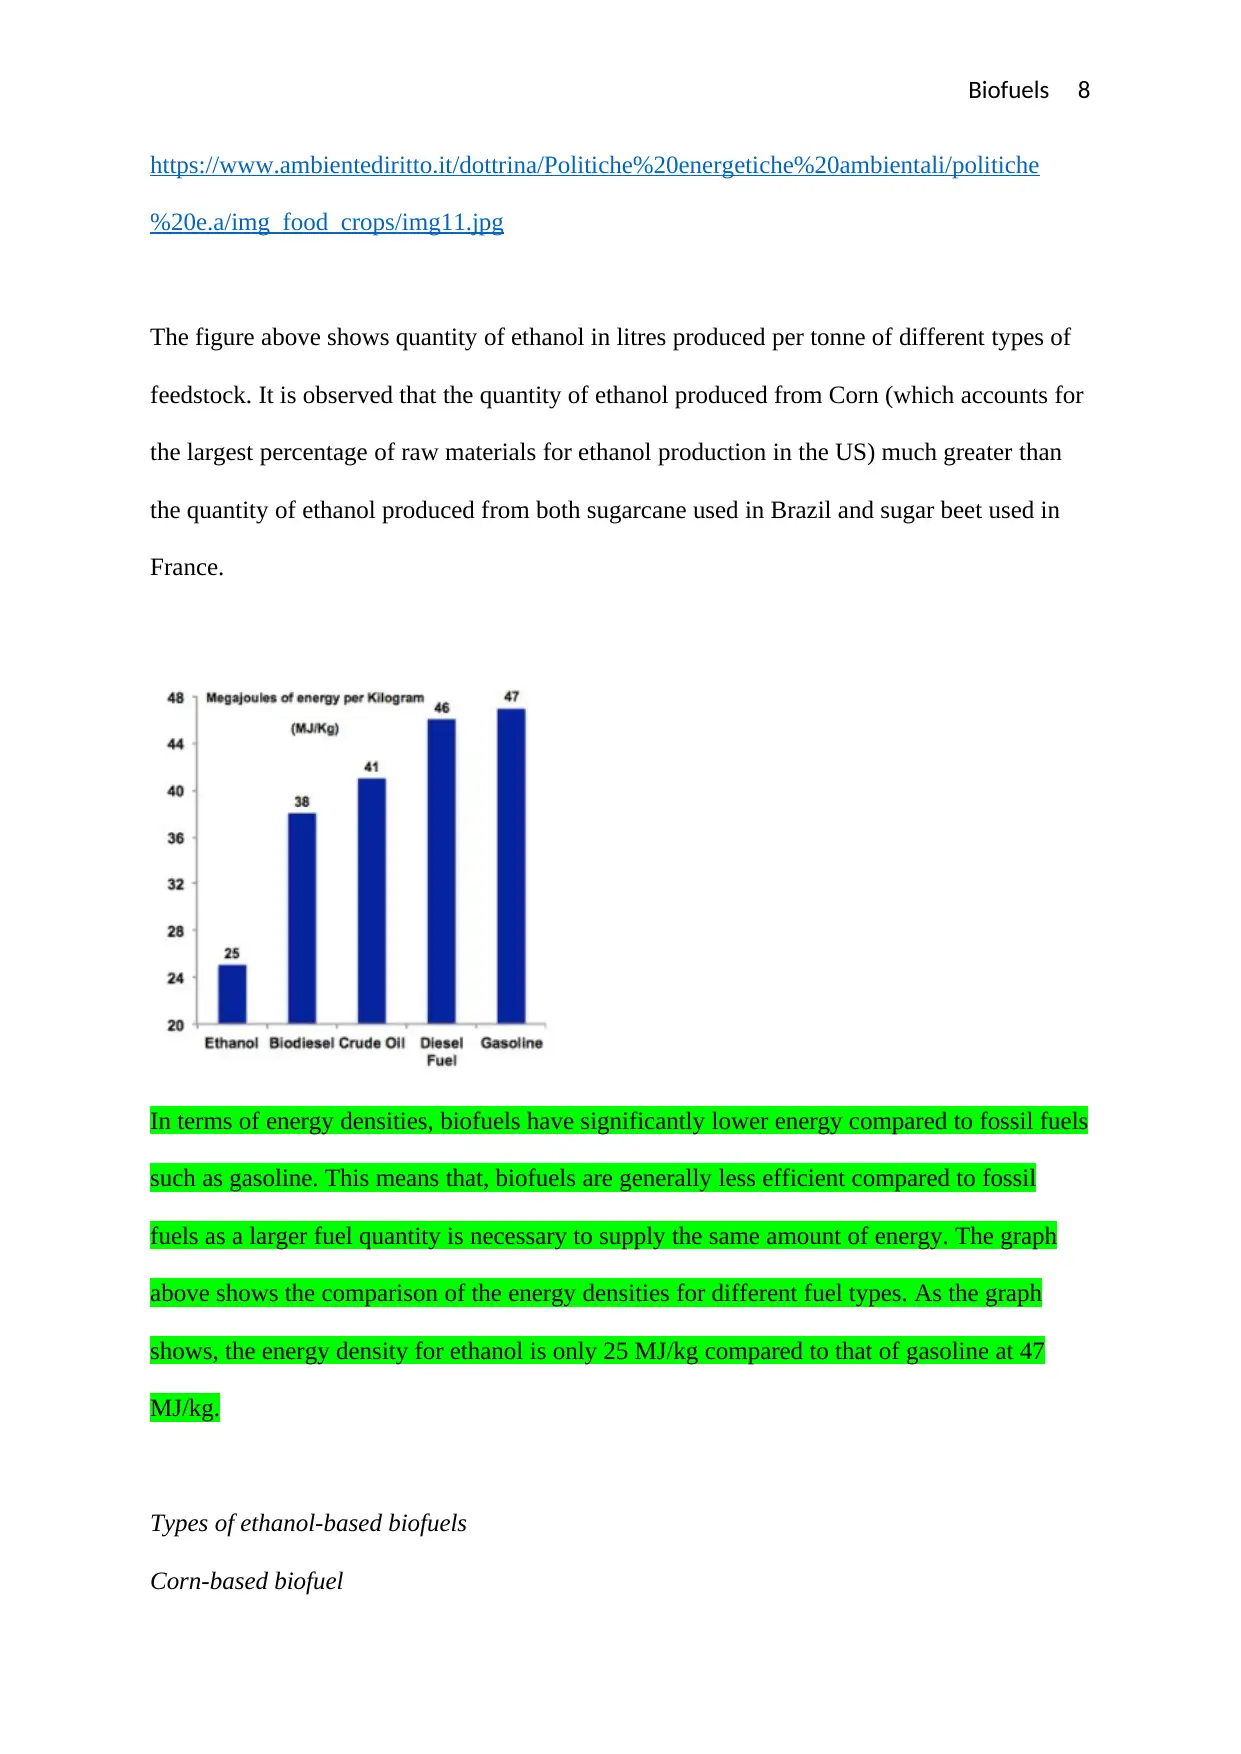
The figure above shows quantity of ethanol in litres produced per tonne of different types of
feedstock. It is observed that the quantity of ethanol produced from Corn (which accounts for
the largest percentage of raw materials for ethanol production in the US) much greater than
the quantity of ethanol produced from both sugarcane used in Brazil and sugar beet used in
France.
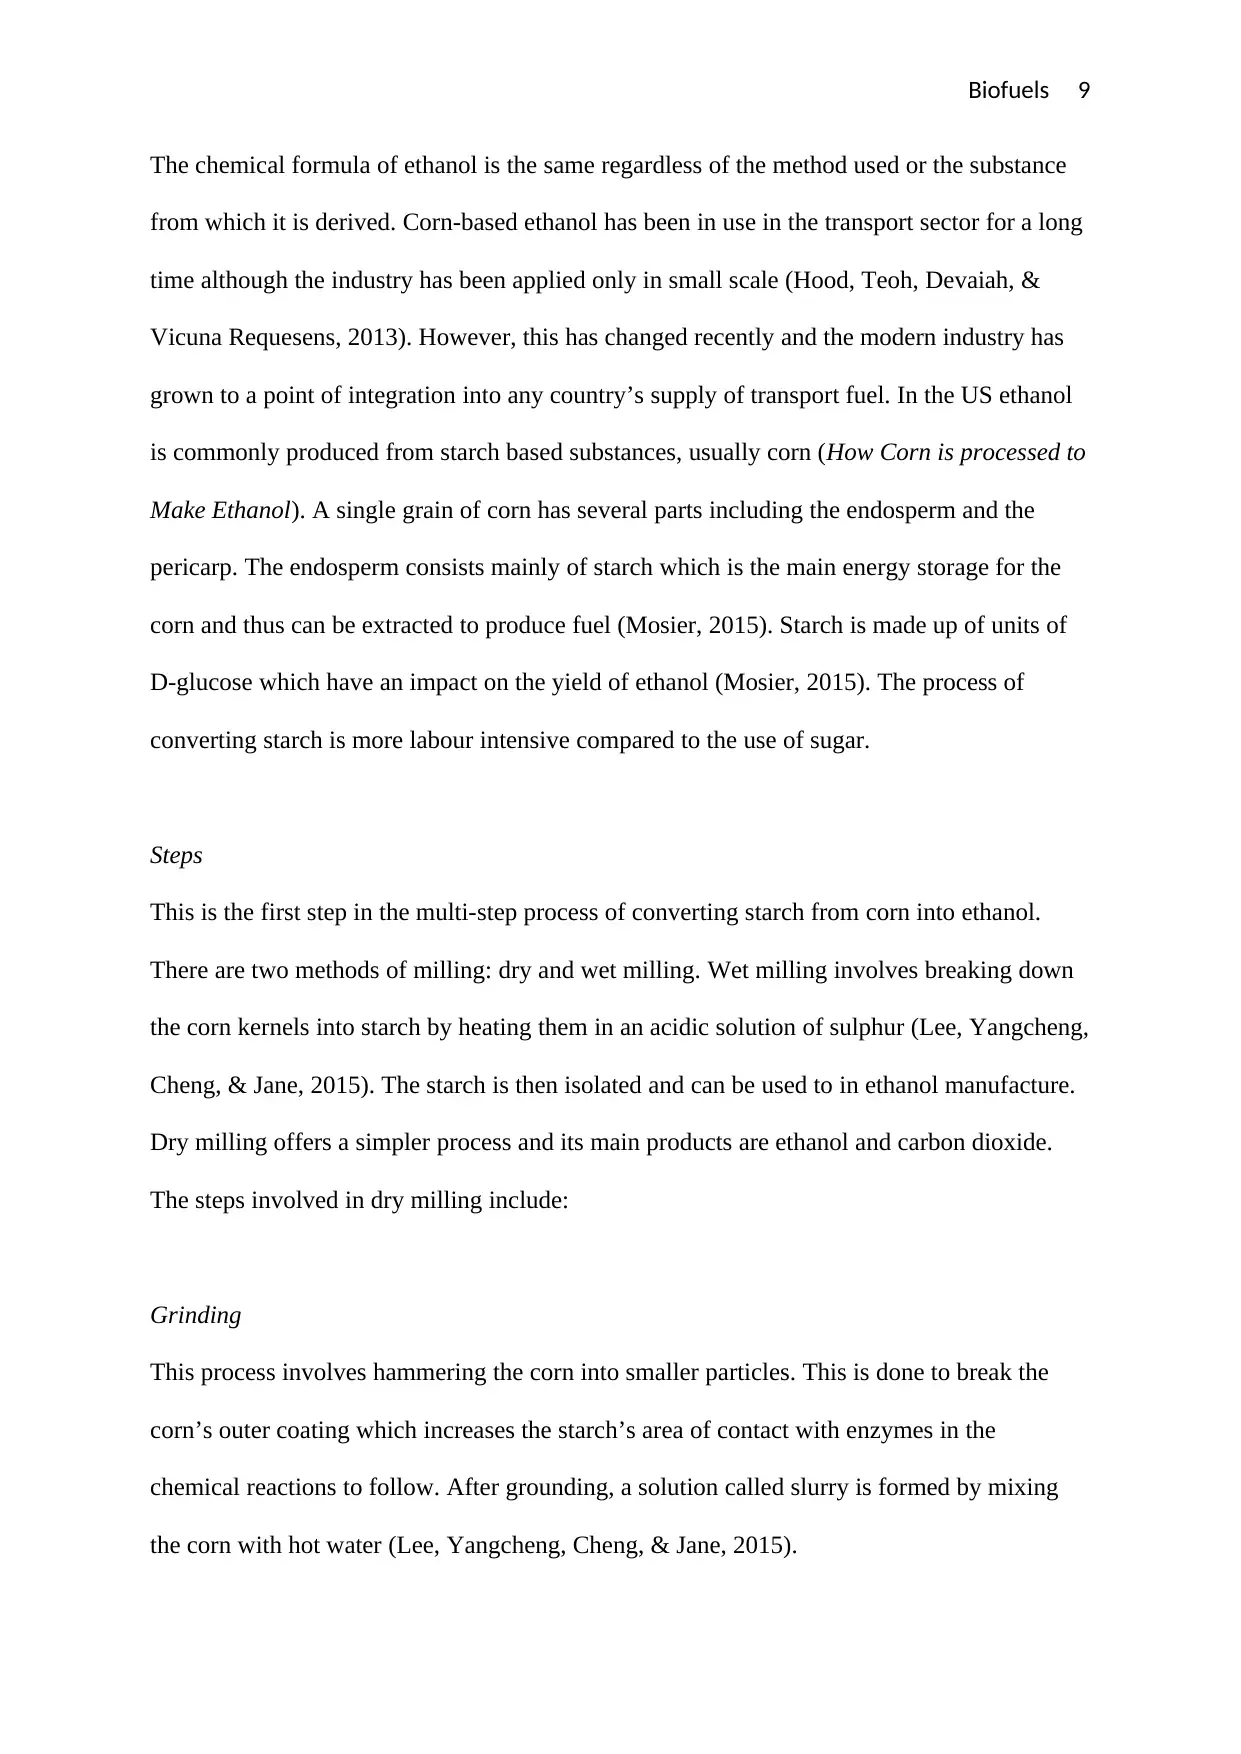
In terms of energy densities, biofuels have significantly lower energy compared to fossil fuels
such as gasoline. This means that, biofuels are generally less efficient compared to fossil
fuels as a larger fuel quantity is necessary to supply the same amount of energy. The graph
above shows the comparison of the energy densities for different fuel types. As the graph
shows, the energy density for ethanol is only 25 MJ/kg compared to that of gasoline at 47
MJ/kg.
Types of ethanol-based biofuels
Corn-based biofuel
https://www.ambientediritto.it/dottrina/Politiche%20energetiche%20ambientali/politiche
%20e.a/img_food_crops/img11.jpg
The figure above shows quantity of ethanol in litres produced per tonne of different types of
feedstock. It is observed that the quantity of ethanol produced from Corn (which accounts for
the largest percentage of raw materials for ethanol production in the US) much greater than
the quantity of ethanol produced from both sugarcane used in Brazil and sugar beet used in
France.
In terms of energy densities, biofuels have significantly lower energy compared to fossil fuels
such as gasoline. This means that, biofuels are generally less efficient compared to fossil
fuels as a larger fuel quantity is necessary to supply the same amount of energy. The graph
above shows the comparison of the energy densities for different fuel types. As the graph
shows, the energy density for ethanol is only 25 MJ/kg compared to that of gasoline at 47
MJ/kg.
Types of ethanol-based biofuels
Corn-based biofuel
Biofuels 9
The chemical formula of ethanol is the same regardless of the method used or the substance
from which it is derived. Corn-based ethanol has been in use in the transport sector for a long
time although the industry has been applied only in small scale (Hood, Teoh, Devaiah, &
Vicuna Requesens, 2013). However, this has changed recently and the modern industry has
grown to a point of integration into any country’s supply of transport fuel. In the US ethanol
is commonly produced from starch based substances, usually corn (How Corn is processed to
Make Ethanol). A single grain of corn has several parts including the endosperm and the
pericarp. The endosperm consists mainly of starch which is the main energy storage for the
corn and thus can be extracted to produce fuel (Mosier, 2015). Starch is made up of units of
D-glucose which have an impact on the yield of ethanol (Mosier, 2015). The process of
converting starch is more labour intensive compared to the use of sugar.
Steps
This is the first step in the multi-step process of converting starch from corn into ethanol.
There are two methods of milling: dry and wet milling. Wet milling involves breaking down
the corn kernels into starch by heating them in an acidic solution of sulphur (Lee, Yangcheng,
Cheng, & Jane, 2015). The starch is then isolated and can be used to in ethanol manufacture.
Dry milling offers a simpler process and its main products are ethanol and carbon dioxide.
The steps involved in dry milling include:
Grinding
This process involves hammering the corn into smaller particles. This is done to break the
corn’s outer coating which increases the starch’s area of contact with enzymes in the
chemical reactions to follow. After grounding, a solution called slurry is formed by mixing
the corn with hot water (Lee, Yangcheng, Cheng, & Jane, 2015).
⊘ This is a preview!⊘
Do you want full access?
Subscribe today to unlock all pages.
Trusted by 1+ million students worldwide
Biofuels 10
Liquefaction
In this stage, the starch in the slurry interacts with water molecules forming a viscous
suspension. Liquefaction is a partial hydrolysis process that breaks down long chain starch
molecules into smaller chains (Wang, Han, Dunn, Cai, & Elgowainy, 2015).
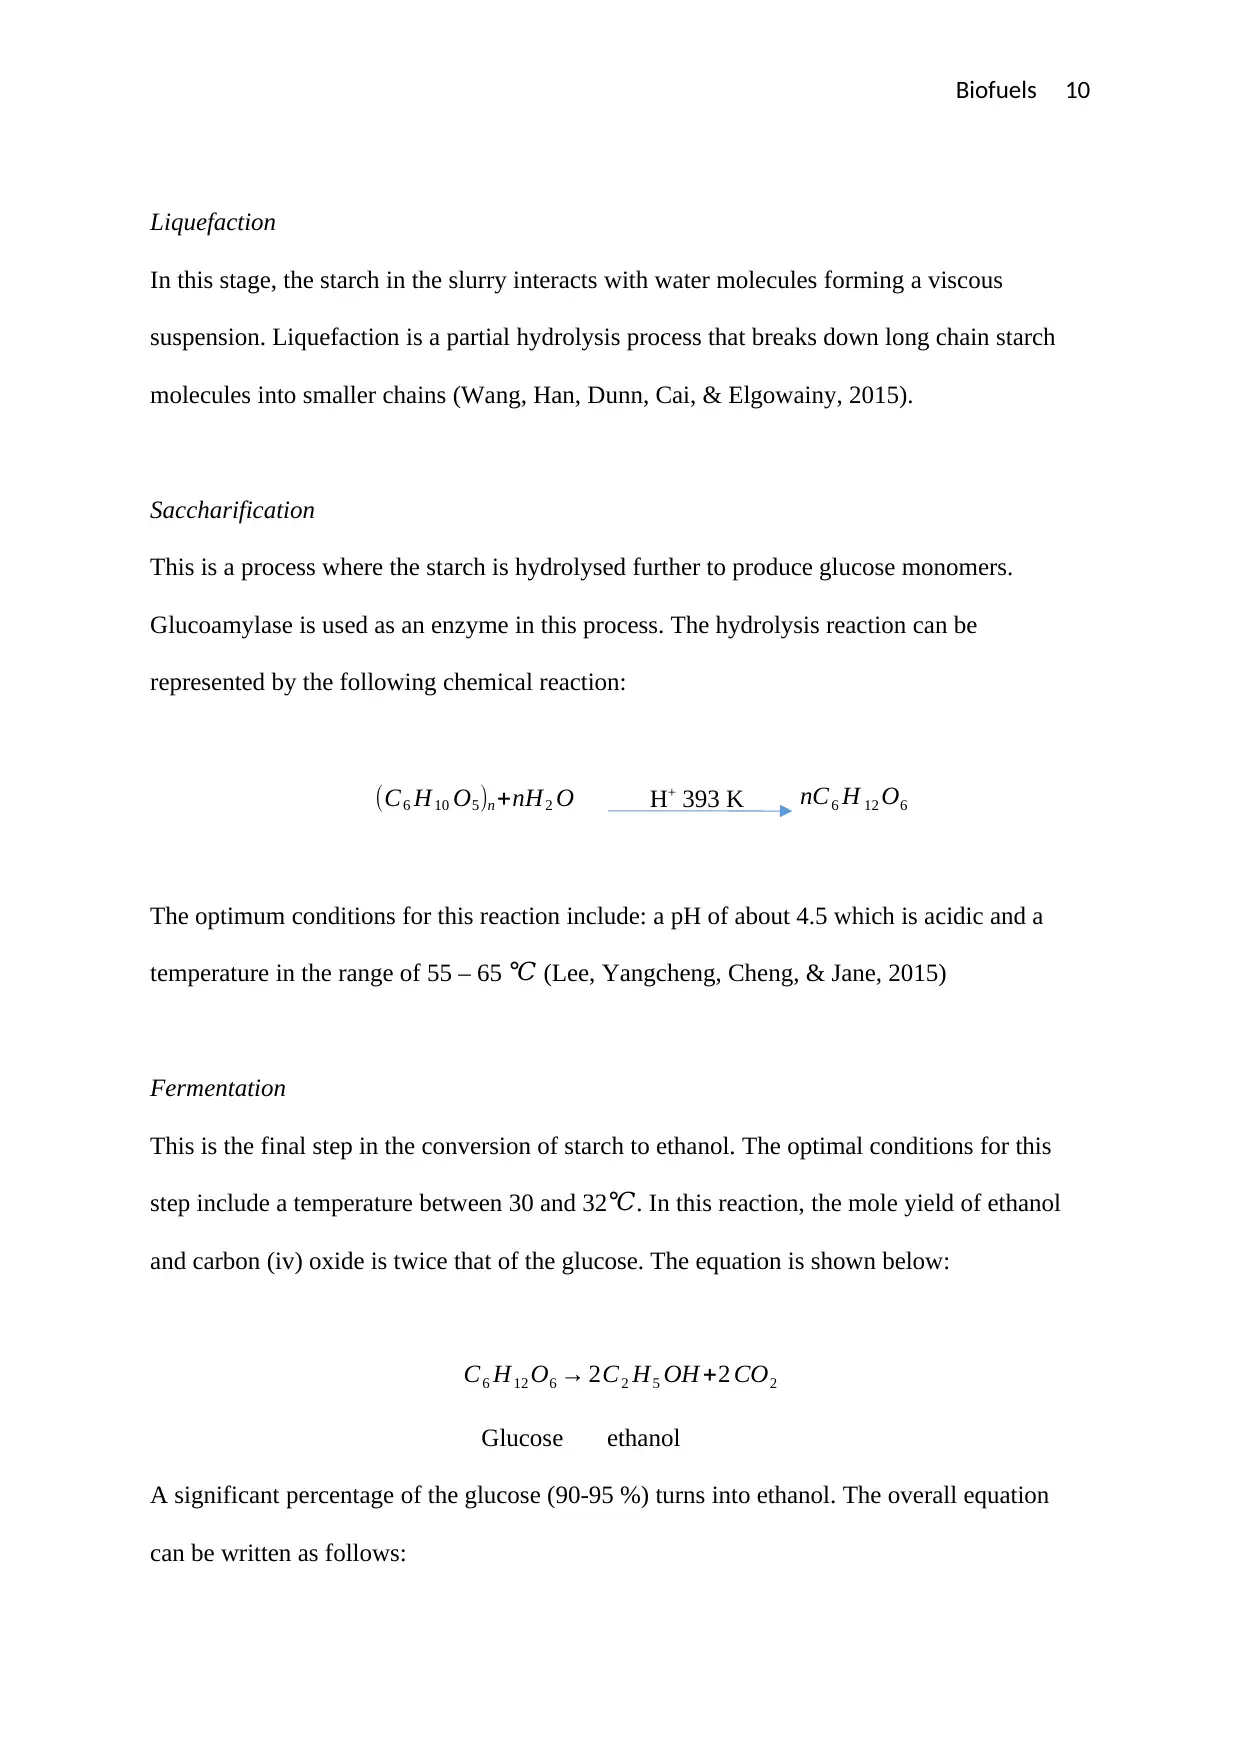
Saccharification
This is a process where the starch is hydrolysed further to produce glucose monomers.
Glucoamylase is used as an enzyme in this process. The hydrolysis reaction can be
represented by the following chemical reaction:
(C6 H10 O5)n +nH2 O H+ 393 K nC6 H 12 O6
The optimum conditions for this reaction include: a pH of about 4.5 which is acidic and a
temperature in the range of 55 – 65 ℃ (Lee, Yangcheng, Cheng, & Jane, 2015)
Fermentation
This is the final step in the conversion of starch to ethanol. The optimal conditions for this
step include a temperature between 30 and 32 ℃. In this reaction, the mole yield of ethanol
and carbon (iv) oxide is twice that of the glucose. The equation is shown below:
C6 H12 O6 → 2C2 H5 OH +2 CO2
Glucose ethanol
A significant percentage of the glucose (90-95 %) turns into ethanol. The overall equation
can be written as follows:
Liquefaction
In this stage, the starch in the slurry interacts with water molecules forming a viscous
suspension. Liquefaction is a partial hydrolysis process that breaks down long chain starch
molecules into smaller chains (Wang, Han, Dunn, Cai, & Elgowainy, 2015).
Saccharification
This is a process where the starch is hydrolysed further to produce glucose monomers.
Glucoamylase is used as an enzyme in this process. The hydrolysis reaction can be
represented by the following chemical reaction:
(C6 H10 O5)n +nH2 O H+ 393 K nC6 H 12 O6
The optimum conditions for this reaction include: a pH of about 4.5 which is acidic and a
temperature in the range of 55 – 65 ℃ (Lee, Yangcheng, Cheng, & Jane, 2015)
Fermentation
This is the final step in the conversion of starch to ethanol. The optimal conditions for this
step include a temperature between 30 and 32 ℃. In this reaction, the mole yield of ethanol
and carbon (iv) oxide is twice that of the glucose. The equation is shown below:
C6 H12 O6 → 2C2 H5 OH +2 CO2
Glucose ethanol
A significant percentage of the glucose (90-95 %) turns into ethanol. The overall equation
can be written as follows:
Paraphrase This Document
Need a fresh take? Get an instant paraphrase of this document with our AI Paraphraser
Biofuels 11
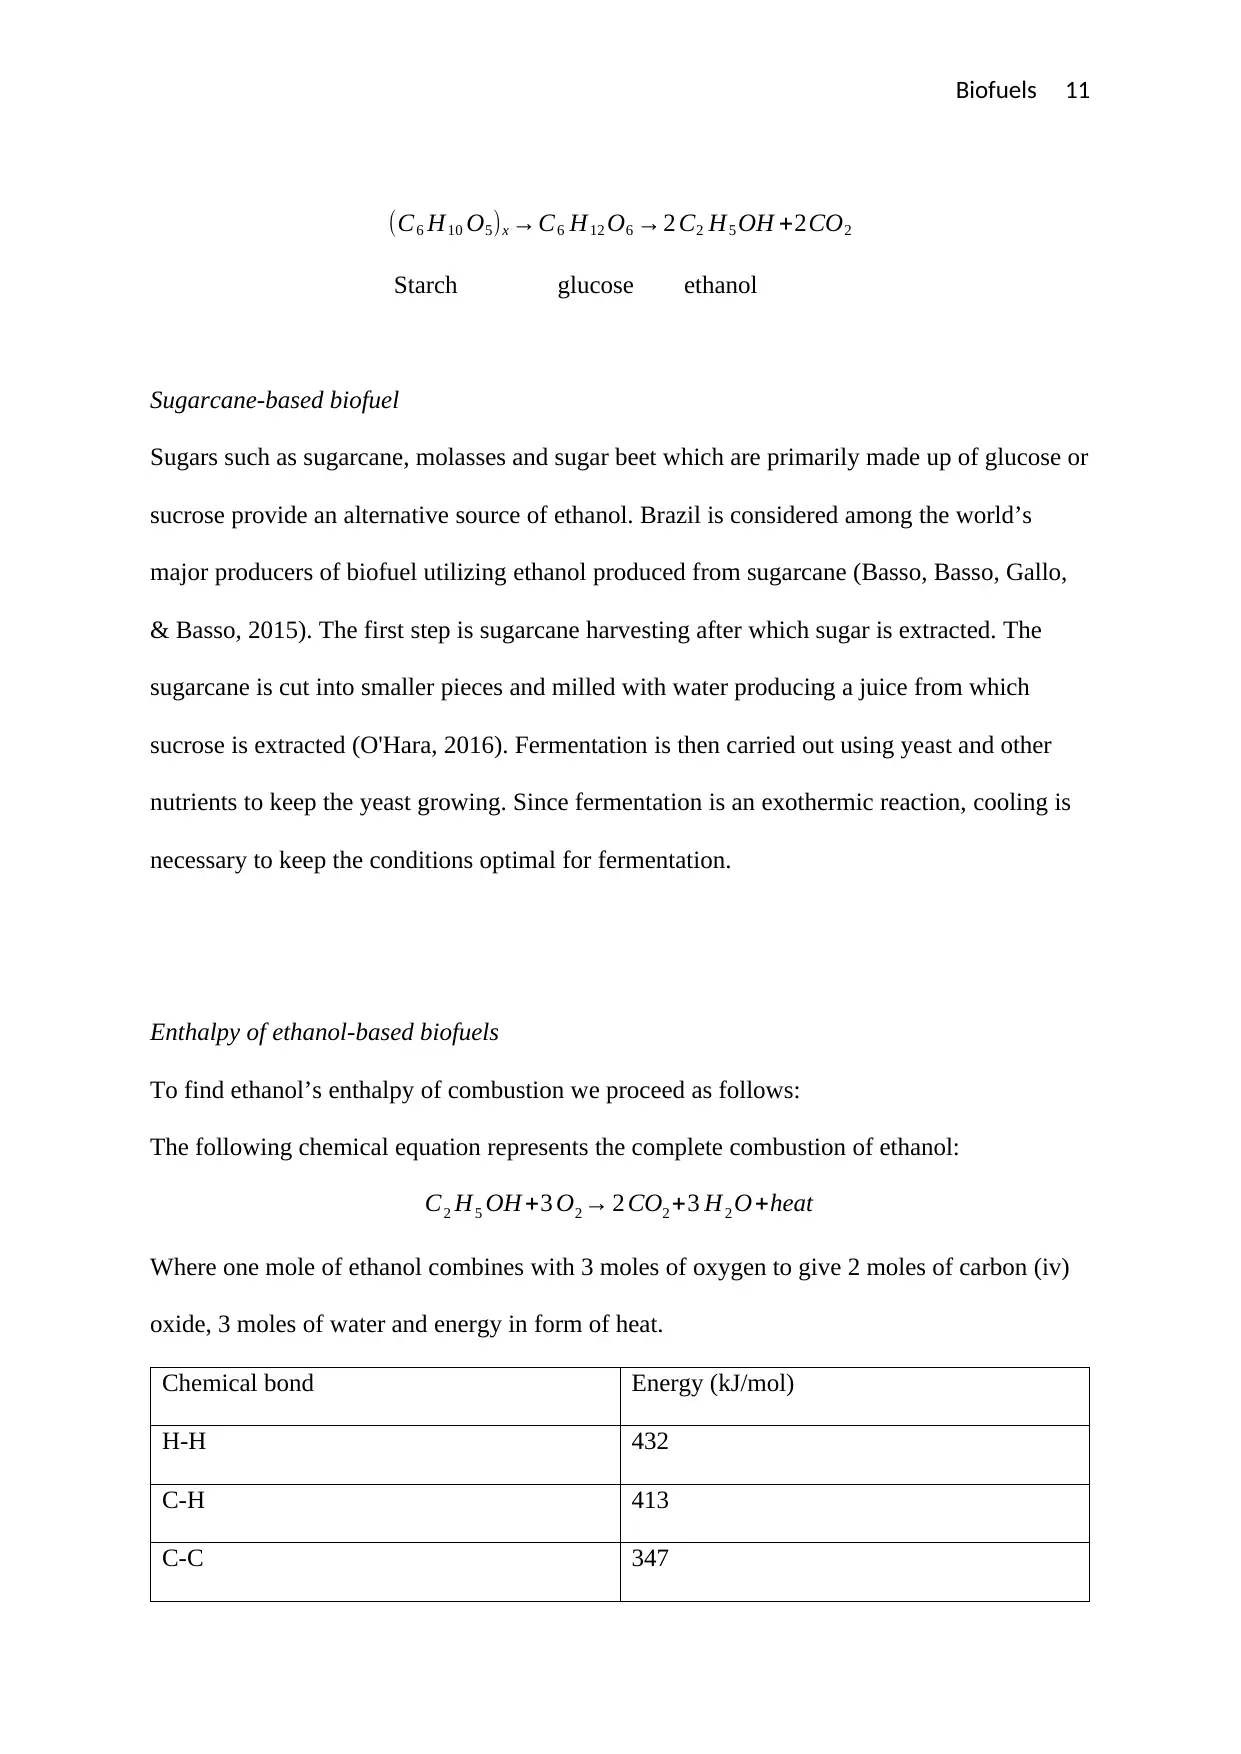
(C6 H10 O5)x →C6 H12 O6 →2 C2 H5 OH +2CO2
Starch glucose ethanol
Sugarcane-based biofuel
Sugars such as sugarcane, molasses and sugar beet which are primarily made up of glucose or
sucrose provide an alternative source of ethanol. Brazil is considered among the world’s
major producers of biofuel utilizing ethanol produced from sugarcane (Basso, Basso, Gallo,
& Basso, 2015). The first step is sugarcane harvesting after which sugar is extracted. The
sugarcane is cut into smaller pieces and milled with water producing a juice from which
sucrose is extracted (O'Hara, 2016). Fermentation is then carried out using yeast and other
nutrients to keep the yeast growing. Since fermentation is an exothermic reaction, cooling is
necessary to keep the conditions optimal for fermentation.
Enthalpy of ethanol-based biofuels
To find ethanol’s enthalpy of combustion we proceed as follows:
The following chemical equation represents the complete combustion of ethanol:
C2 H5 OH +3 O2 → 2 CO2 +3 H2 O+heat
Where one mole of ethanol combines with 3 moles of oxygen to give 2 moles of carbon (iv)
oxide, 3 moles of water and energy in form of heat.
Chemical bond Energy (kJ/mol)
H-H 432
C-H 413
C-C 347
Biofuels 12
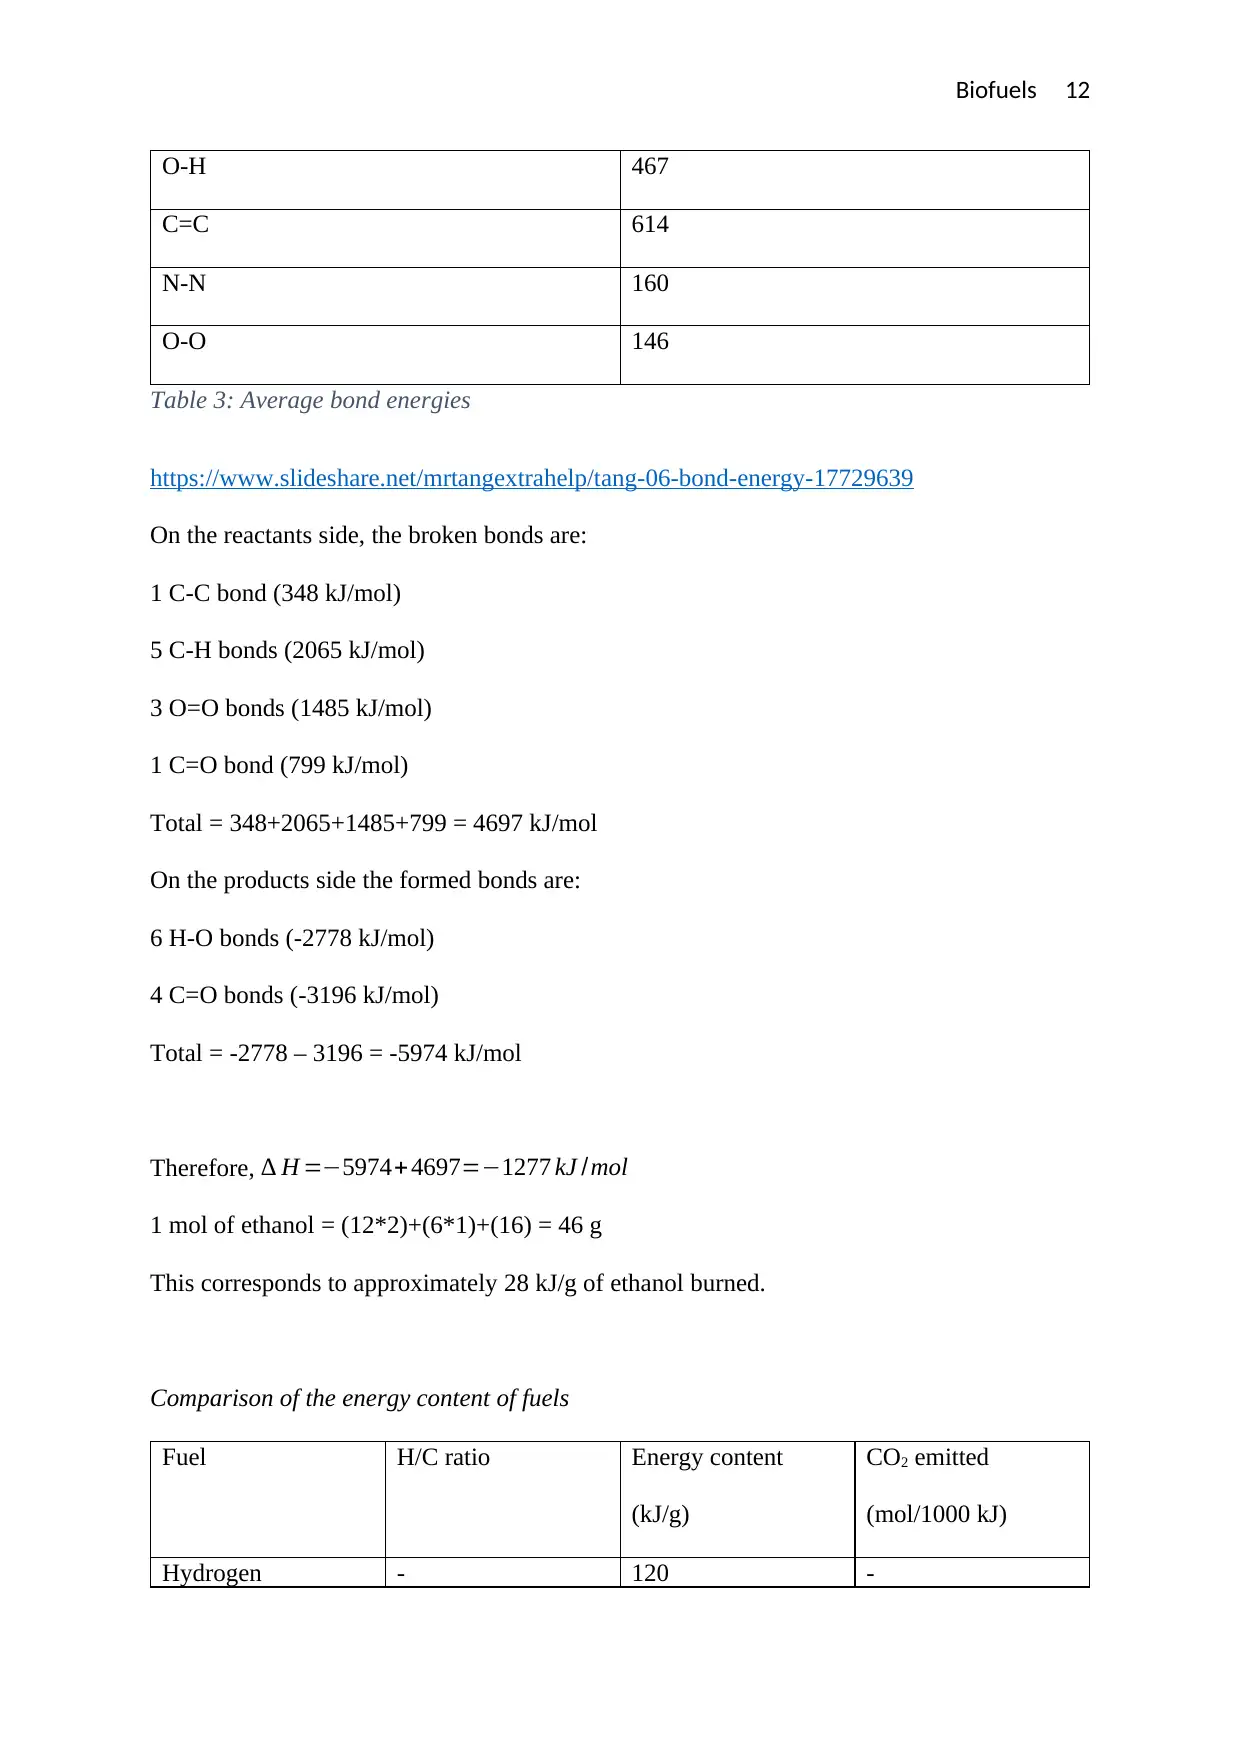
O-H 467
C=C 614
N-N 160
O-O 146
Table 3: Average bond energies
https://www.slideshare.net/mrtangextrahelp/tang-06-bond-energy-17729639
On the reactants side, the broken bonds are:
1 C-C bond (348 kJ/mol)
5 C-H bonds (2065 kJ/mol)
3 O=O bonds (1485 kJ/mol)
1 C=O bond (799 kJ/mol)
Total = 348+2065+1485+799 = 4697 kJ/mol
On the products side the formed bonds are:
6 H-O bonds (-2778 kJ/mol)
4 C=O bonds (-3196 kJ/mol)
Total = -2778 – 3196 = -5974 kJ/mol
Therefore, ∆ H =−5974+ 4697=−1277 kJ /mol
1 mol of ethanol = (12*2)+(6*1)+(16) = 46 g
This corresponds to approximately 28 kJ/g of ethanol burned.
Comparison of the energy content of fuels
Fuel H/C ratio Energy content
(kJ/g)
CO2 emitted
(mol/1000 kJ)
Hydrogen - 120 -
⊘ This is a preview!⊘
Do you want full access?
Subscribe today to unlock all pages.
Trusted by 1+ million students worldwide
1 out of 20
Related Documents


Your All-in-One AI-Powered Toolkit for Academic Success.
+13062052269
info@desklib.com
Available 24*7 on WhatsApp / Email
![[object Object]](/_next/static/media/star-bottom.7253800d.svg)
Unlock your academic potential
Copyright © 2020–2026 A2Z Services. All Rights Reserved. Developed and managed by ZUCOL.