Biomechanics of Sport and Exercise: Sprint Start Performance Analysis

Verified

Added on  2023/03/23

|39
|4615
|27
Quiz and Exam
AI Summary
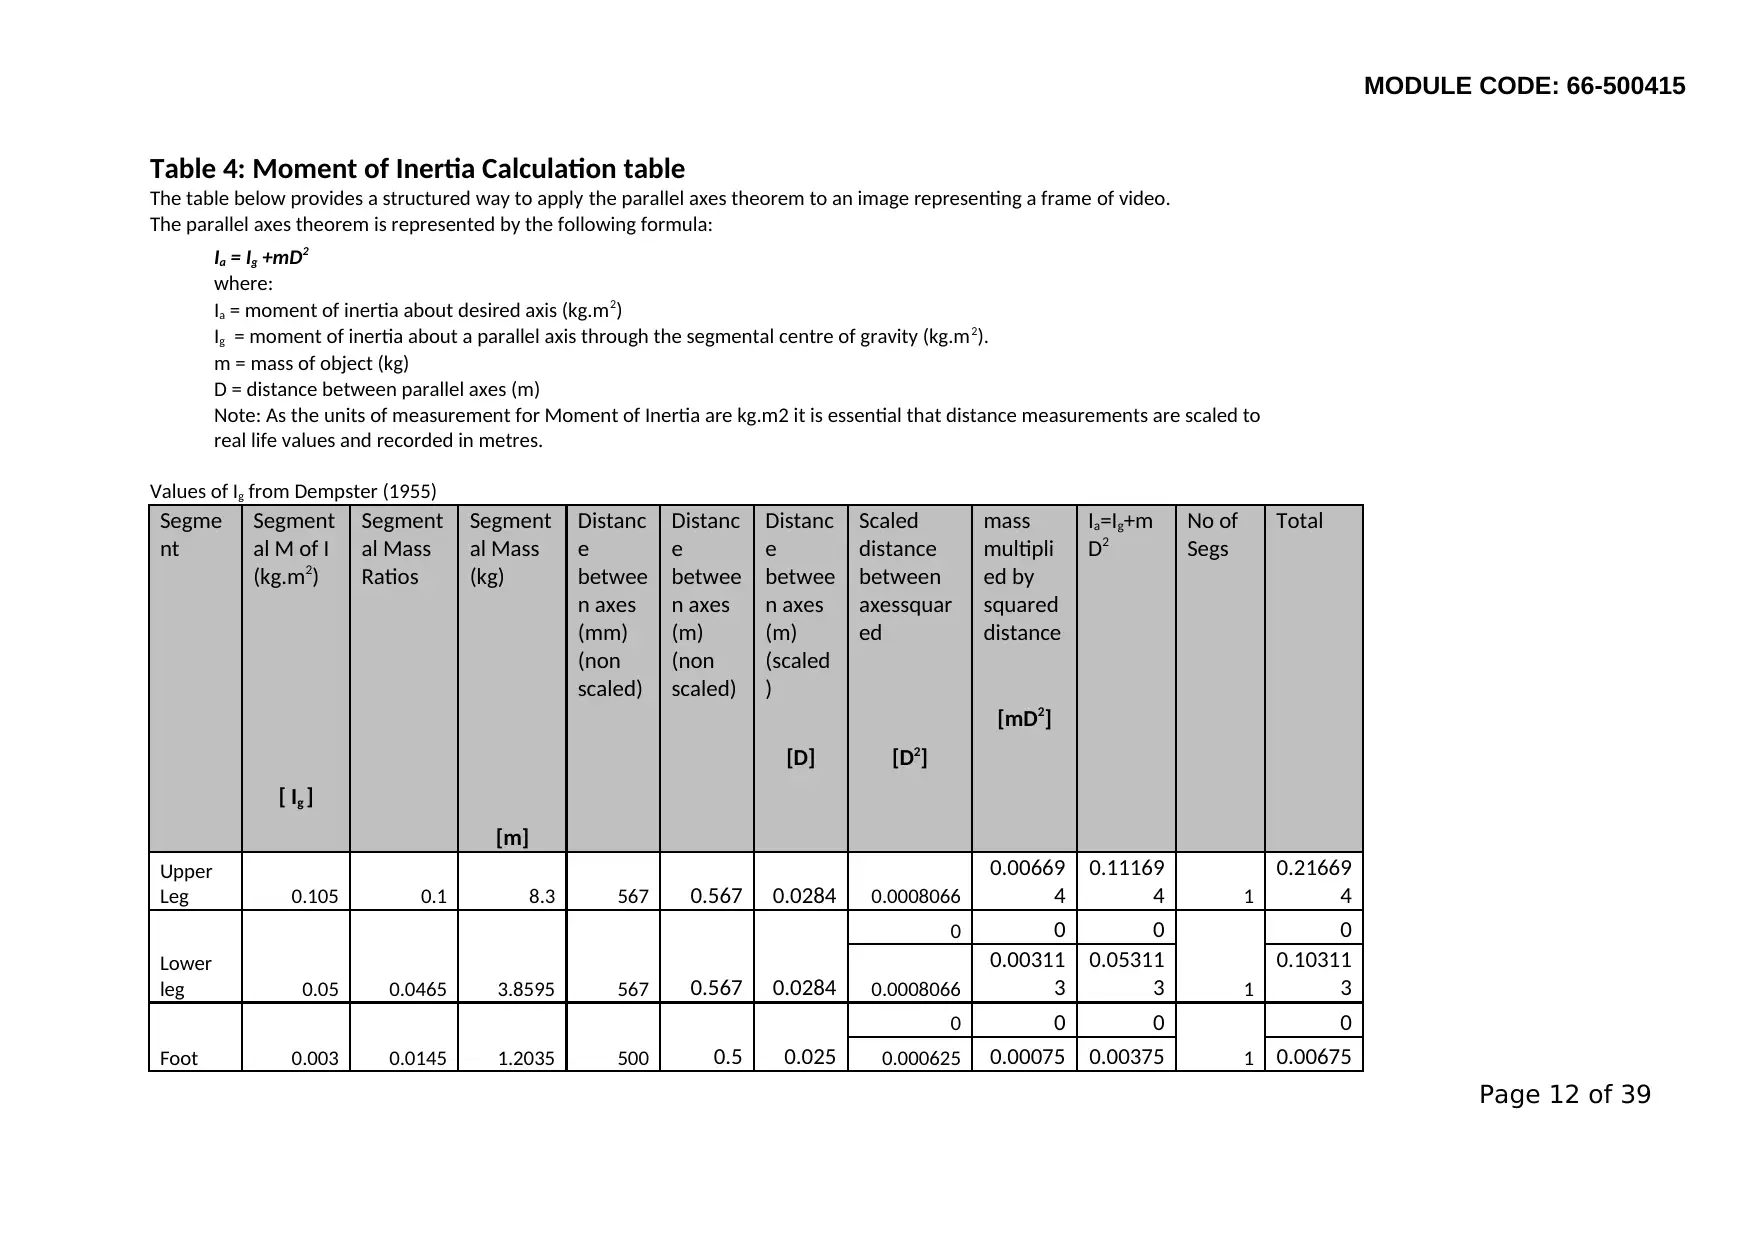
This document presents a solved biomechanics exam centered on the analysis of sprint start performance and the impact of induced leg length discrepancy. The exam questions cover topics such as calculating average velocity from split times, explaining the ratio of forces, identifying limitations of force platforms, determining impulse and change in velocity from horizontal force data, interpreting bivariate Pearson's correlations, and calculating moment of inertia. Additionally, the exam explores the impact of induced leg length discrepancy on running kinematics, including frame rate and shutter speed, sources of error in 2D video capture, contact and non-contact time calculations, and the relationship between running speed, stride length, and stride frequency. Segment angles are also calculated based on coordinate data. The solutions provide detailed calculations and explanations for each question.
Document Page
MODULE CODE: 66-500415
SEMESTER TWO EXAMINATION-MAY 2019
MAIN
FACULTY: Health and Wellbeing
DEPARTMENT: Academy of Sport and Physical Activity
MODULE TITLE: Biomechanics of Sport and Exercise
MODULE LEADER: Dr Andrew Barnes
TIME ALLOWED: 2 hours (plus 10 minutes reading time)
___________________________________________________________________
EXAMINATIONCONDUCT:
1. The Examination Conduct Policy outlines the behavioural expectations of
candidates attending any examination.
2. It is a fundamental principle that students are assessed fairly and equitably. The
University Academic Conduct Regulation defines unfair behaviour relating to an
examination to be 'cheating'. The University will investigate and may sanction any
acts or behaviours which breach the Code of Academic Conduct.
INSTRUCTIONS TO CANDIDATES:
1. Please do NOT start writing until told to do so by the invigilator.
2. Candidates must NOT use red ink on the script answer book.
3. Candidates will bring their own calculator. Calculators must display a SHU approved
sticker (red).
4. Candidates SHOULD answer ALL questions on the paper. ALL answers
SHOULD be written within this question paper.
5. This is a CLOSED BOOK examination. NO material may be taken into the
examination.
6. This examination paper MAY NOTbe taken from the venue by the candidates.
7. Please write yourSTUDENT ID/DESK NOhere:__________________/_______
_____________________________________________________________________
STATIONERY REQUIREMENTS PER CANDIDATE:
ï‚· 1 x Anonymous Front Cover Sheet
_____________________________________________________________________
THIS PAPER CONTAINS 39 PAGES INCLUDING THIS SHEET Page 1 of 39
tabler-icon-diamond-filled.svg

Paraphrase This Document

Need a fresh take? Get an instant paraphrase of this document with our AI Paraphraser
Document Page
MODULE CODE: 66-500415
This is a blank page
Page 2 of 39
Document Page
MODULE CODE: 66-500415
CASE STUDY ONE - (31marks)
Case-study one investigated the relationship between the technical application of force
and commonly used sprint start performance measures in a group of sport and exercise
science students. Thirty nine students performed a 30m sprint from a crouched start, off
a force platform with split times measured at 10, 20 and 30m.
1. Table 1 gives the 10 metre split times for one student over the 30 metre sprint.
Calculate the average velocity for each 10 metre sector and complete the
velocity column in Table 1.
Table 1.Position, Time and Velocity data for a period of a 100m sprint.
Position (m) Time (s) Velocity (m∙s-1)
0 0 0
10 1.41 7.0922
20 2.47 8.097
30 3.34 8.9820
(3 marks)
2. Morin et al. (2011) advocates the use of ratio of forces to assess sprint start
technique. Explain in your own words what is meant by the term ratio of force
and give the equation to calculate it.
(2 marks)
Ratio of force is the ratio of the Horizontal Ground Reaction Force (FH) to the
Resultant Ground Reaction Force (FTot) produced in a splint and expressed as a
percentage.
RF = FH/ FTot x 100
3. In addition to ratio of forces, name TWO other commonly used variables to
describe sprint start performance.
(2 marks)
i. Velocity
ii. Mean and Maximal Power Output
Page 3 of 39
Document Page
MODULE CODE: 66-500415
Page 4 of 39
tabler-icon-diamond-filled.svg

Paraphrase This Document

Need a fresh take? Get an instant paraphrase of this document with our AI Paraphraser
Document Page
MODULE CODE: 66-500415
4. This data collection used a force platform to capture ground reaction forces
during the push off phase of the sprint start. Give three limitations of using a
force platform to capture ground reaction force data.
(3 marks)
i. They are not very accurate
ii. They are expensive
iii. The subjects have to step on the plates with force.
5. Figure 1 shows a sprinter in the push-off phase of stance. Mark on a vector
arrow that you feel would represent a typical resultant ground reaction force
for this individual.
(2 marks)
Figure 1. Body position of a sprinter during the push off phase of gait
Page 5 of 39
Document Page
MODULE CODE: 66-500415
6. Table 2 contains horizontal force data for a 68 kg student during the push off
phase of a sprint start, captured using a force plate. Using the equations
provided, calculate the impulse and the associated change in velocity over
this period.
Table 2.Horizontal Forces generated during the push off phase of a sprint start
Time (s) Horizontal Force (N)
0.001 22.82
0.002 23.43
0.003 25.26
0.004 26.72
0.005 29.23
0.006 31.60
0.007 33.96
0.008 35.34
(6 marks)
Impulse = Force (N) x Time (s)
Time (s) Horizontal Force (N) Impulse (Ns)
0.001 22.82 0.02282
0.002 23.43 0.04686
0.003 25.26 0.07578
0.004 26.72 0.10688
0.005 29.23 0.14615
0.006 31.6 0.1896
0.007 33.96 0.23772
0.008 35.34 0.28272
Page 6 of 39
Document Page
MODULE CODE: 66-500415
Associated Change in Velocity = Final Velocity (Vf) – Initial Velocity (Vi)
= 0.28272/68000 - 0.02282/68000
= 8.0176 x 10-07m/s
Page 7 of 39
tabler-icon-diamond-filled.svg

Paraphrase This Document

Need a fresh take? Get an instant paraphrase of this document with our AI Paraphraser
Document Page
MODULE CODE: 66-500415
7. To establish the relationship between two kinetic (peak horizontal ground
reaction force and ratio of forces) and two commonly reported kinematic sprint
variables (horizontal block exit velocity and average horizontal block power),
bivariate Pearson's correlations were used. Figure 2 and Table 3 show the
SPSS graphs and output of the analysis.
Figure 2.Scatter plots for two pairs of variables for all students
Question 7 continues on the next page
Page 8 of 39
Document Page
MODULE CODE: 66-500415
Table 3.SPSS output forbivariate Pearson's correlations for calculated variables.
Using the information in Figure 2 and Table 3, summarise the main
findings of the analysis. Discuss the implications of these findings in
relation to sprinting.
(5 marks)
The results obtained show that there is no significant correlation between
horizontal velocity and ratio of forces.
Also, there is no significant correlation between horizontal block exit velocity and
average horizontal block power.
In the first correlation, these results imply that a change in horizontal velocity for
a sprinter has no significance influence on the ratio of forces. In the same
manner, changes in horizontal block velocity have no significance
influence in changes in the average horizontal block power.
Page 9 of 39
Document Page
MODULE CODE: 66-500415
Page 10 of 39
tabler-icon-diamond-filled.svg

Paraphrase This Document

Need a fresh take? Get an instant paraphrase of this document with our AI Paraphraser
Document Page
MODULE CODE: 66-500415
8. Figure 3 shows the position of a sprinter's left leg at first step touch down
obtained from video footage during the acceleration phase of a 100m race. Using
the information contained in Table 4 to support your calculations, calculate the
moment of inertia of the sprinters left leg about the hip joint.
(8 marks)
Segmental joint centres are marked. Mass of participant 83kg. Scale of all figures: 1:20
Figure 3. Frame of video of sprinter at first touchdown
Page 11 of 39
Document Page
MODULE CODE: 66-500415
Table 4: Moment of Inertia Calculation table
The table below provides a structured way to apply the parallel axes theorem to an image representing a frame of video.
The parallel axes theorem is represented by the following formula:
Ia = Ig +mD2
where:
Ia = moment of inertia about desired axis (kg.m2)
Ig = moment of inertia about a parallel axis through the segmental centre of gravity (kg.m2).
m = mass of object (kg)
D = distance between parallel axes (m)
Note: As the units of measurement for Moment of Inertia are kg.m2 it is essential that distance measurements are scaled to
real life values and recorded in metres.
Values of Ig from Dempster (1955)
Segme
nt
Segment
al M of I
(kg.m2)
Segment
al Mass
Ratios
Segment
al Mass
(kg)
Distanc
e
betwee
n axes
(mm)
(non
scaled)
Distanc
e
betwee
n axes
(m)
(non
scaled)
Distanc
e
betwee
n axes
(m)
(scaled
)
Scaled
distance
between
axessquar
ed
mass
multipli
ed by
squared
distance
Ia=Ig+m
D2
No of
Segs
Total
[mD2]
[D] [D2]
[ Ig ]
[m]
Upper
Leg 0.105 0.1 8.3 567 0.567 0.0284 0.0008066
0.00669
4
0.11169
4 1
0.21669
4
Lower
leg 0.0465
0 0 0
1
0
0.05 3.8595 567 0.567 0.0284 0.0008066
0.00311
3
0.05311
3
0.10311
3
Foot 0.0145
0 0 0
1
0
0.003 1.2035 500 0.5 0.025 0.000625 0.00075 0.00375 0.00675
Page 12 of 39
chevron_up_icon
1 out of 39
circle_padding
hide_on_mobile
zoom_out_icon
[object Object]