Biostat 401077 Introduction to Biostatistics Assignment 2 Analysis

Verified

Added on  2022/12/09

|10
|1010
|386
Homework Assignment
AI Summary
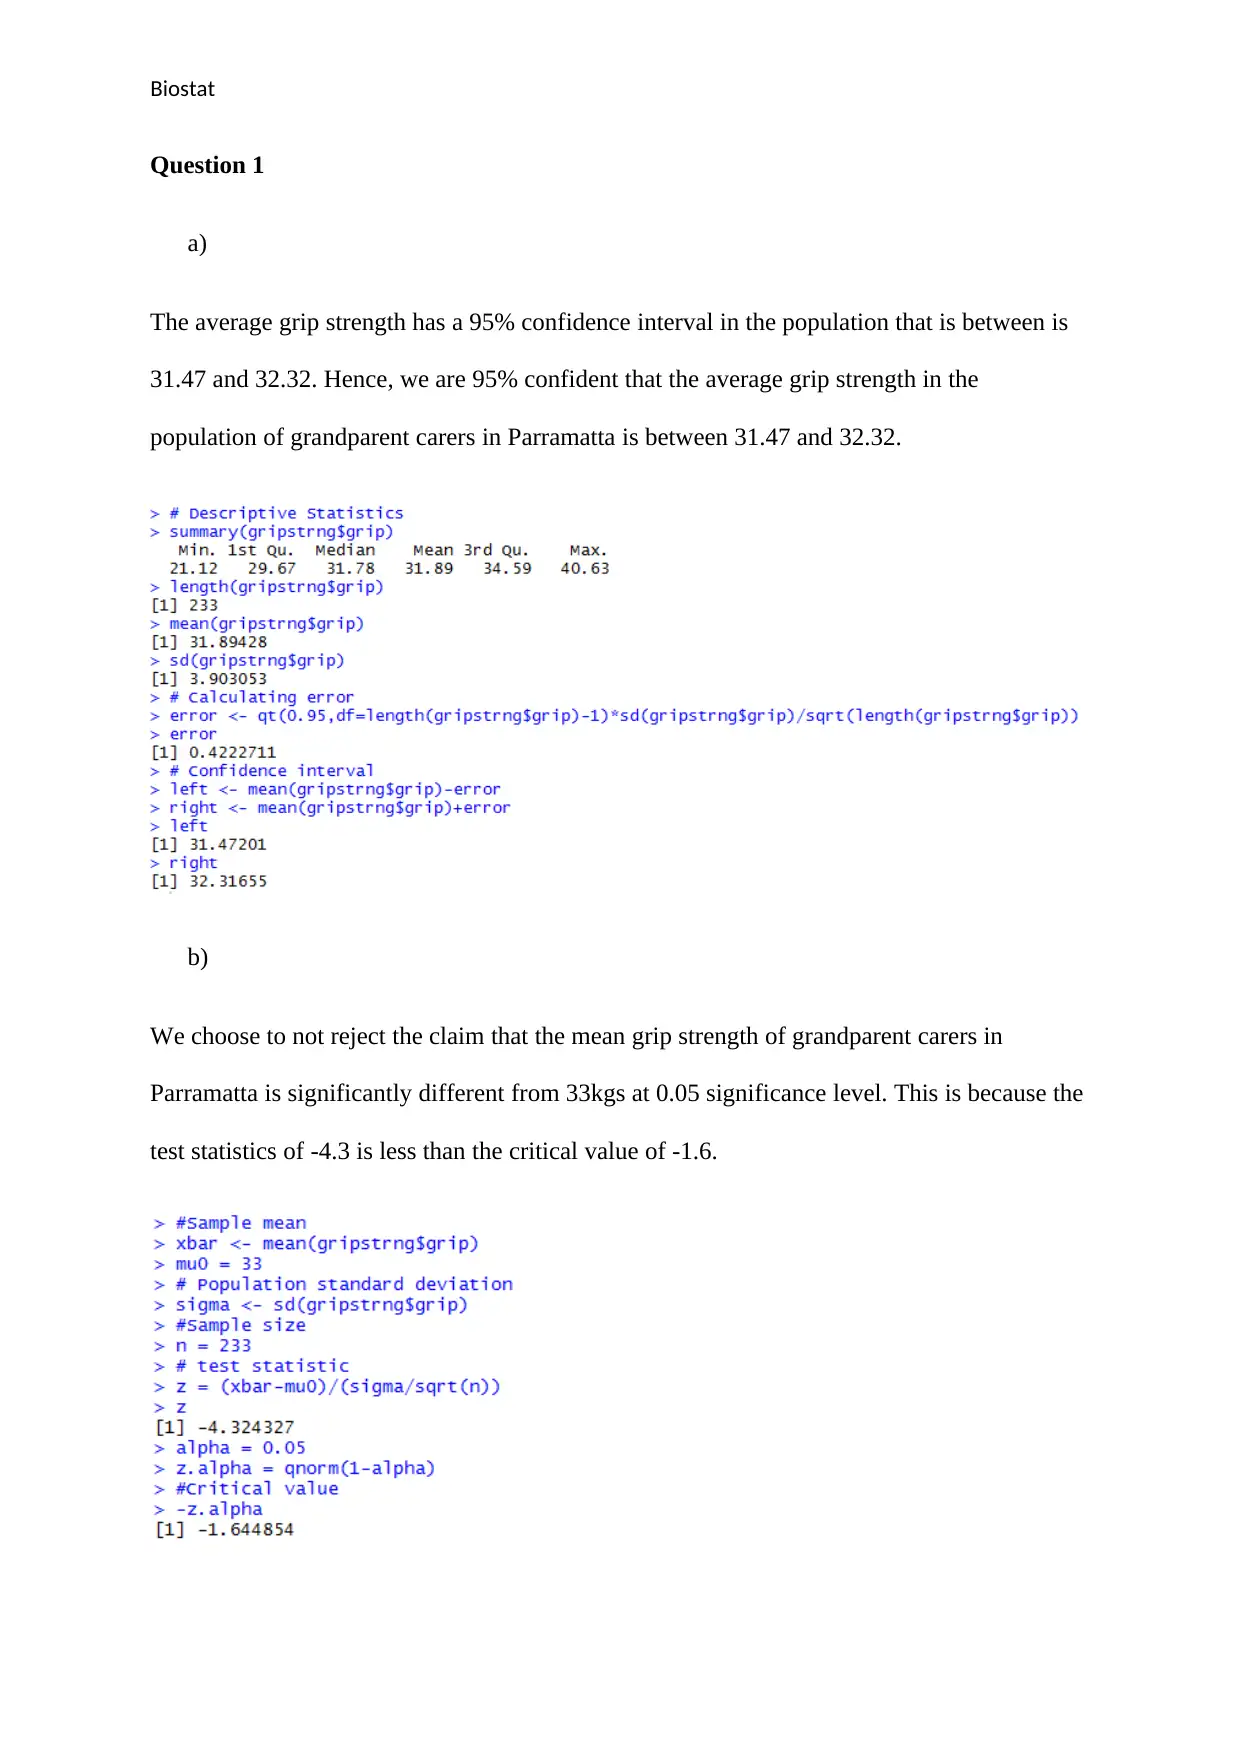
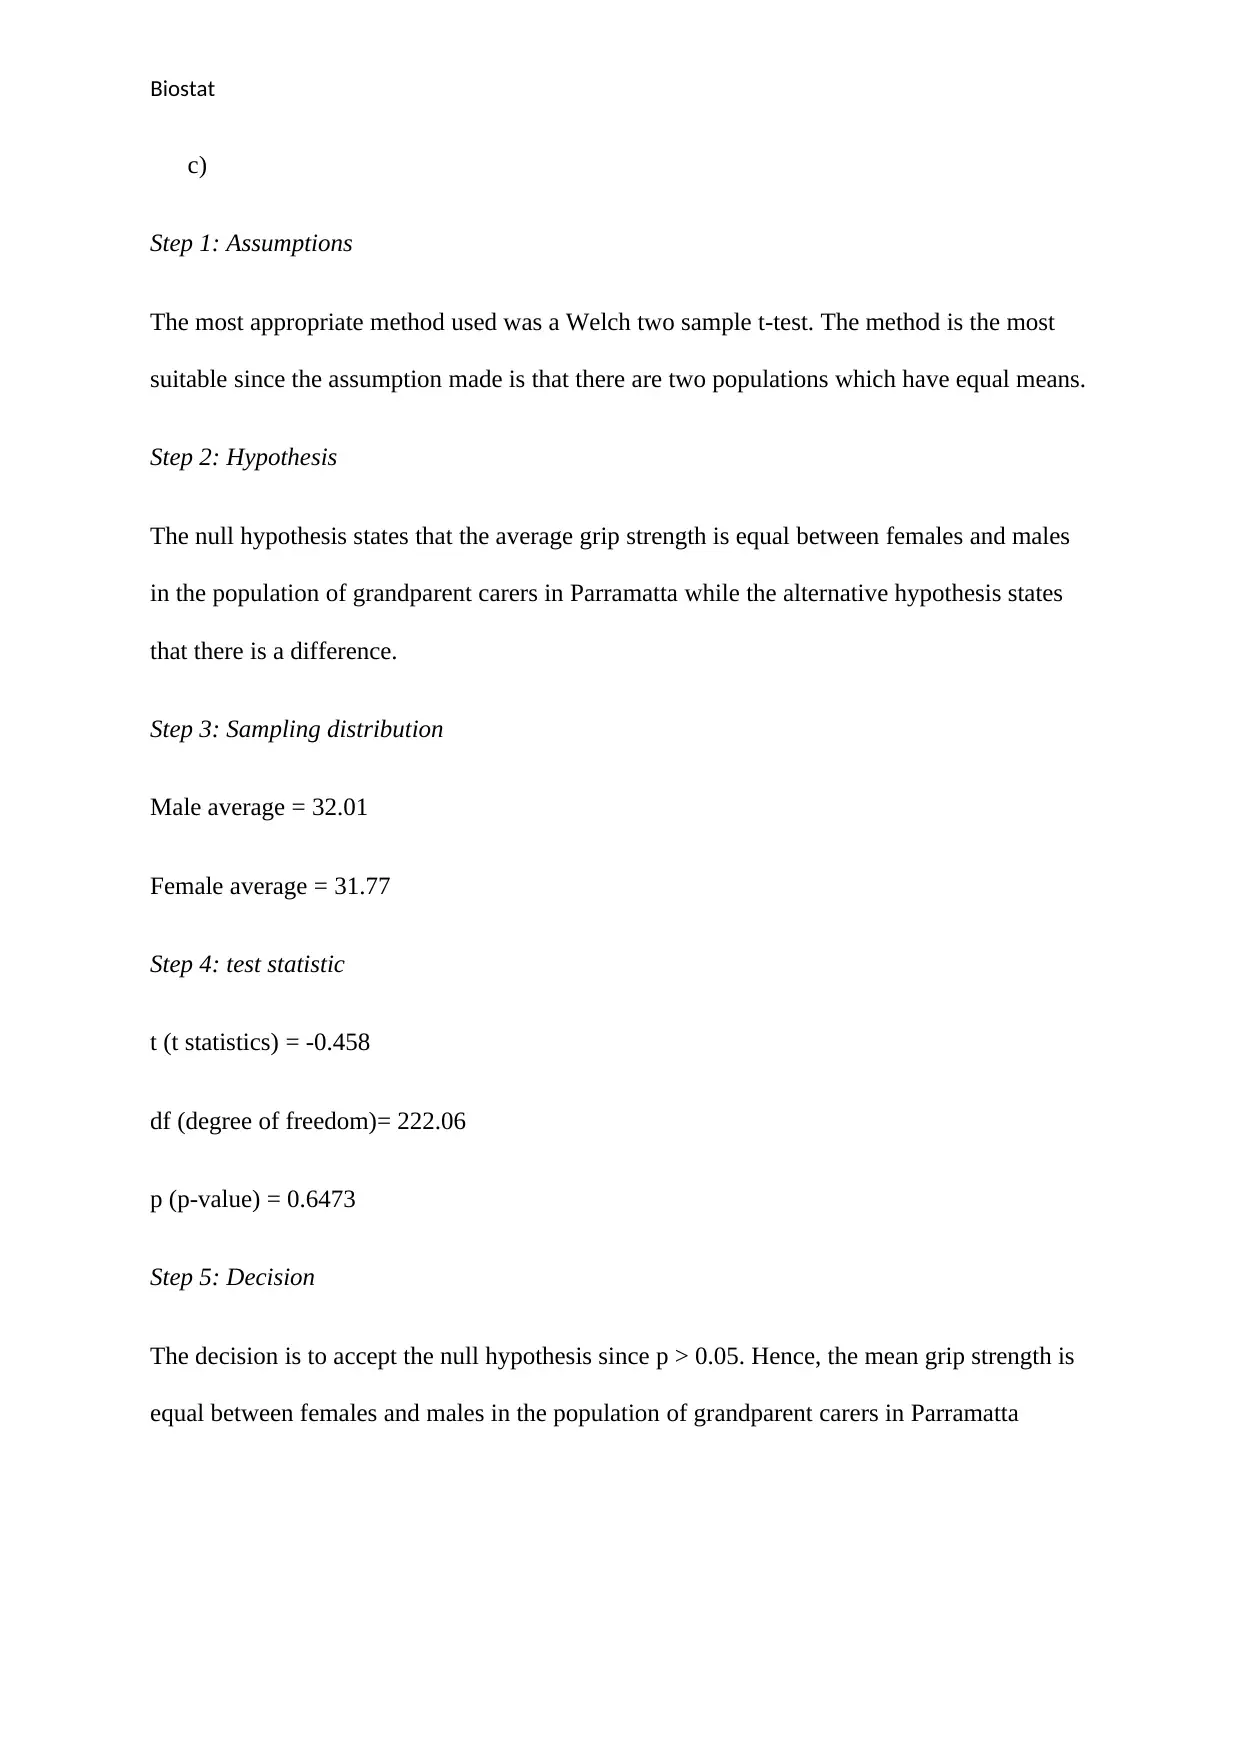
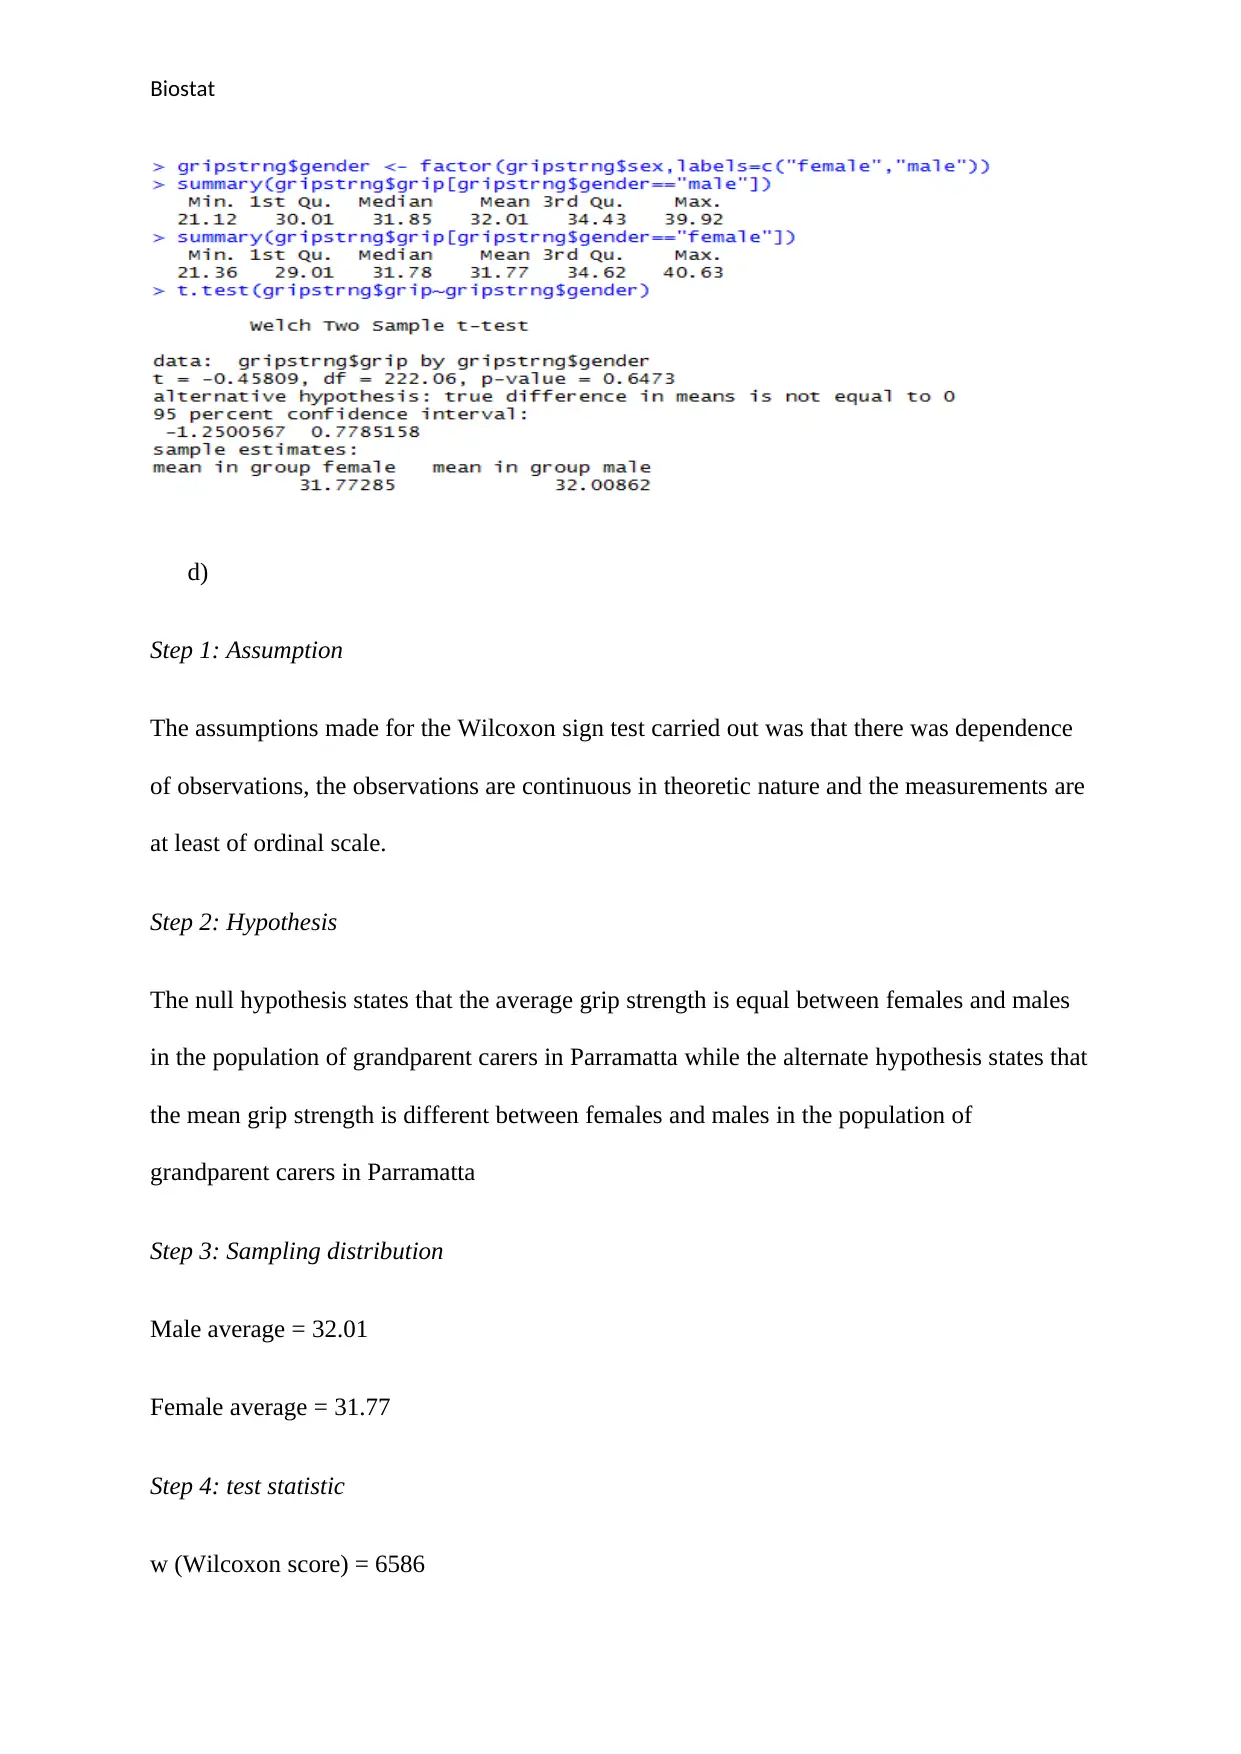
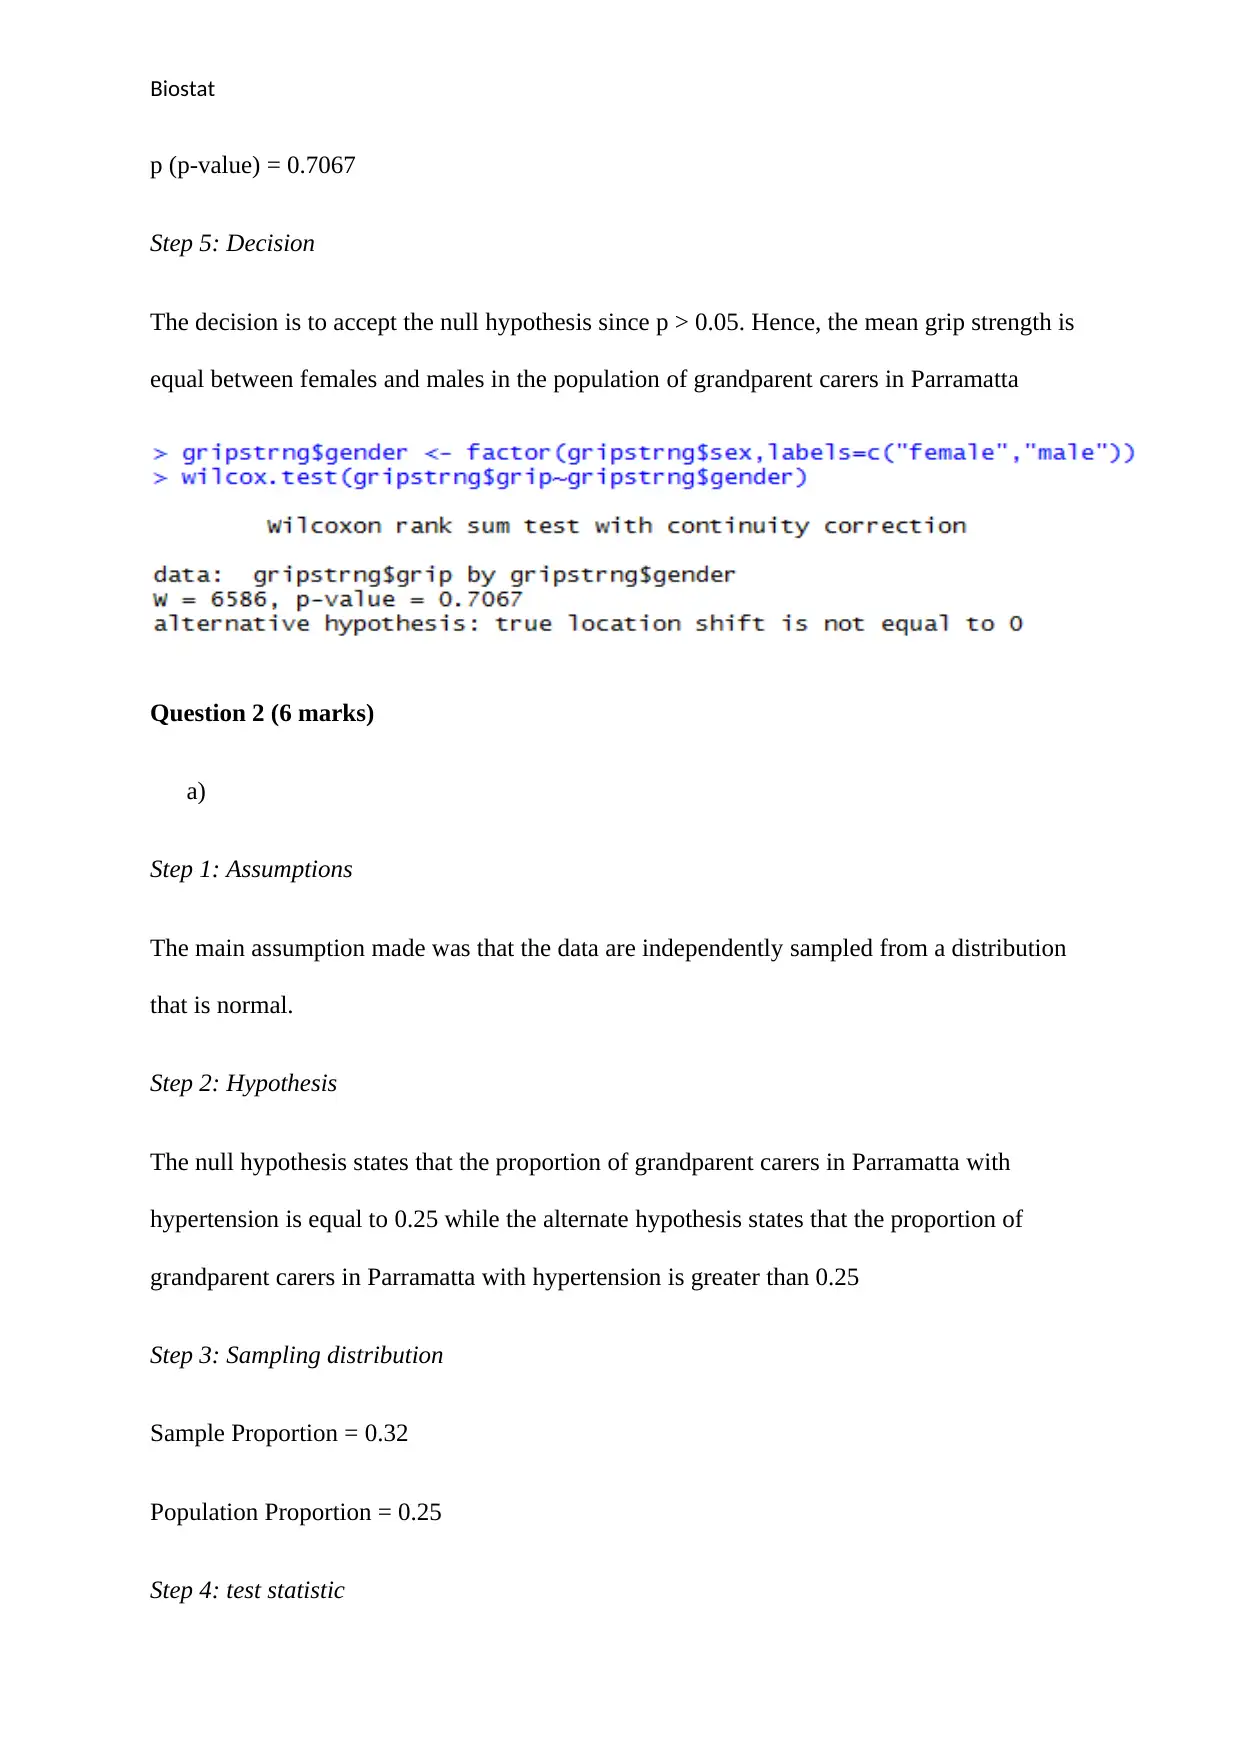
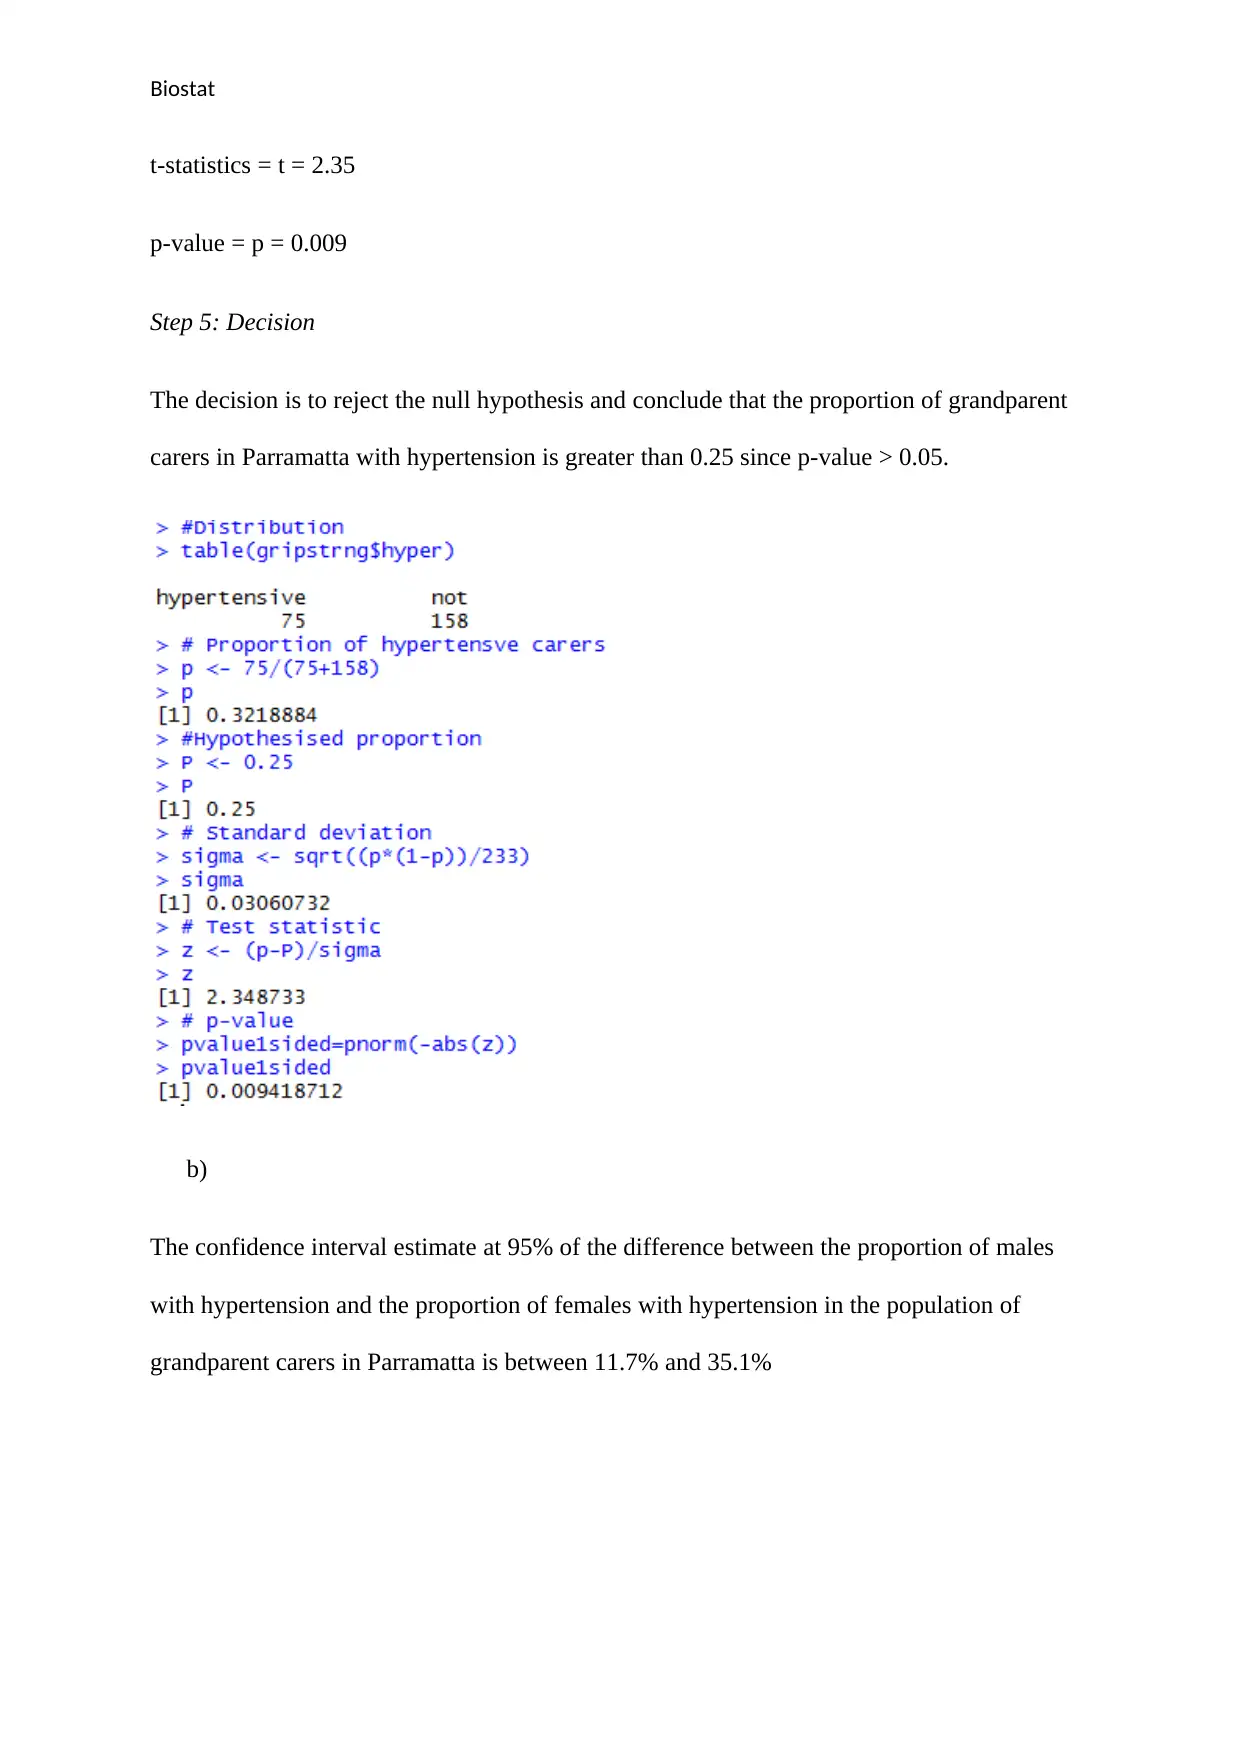
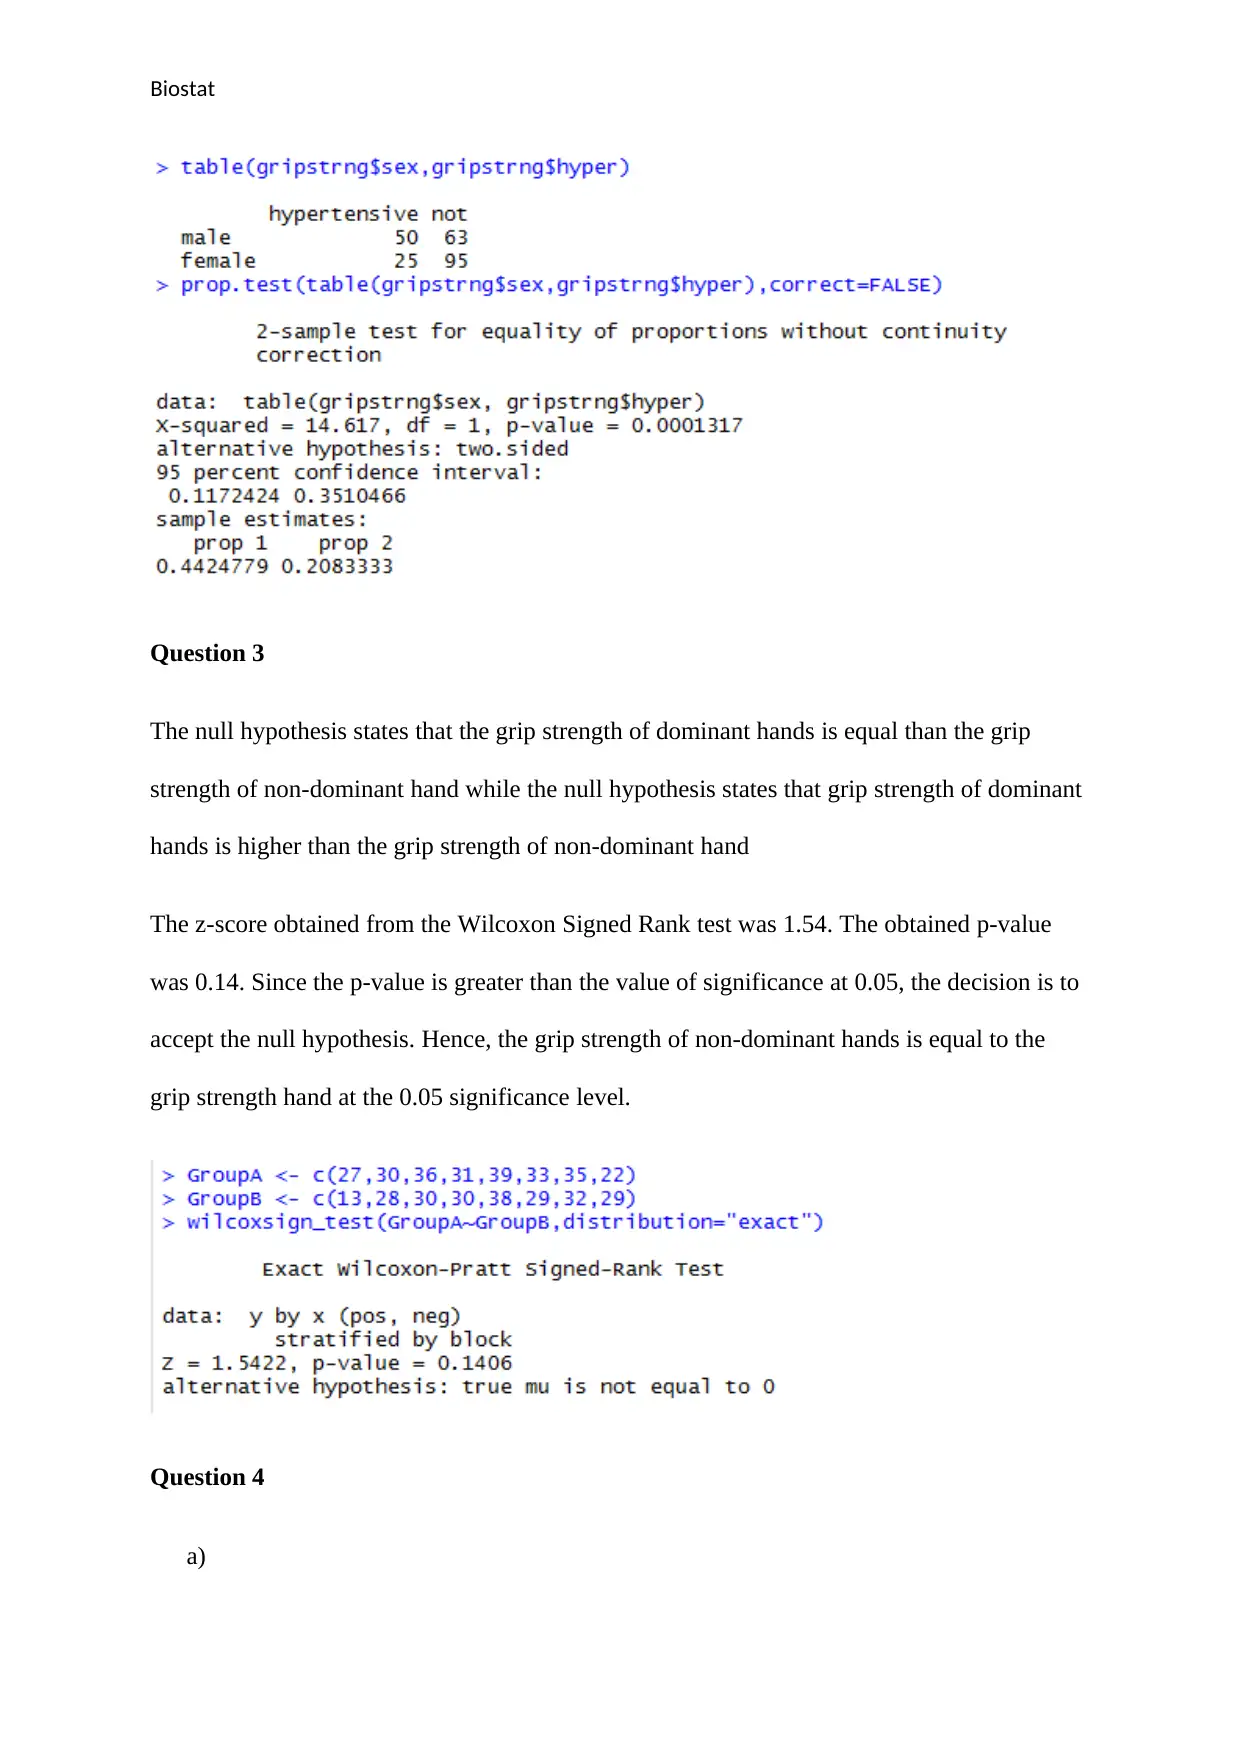
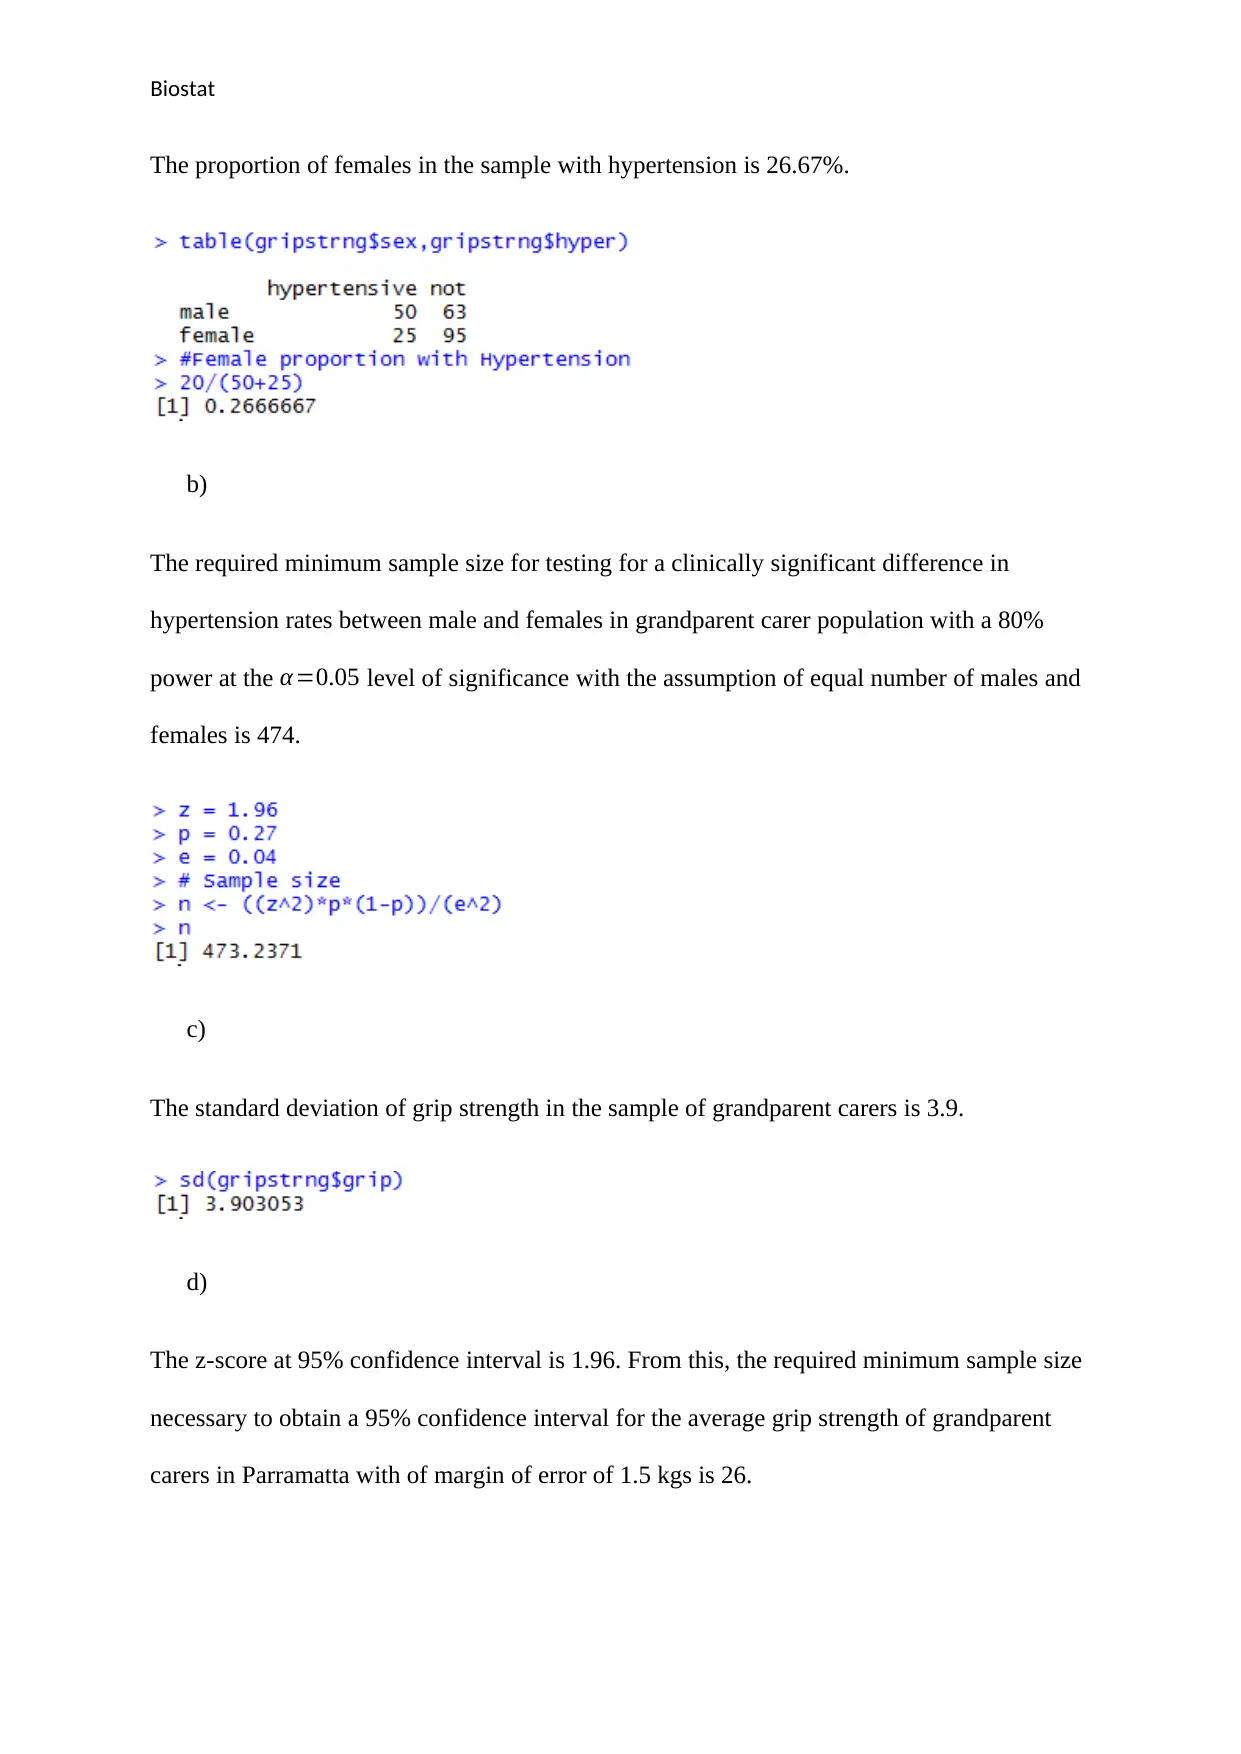
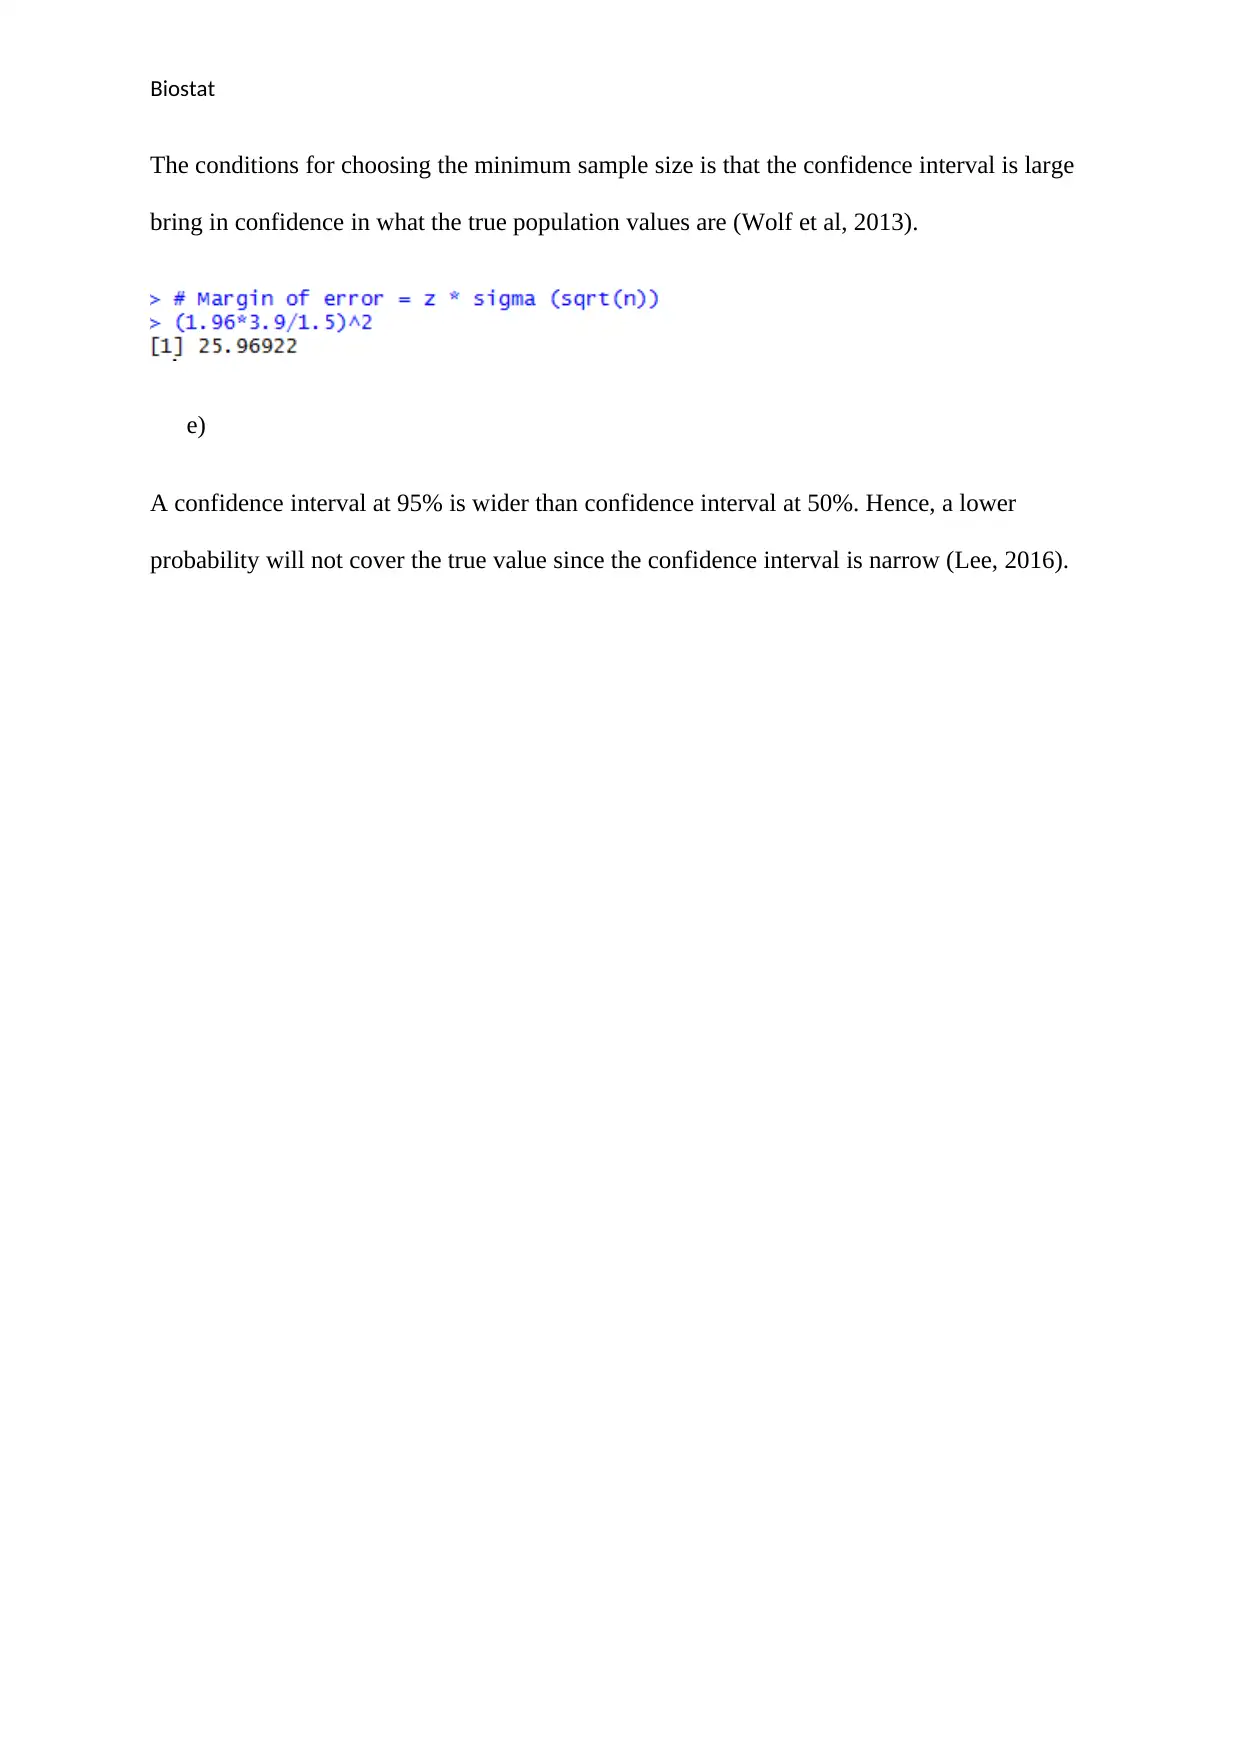
This document presents a comprehensive solution to a biostatistics assignment, focusing on the analysis of grip strength data from a sample of grandparent carers in Parramatta. The assignment covers various statistical concepts, including confidence intervals, hypothesis testing using t-tests and Wilcoxon tests, and sample size calculations. The solution addresses multiple questions, providing detailed explanations of the assumptions, hypotheses, sampling distributions, test statistics, and decisions made in each analysis. The analysis explores the relationship between grip strength and gender, the proportion of grandparent carers with hypertension, and the comparison of grip strength between dominant and non-dominant hands. The document also includes a discussion on the impact of confidence interval width and the selection of an appropriate sample size, along with relevant references to support the findings. The student has used the R Commander output to identify relevant results and write them up in the assignment.
tabler-icon-diamond-filled.svg

Contribute Materials

Your contribution can guide someone’s learning journey. Share your documents today.
Document Page
RUNNING HEADER: BIOSTAT
Biostat
Student’s Name:
Student’s ID:
Institution:
tabler-icon-diamond-filled.svg

Secure Best Marks with AI Grader

Need help grading? Try our AI Grader for instant feedback on your assignments.
Document Page
Biostat
Question 1
a)
The average grip strength has a 95% confidence interval in the population that is between is
31.47 and 32.32. Hence, we are 95% confident that the average grip strength in the
population of grandparent carers in Parramatta is between 31.47 and 32.32.
b)
We choose to not reject the claim that the mean grip strength of grandparent carers in
Parramatta is significantly different from 33kgs at 0.05 significance level. This is because the
test statistics of -4.3 is less than the critical value of -1.6.
Document Page
Biostat
c)
Step 1: Assumptions
The most appropriate method used was a Welch two sample t-test. The method is the most
suitable since the assumption made is that there are two populations which have equal means.
Step 2: Hypothesis
The null hypothesis states that the average grip strength is equal between females and males
in the population of grandparent carers in Parramatta while the alternative hypothesis states
that there is a difference.
Step 3: Sampling distribution
Male average = 32.01
Female average = 31.77
Step 4: test statistic
t (t statistics) = -0.458
df (degree of freedom)= 222.06
p (p-value) = 0.6473
Step 5: Decision
The decision is to accept the null hypothesis since p > 0.05. Hence, the mean grip strength is
equal between females and males in the population of grandparent carers in Parramatta
Document Page
Biostat
d)
Step 1: Assumption
The assumptions made for the Wilcoxon sign test carried out was that there was dependence
of observations, the observations are continuous in theoretic nature and the measurements are
at least of ordinal scale.
Step 2: Hypothesis
The null hypothesis states that the average grip strength is equal between females and males
in the population of grandparent carers in Parramatta while the alternate hypothesis states that
the mean grip strength is different between females and males in the population of
grandparent carers in Parramatta
Step 3: Sampling distribution
Male average = 32.01
Female average = 31.77
Step 4: test statistic
w (Wilcoxon score) = 6586
tabler-icon-diamond-filled.svg

Secure Best Marks with AI Grader

Need help grading? Try our AI Grader for instant feedback on your assignments.
Document Page
Biostat
p (p-value) = 0.7067
Step 5: Decision
The decision is to accept the null hypothesis since p > 0.05. Hence, the mean grip strength is
equal between females and males in the population of grandparent carers in Parramatta
Question 2 (6 marks)
a)
Step 1: Assumptions
The main assumption made was that the data are independently sampled from a distribution
that is normal.
Step 2: Hypothesis
The null hypothesis states that the proportion of grandparent carers in Parramatta with
hypertension is equal to 0.25 while the alternate hypothesis states that the proportion of
grandparent carers in Parramatta with hypertension is greater than 0.25
Step 3: Sampling distribution
Sample Proportion = 0.32
Population Proportion = 0.25
Step 4: test statistic
Document Page
Biostat
t-statistics = t = 2.35
p-value = p = 0.009
Step 5: Decision
The decision is to reject the null hypothesis and conclude that the proportion of grandparent
carers in Parramatta with hypertension is greater than 0.25 since p-value > 0.05.
b)
The confidence interval estimate at 95% of the difference between the proportion of males
with hypertension and the proportion of females with hypertension in the population of
grandparent carers in Parramatta is between 11.7% and 35.1%
Document Page
Biostat
Question 3
The null hypothesis states that the grip strength of dominant hands is equal than the grip
strength of non-dominant hand while the null hypothesis states that grip strength of dominant
hands is higher than the grip strength of non-dominant hand
The z-score obtained from the Wilcoxon Signed Rank test was 1.54. The obtained p-value
was 0.14. Since the p-value is greater than the value of significance at 0.05, the decision is to
accept the null hypothesis. Hence, the grip strength of non-dominant hands is equal to the
grip strength hand at the 0.05 significance level.
Question 4
a)
tabler-icon-diamond-filled.svg

Paraphrase This Document

Need a fresh take? Get an instant paraphrase of this document with our AI Paraphraser
Document Page
Biostat
The proportion of females in the sample with hypertension is 26.67%.
b)
The required minimum sample size for testing for a clinically significant difference in
hypertension rates between male and females in grandparent carer population with a 80%
power at the α=0.05 level of significance with the assumption of equal number of males and
females is 474.
c)
The standard deviation of grip strength in the sample of grandparent carers is 3.9.
d)
The z-score at 95% confidence interval is 1.96. From this, the required minimum sample size
necessary to obtain a 95% confidence interval for the average grip strength of grandparent
carers in Parramatta with of margin of error of 1.5 kgs is 26.
Document Page
Biostat
The conditions for choosing the minimum sample size is that the confidence interval is large
bring in confidence in what the true population values are (Wolf et al, 2013).
e)
A confidence interval at 95% is wider than confidence interval at 50%. Hence, a lower
probability will not cover the true value since the confidence interval is narrow (Lee, 2016).
Document Page
Biostat
Reference
Lee, D. K. (2016). Alternatives to P value: confidence interval and effect size. Korean
journal of anesthesiology, 69(6), 555.
Wolf, E. J., Harrington, K. M., Clark, S. L., & Miller, M. W. (2013). Sample size
requirements for structural equation models: An evaluation of power, bias, and
solution propriety. Educational and psychological measurement, 73(6), 913-934.
chevron_up_icon
1 out of 10
circle_padding
hide_on_mobile
zoom_out_icon
logo.png

Your All-in-One AI-Powered Toolkit for Academic Success.

Available 24*7 on WhatsApp / Email

[object Object]