Biostatistics Assignment: Analysis of Genetic Profiles and Survival
VerifiedAdded on 2022/10/01
|7
|1190
|114
Homework Assignment
AI Summary
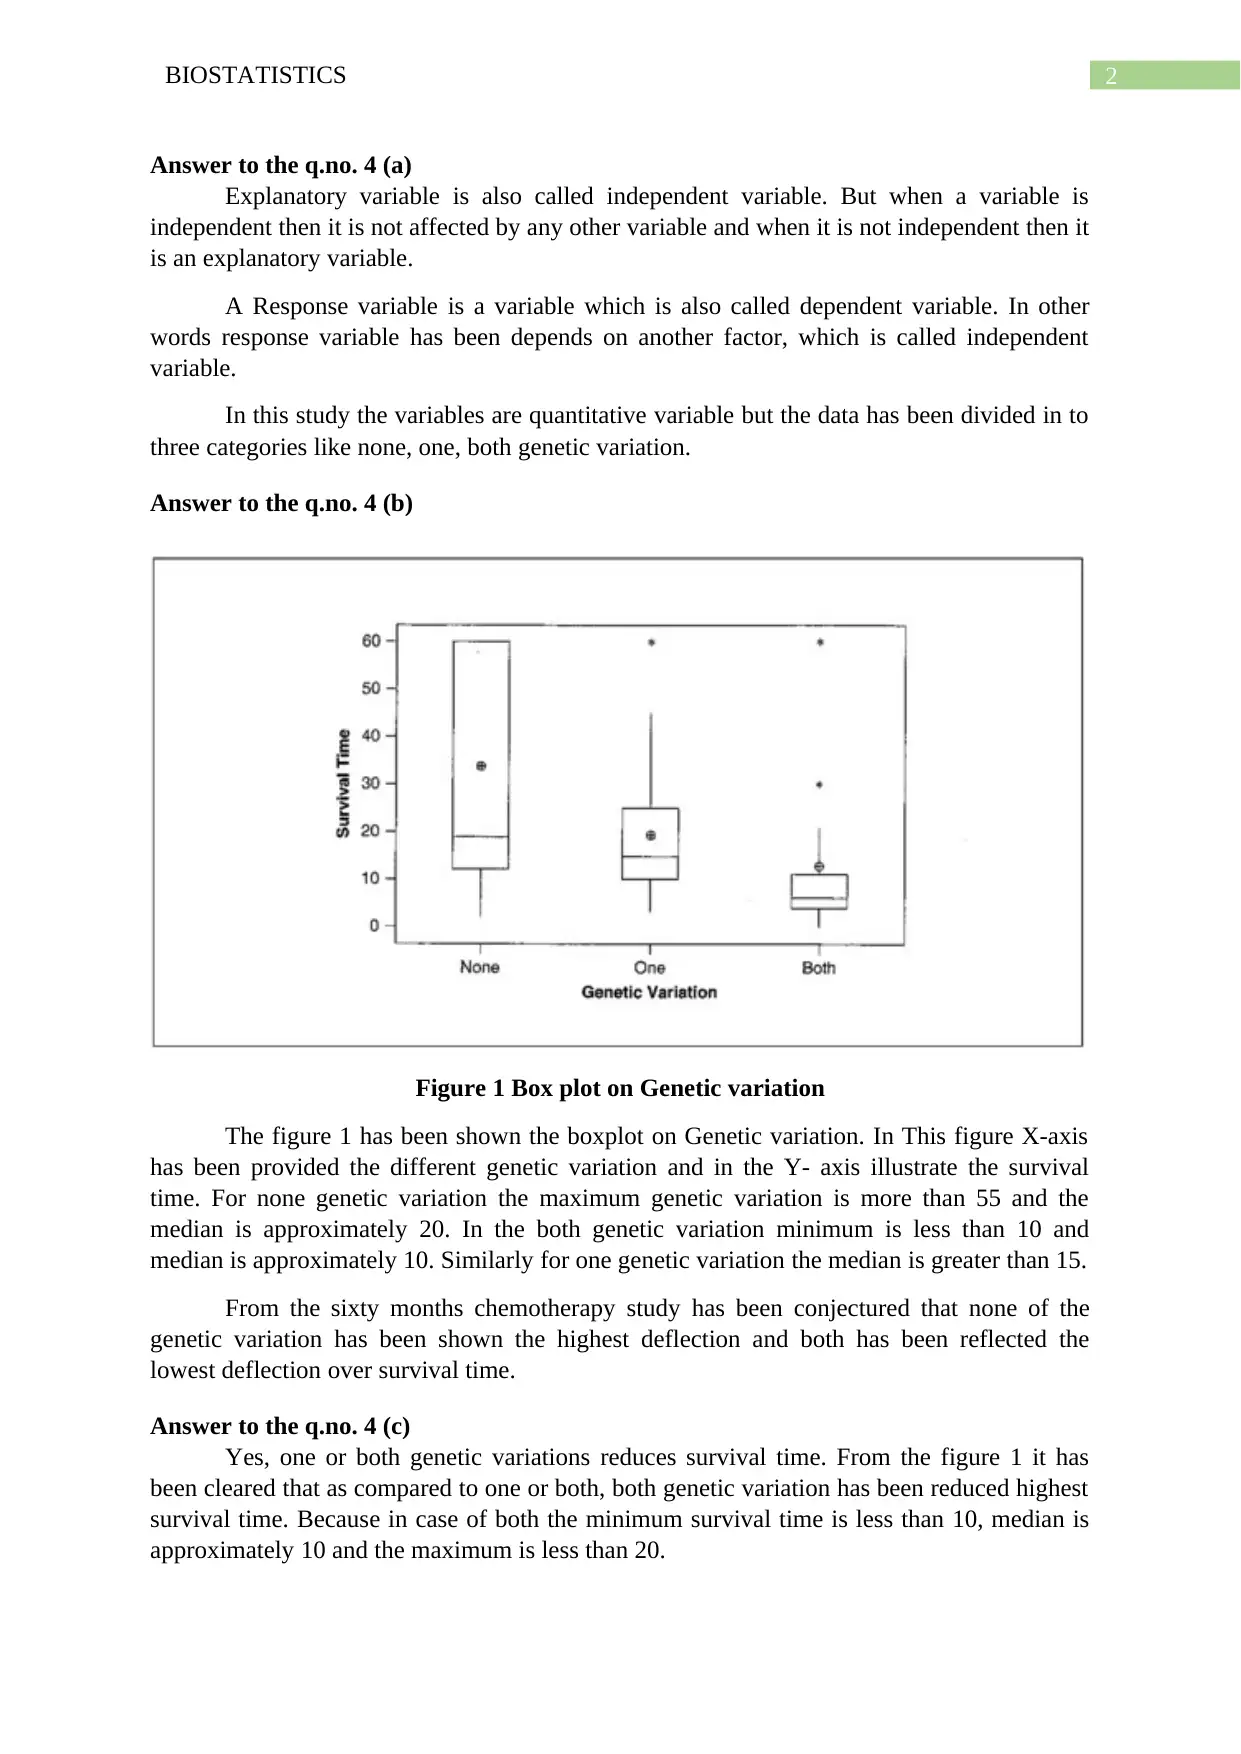
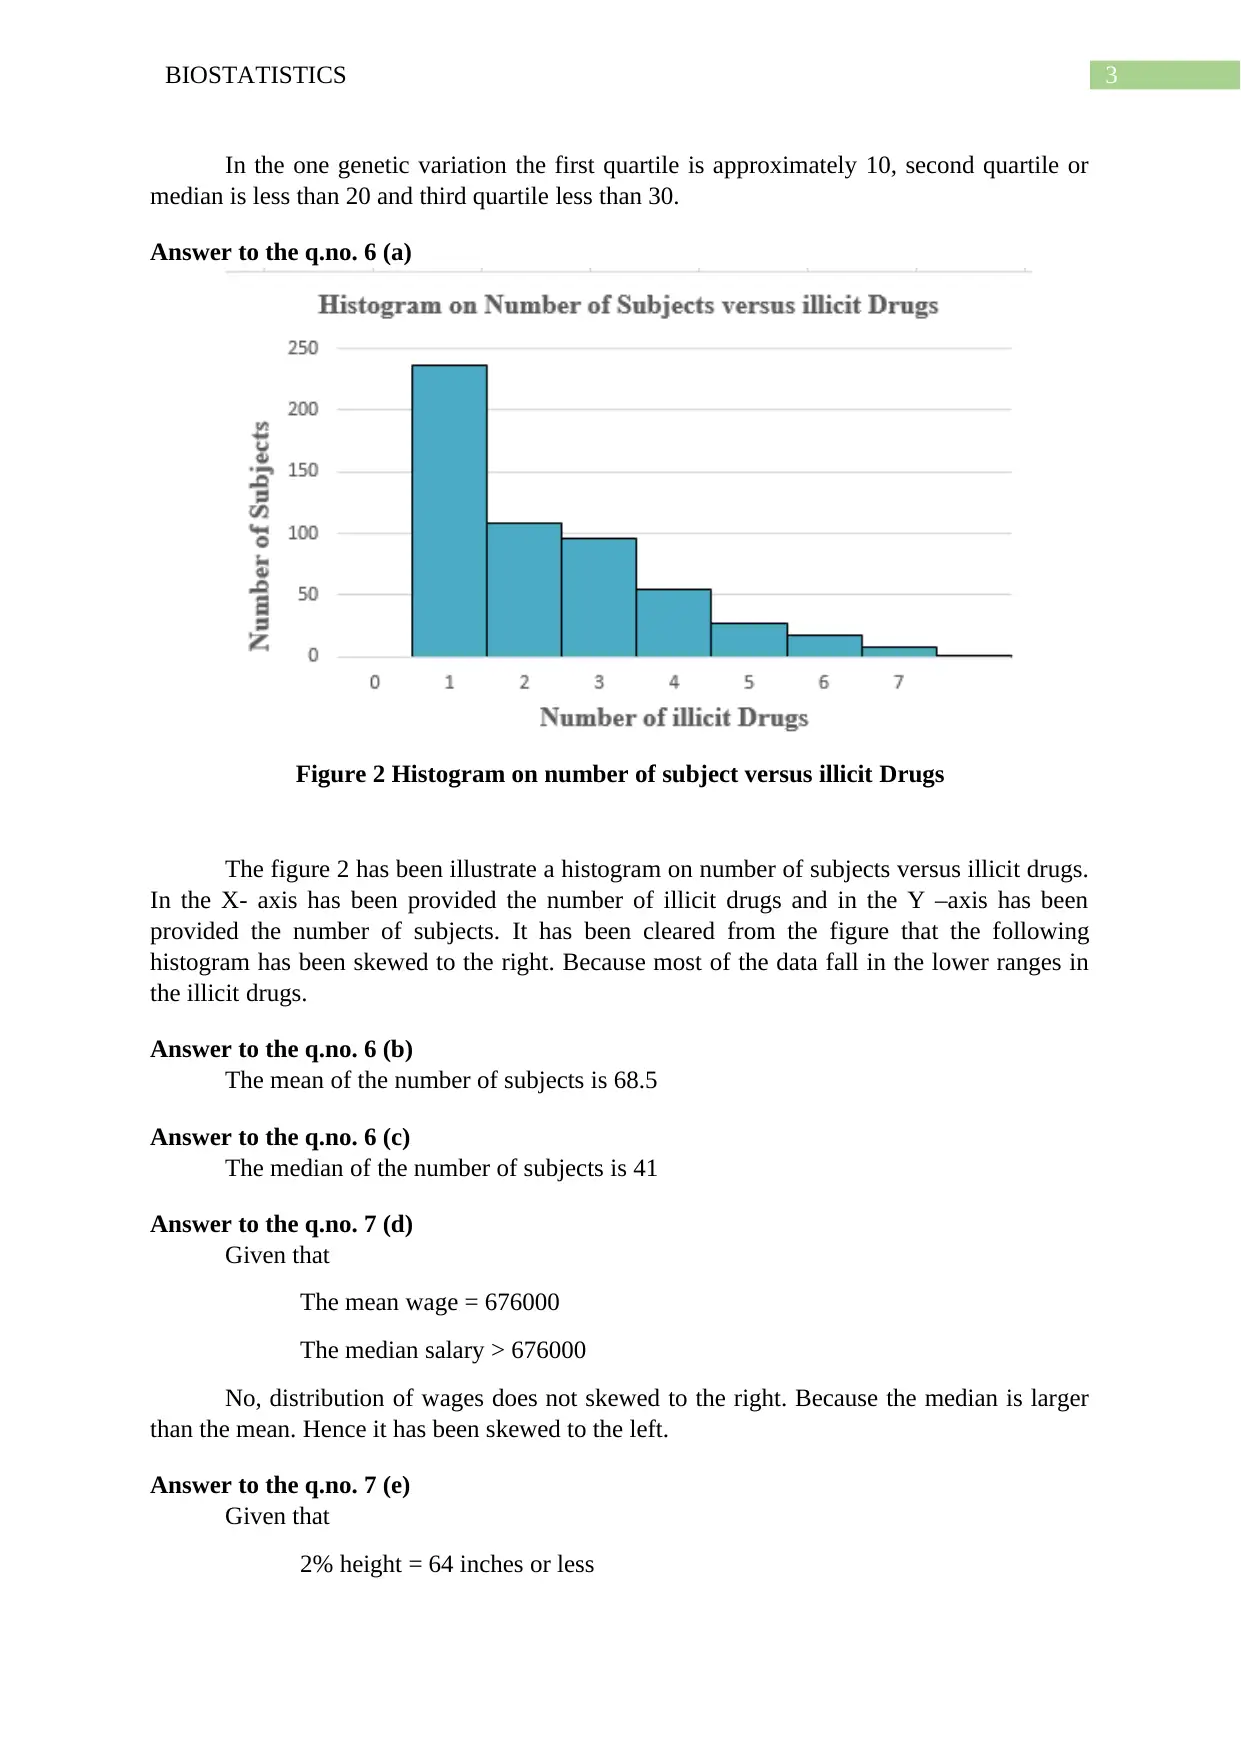
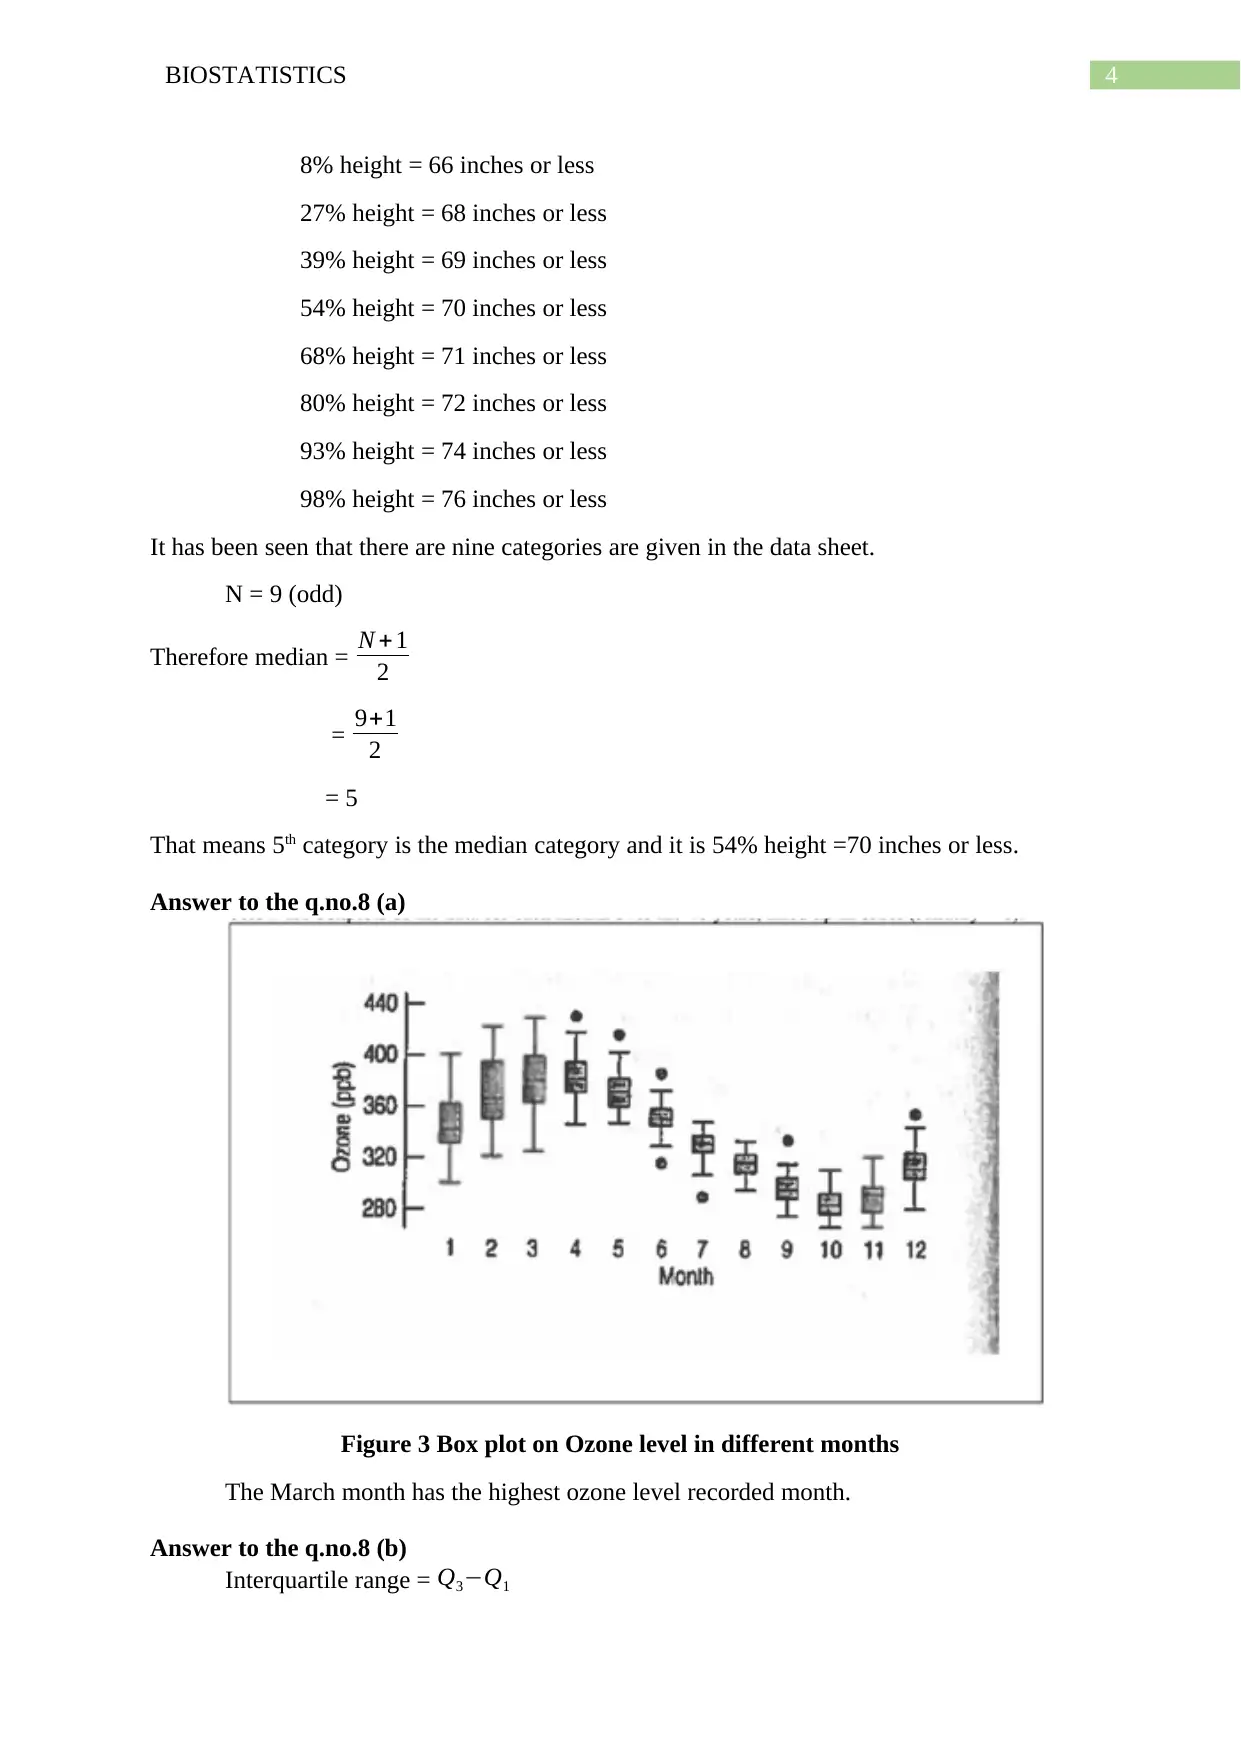
This biostatistics assignment analyzes the relationship between genetic variations and survival time in lung cancer patients. The solution addresses questions related to explanatory and response variables, interprets box plots illustrating survival times across different genetic profiles (none, one, or both variations), and discusses the impact of these variations on patient survival. The assignment includes a histogram analysis of illicit drug use, calculating mean and median values. Furthermore, the solution examines wage distributions and height percentiles, along with ozone level patterns across different months, analyzing interquartile ranges and cyclical patterns. The analysis is comprehensive, incorporating statistical concepts and graphical interpretations to provide a thorough understanding of the data.

Running head: BIOSTATISTICS
Biostatistics
Name of the Student:
Name of the University:
Author note:
Biostatistics
Name of the Student:
Name of the University:
Author note:
Paraphrase This Document
Need a fresh take? Get an instant paraphrase of this document with our AI Paraphraser

1BIOSTATISTICS
Table of Contents
Answer to the q.no. 4 (a)............................................................................................................2
Answer to the q.no. 4 (b)............................................................................................................2
Answer to the q.no. 4 (c)............................................................................................................2
Answer to the q.no. 6 (a)............................................................................................................3
Answer to the q.no. 6 (b)............................................................................................................3
Answer to the q.no. 6 (c)............................................................................................................3
Answer to the q.no. 7 (d)............................................................................................................3
Answer to the q.no. 7 (e)............................................................................................................3
Answer to the q.no.8 (a).............................................................................................................4
Answer to the q.no.8 (b).............................................................................................................4
Answer to the q.no.8 (c).............................................................................................................5
Answer to the q.no.8 (d).............................................................................................................5
Answer to the q.no.8 (e).............................................................................................................5
References..................................................................................................................................6

2BIOSTATISTICS
Answer to the q.no. 4 (a)
Explanatory variable is also called independent variable. But when a variable is
independent then it is not affected by any other variable and when it is not independent then it
is an explanatory variable.
A Response variable is a variable which is also called dependent variable. In other
words response variable has been depends on another factor, which is called independent
variable.
In this study the variables are quantitative variable but the data has been divided in to
three categories like none, one, both genetic variation.
Answer to the q.no. 4 (b)
Figure 1 Box plot on Genetic variation
The figure 1 has been shown the boxplot on Genetic variation. In This figure X-axis
has been provided the different genetic variation and in the Y- axis illustrate the survival
time. For none genetic variation the maximum genetic variation is more than 55 and the
median is approximately 20. In the both genetic variation minimum is less than 10 and
median is approximately 10. Similarly for one genetic variation the median is greater than 15.
From the sixty months chemotherapy study has been conjectured that none of the
genetic variation has been shown the highest deflection and both has been reflected the
lowest deflection over survival time.
Answer to the q.no. 4 (c)
Yes, one or both genetic variations reduces survival time. From the figure 1 it has
been cleared that as compared to one or both, both genetic variation has been reduced highest
survival time. Because in case of both the minimum survival time is less than 10, median is
approximately 10 and the maximum is less than 20.
⊘ This is a preview!⊘
Do you want full access?
Subscribe today to unlock all pages.

Trusted by 1+ million students worldwide

3BIOSTATISTICS
In the one genetic variation the first quartile is approximately 10, second quartile or
median is less than 20 and third quartile less than 30.
Answer to the q.no. 6 (a)
Figure 2 Histogram on number of subject versus illicit Drugs
The figure 2 has been illustrate a histogram on number of subjects versus illicit drugs.
In the X- axis has been provided the number of illicit drugs and in the Y –axis has been
provided the number of subjects. It has been cleared from the figure that the following
histogram has been skewed to the right. Because most of the data fall in the lower ranges in
the illicit drugs.
Answer to the q.no. 6 (b)
The mean of the number of subjects is 68.5
Answer to the q.no. 6 (c)
The median of the number of subjects is 41
Answer to the q.no. 7 (d)
Given that
The mean wage = 676000
The median salary > 676000
No, distribution of wages does not skewed to the right. Because the median is larger
than the mean. Hence it has been skewed to the left.
Answer to the q.no. 7 (e)
Given that
2% height = 64 inches or less
Paraphrase This Document
Need a fresh take? Get an instant paraphrase of this document with our AI Paraphraser

4BIOSTATISTICS
8% height = 66 inches or less
27% height = 68 inches or less
39% height = 69 inches or less
54% height = 70 inches or less
68% height = 71 inches or less
80% height = 72 inches or less
93% height = 74 inches or less
98% height = 76 inches or less
It has been seen that there are nine categories are given in the data sheet.
N = 9 (odd)
Therefore median = N + 1
2
= 9+1
2
= 5
That means 5th category is the median category and it is 54% height =70 inches or less.
Answer to the q.no.8 (a)
Figure 3 Box plot on Ozone level in different months
The March month has the highest ozone level recorded month.
Answer to the q.no.8 (b)
Interquartile range = Q3−Q1

5BIOSTATISTICS
In the month of February has the largest inter quartile range.
Because in the month of February first quartile is approximately = 350
Third quartile is approximately = 400
Answer to the q.no.8 (c)
Range = maximum- minimum
In the August month has been seen the smallest range month.
Because in the month of August maximum value is approximately= 330
Minimum value = 315
Therefore range = 15
Answer to the q.no.8 (d)
In the month of January the first quartile is approximately = 330
Second quartile = 340
Third quartile = 360
Maximum = 300
Minimum = 400
In the month of June the first quartile is approximately = 355
Second quartile = 360
Third quartile = 365
Maximum = 380
Minimum = 350
In the January month interquartile range is high as compared to June month. Similarly
it has been seen that the month of June has the lowest range as compared to January.
Answer to the q.no.8 (e)
The cyclical pattern has been illustrated in the monthly pattern on Ozone level in
different months. It has been seen that in the month of January the range and inter quartile
range is high. But after January it has been slowly decreased.
It has been cleared from the figure 3 that the minimum ozone level from the month of
January to May has been increased. After the month of May that is from the month of June to
November it has been slowly decreased. Again after November it has been increased.
Similarly the maximum ozone level from the month of January to March has been
increased. After the month of March that is from the month of April to October it has been
slowly decreased. Again after October it has been increased.
⊘ This is a preview!⊘
Do you want full access?
Subscribe today to unlock all pages.

Trusted by 1+ million students worldwide

6BIOSTATISTICS
References
Hinton, P.R., 2014. Statistics explained. Routledge.
Ho, A.D. and Yu, C.C., 2015. Descriptive statistics for modern test score distributions:
Skewness, kurtosis, discreteness, and ceiling effects. Educational and Psychological
Measurement, 75(3), pp.365-388.
References
Hinton, P.R., 2014. Statistics explained. Routledge.
Ho, A.D. and Yu, C.C., 2015. Descriptive statistics for modern test score distributions:
Skewness, kurtosis, discreteness, and ceiling effects. Educational and Psychological
Measurement, 75(3), pp.365-388.
1 out of 7

Your All-in-One AI-Powered Toolkit for Academic Success.
+13062052269
info@desklib.com
Available 24*7 on WhatsApp / Email
Unlock your academic potential
Copyright © 2020–2025 A2Z Services. All Rights Reserved. Developed and managed by ZUCOL.