Introduction to Biostatistics Assignment 1 - Autumn 2020
VerifiedAdded on 2022/08/25
|10
|1229
|15
Homework Assignment
AI Summary
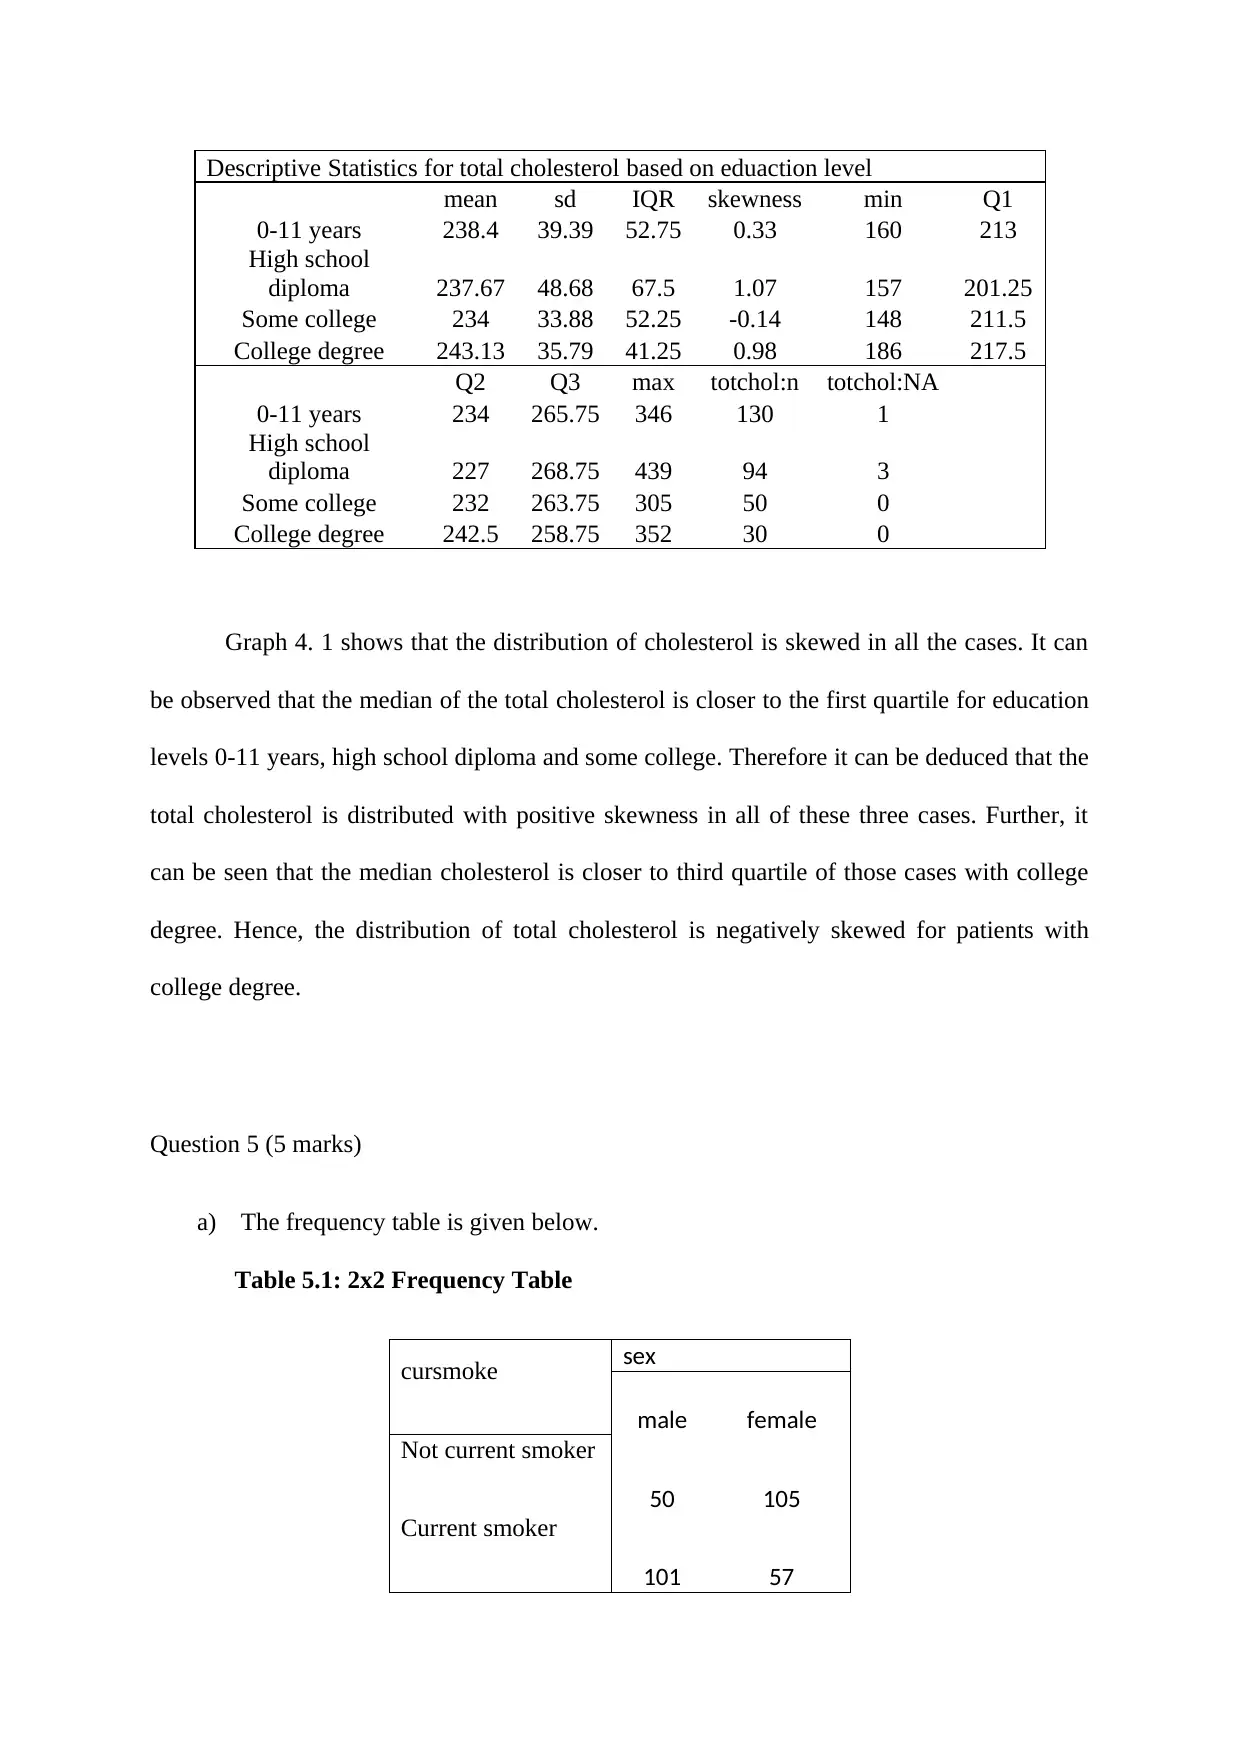
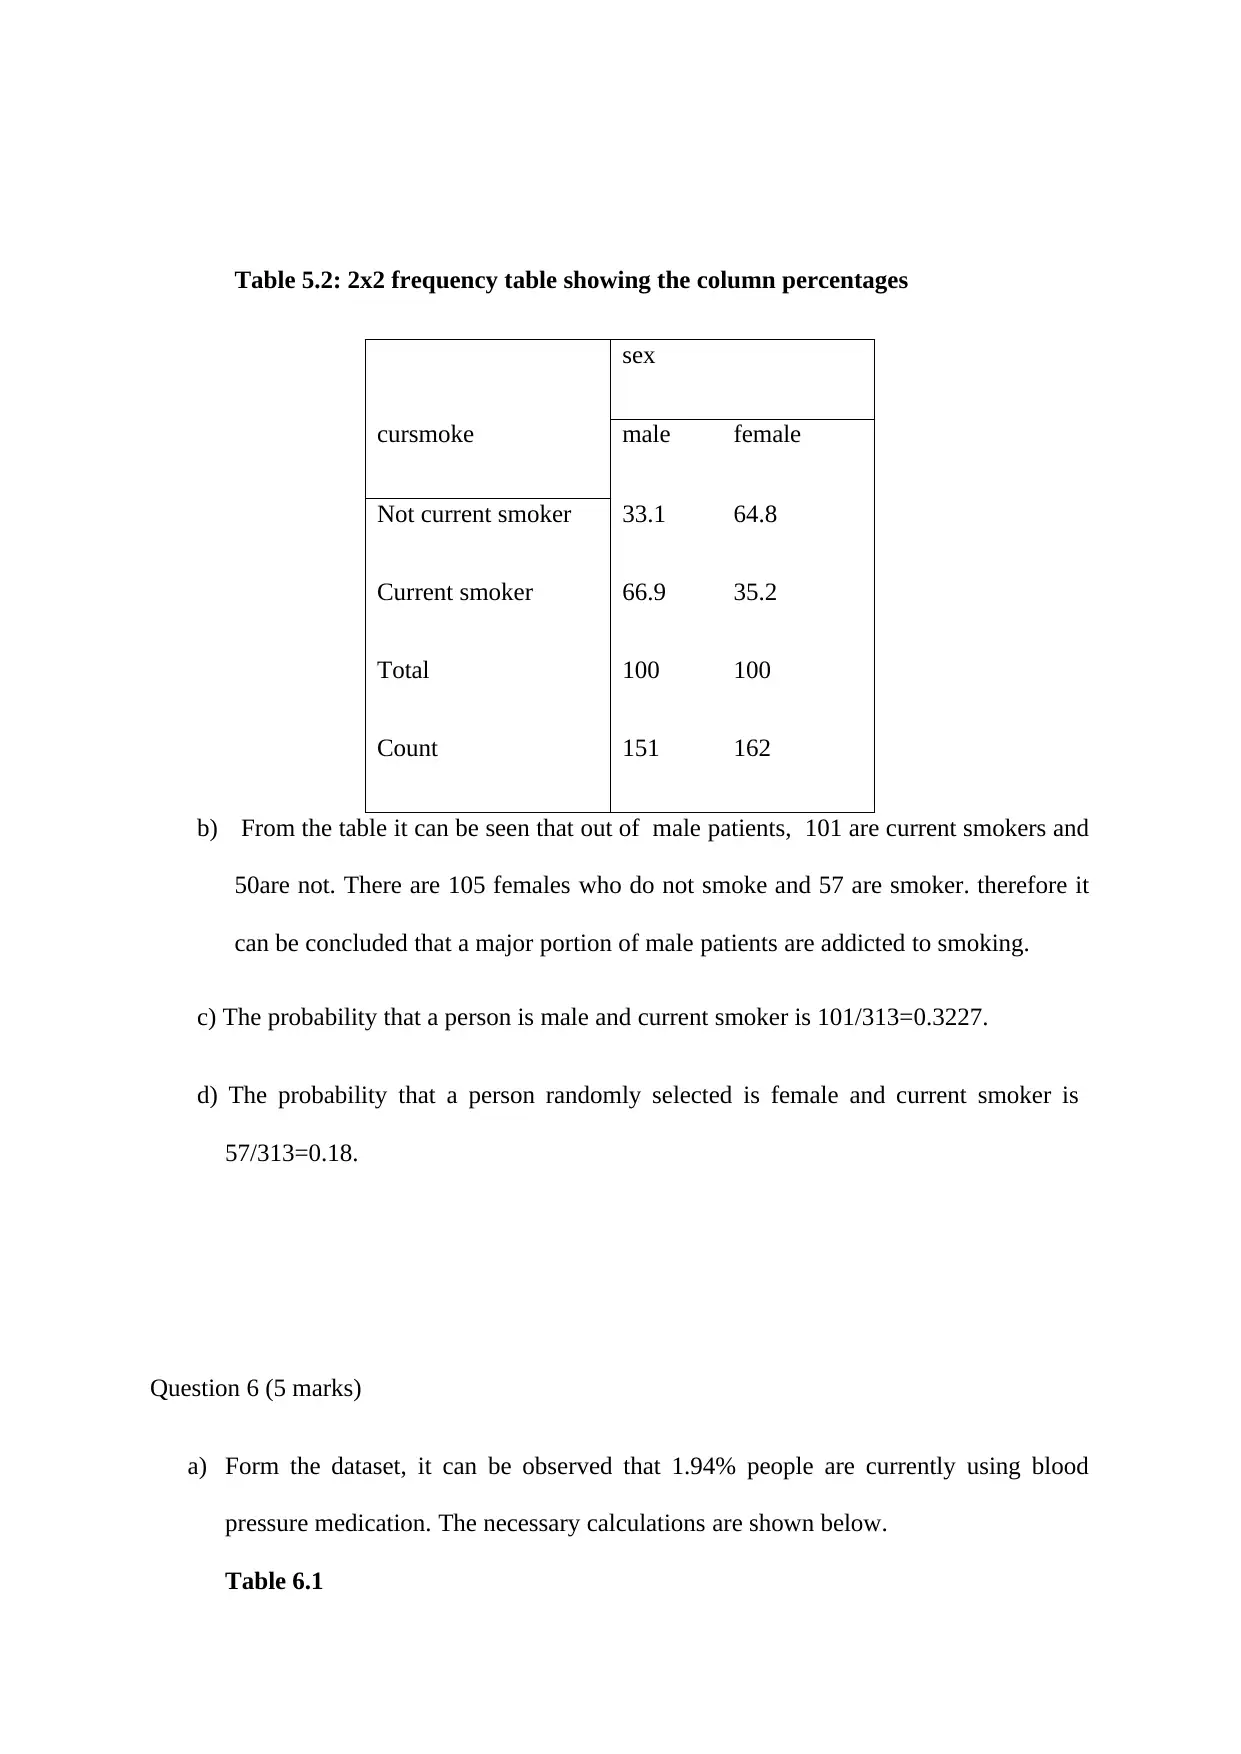
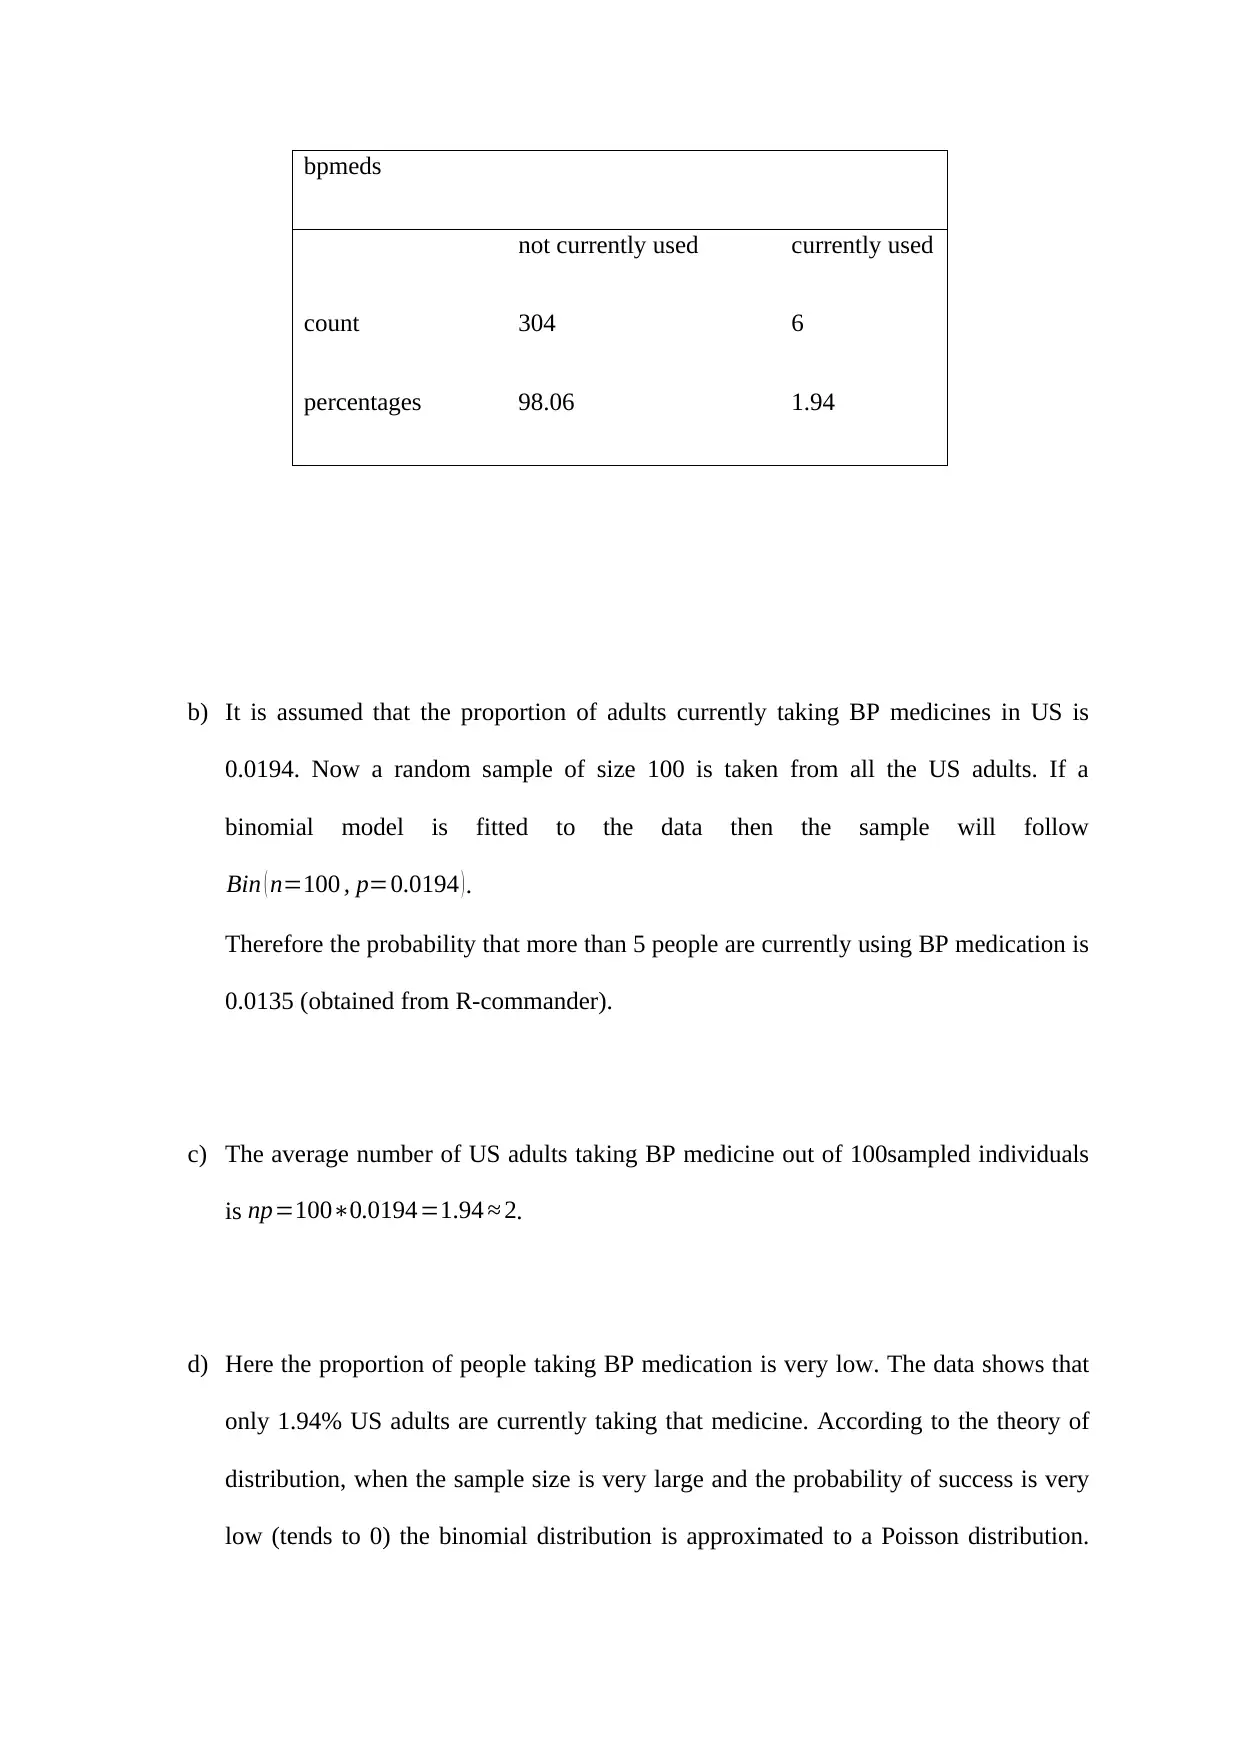
This document presents a comprehensive solution to a biostatistics assignment (Assignment 1, Autumn 2020) for the course 401077, focusing on the analysis of data from the Framingham Study. The assignment includes questions on identifying quantitative variables, analyzing frequency distributions using histograms and boxplots, and interpreting summary statistics like mean, standard deviation, and skewness. It also involves the creation of bar graphs to visualize categorical data, comparing cholesterol distributions across different education levels, constructing and interpreting 2x2 frequency tables, and calculating probabilities. Furthermore, the solution explores the application of binomial and Poisson distributions, along with z-scores and sampling distributions to analyze systolic blood pressure data. The document provides detailed calculations, interpretations, and conclusions based on the provided dataset, covering various statistical concepts and their practical application.

1 out of 10
Related Documents


Your All-in-One AI-Powered Toolkit for Academic Success.
+13062052269
info@desklib.com
Available 24*7 on WhatsApp / Email
![[object Object]](/_next/static/media/star-bottom.7253800d.svg)
Copyright © 2020–2026 A2Z Services. All Rights Reserved. Developed and managed by ZUCOL.