University Biostatistics Assignment: PHE5IST Course, Analysis Report
VerifiedAdded on 2021/04/17
|7
|888
|148
Homework Assignment
AI Summary
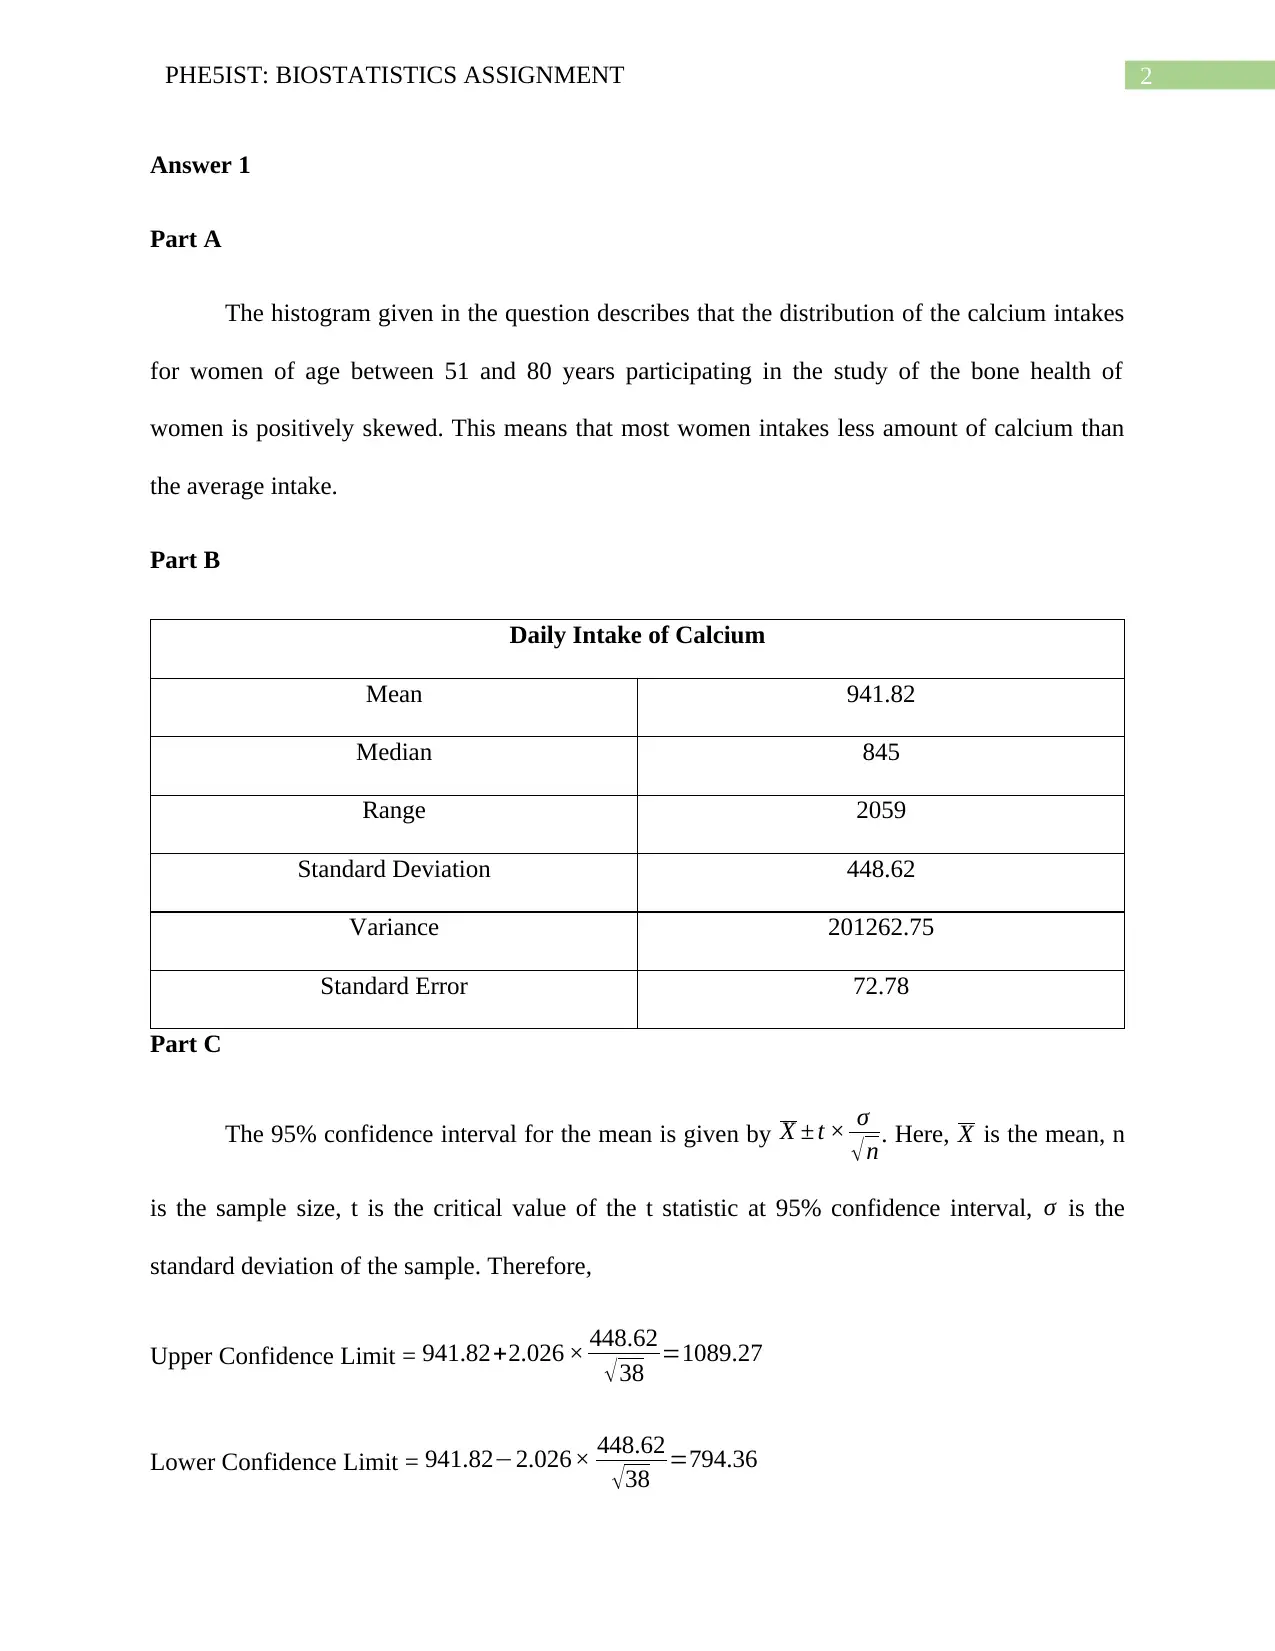
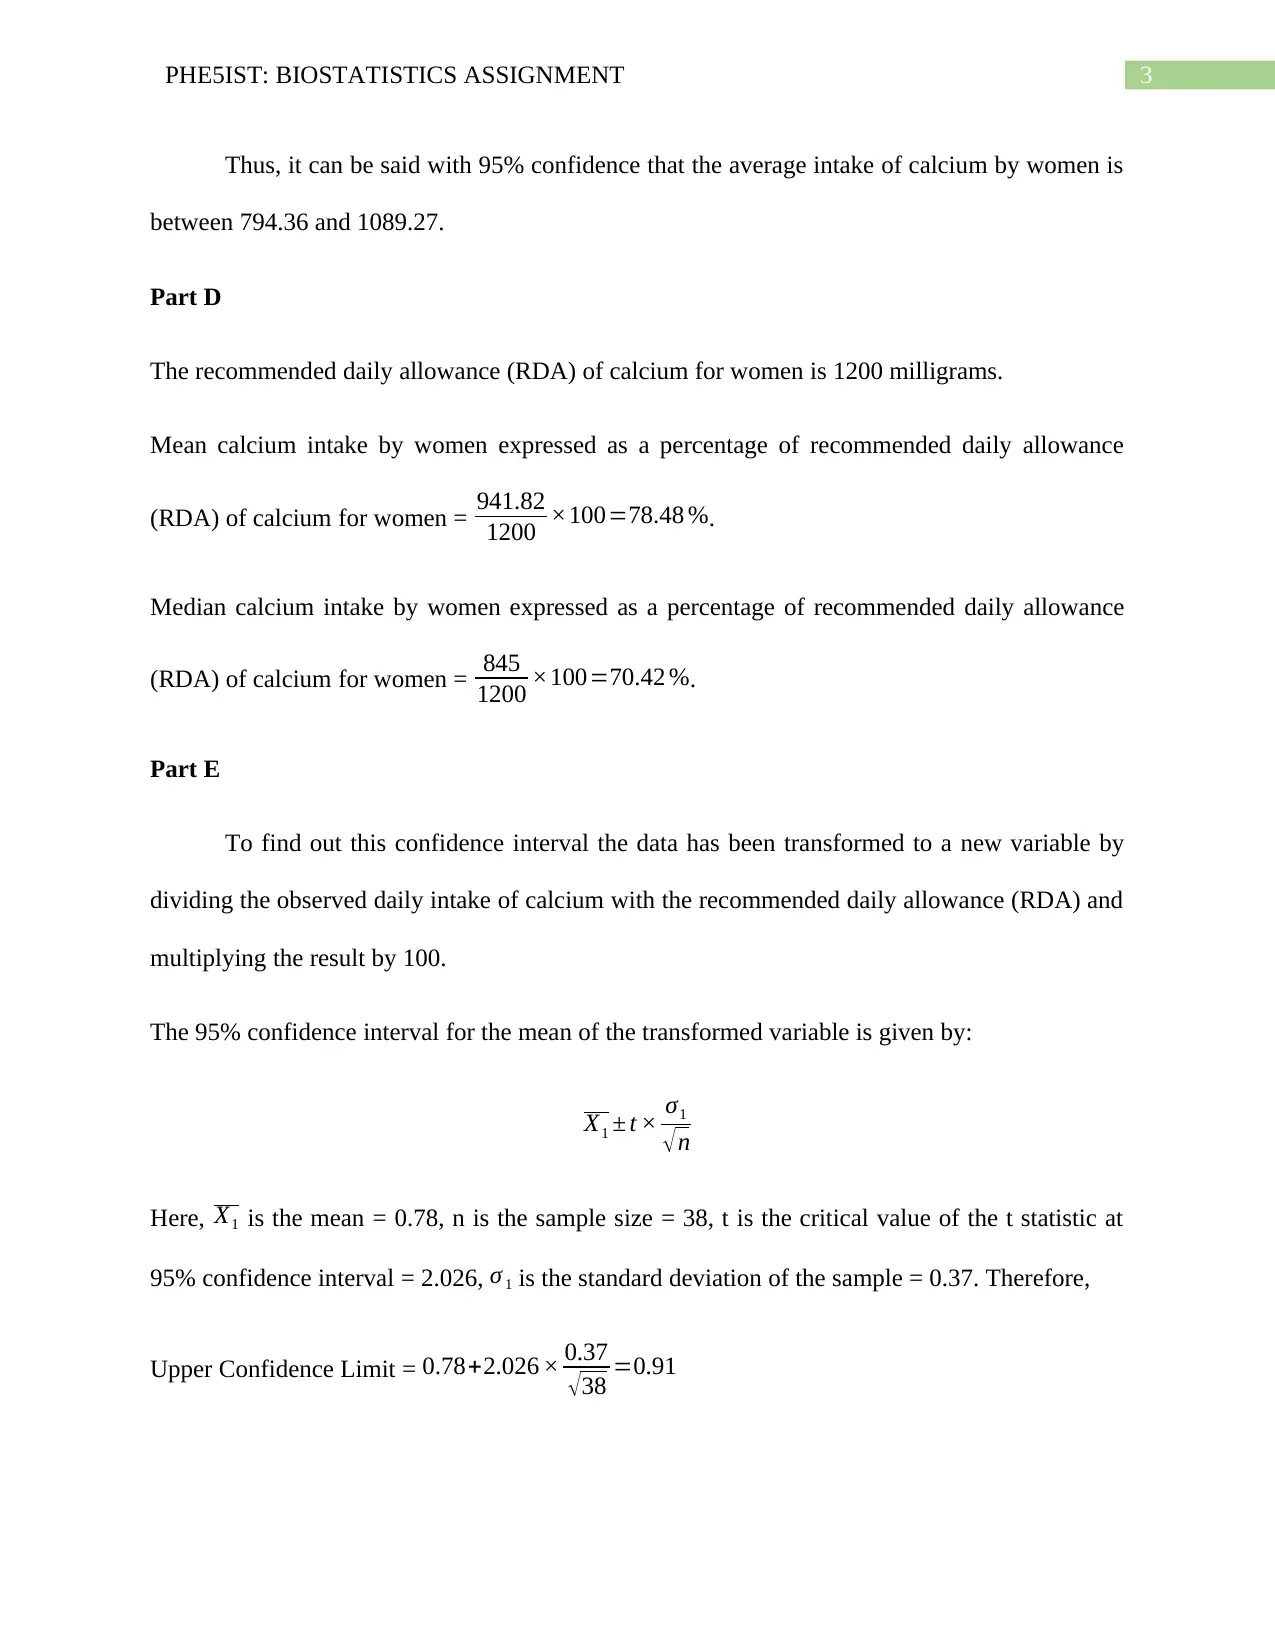
This assignment solution addresses a biostatistics problem, analyzing data related to calcium intake in women and sodium concentration in patients with Everley’s syndrome. The first part of the assignment examines the distribution of calcium intake, calculates descriptive statistics, and determines...

Running Head: PHE5IST: BIOSTATISTICS ASSIGNMENT
PHE5IST: Biostatistics Assignment
Name of the Student
Name of the University
Author Note
PHE5IST: Biostatistics Assignment
Name of the Student
Name of the University
Author Note
Paraphrase This Document
Need a fresh take? Get an instant paraphrase of this document with our AI Paraphraser

1PHE5IST: BIOSTATISTICS ASSIGNMENT
Table of Contents
Answer 1..........................................................................................................................................2
Part A...........................................................................................................................................2
Part B...........................................................................................................................................2
Part C...........................................................................................................................................2
Part D...........................................................................................................................................3
Part E...........................................................................................................................................3
Part F............................................................................................................................................4
Answer 2..........................................................................................................................................4
Part A...........................................................................................................................................4
Part B...........................................................................................................................................4
Part C...........................................................................................................................................5

2PHE5IST: BIOSTATISTICS ASSIGNMENT
Answer 1
Part A
The histogram given in the question describes that the distribution of the calcium intakes
for women of age between 51 and 80 years participating in the study of the bone health of
women is positively skewed. This means that most women intakes less amount of calcium than
the average intake.
Part B
Daily Intake of Calcium
Mean 941.82
Median 845
Range 2059
Standard Deviation 448.62
Variance 201262.75
Standard Error 72.78
Part C
The 95% confidence interval for the mean is given by X ± t × σ
√n . Here, X is the mean, n
is the sample size, t is the critical value of the t statistic at 95% confidence interval, σ is the
standard deviation of the sample. Therefore,
Upper Confidence Limit = 941.82+2.026 × 448.62
√38 =1089.27
Lower Confidence Limit = 941.82−2.026× 448.62
√38 =794.36
⊘ This is a preview!⊘
Do you want full access?
Subscribe today to unlock all pages.

Trusted by 1+ million students worldwide

3PHE5IST: BIOSTATISTICS ASSIGNMENT
Thus, it can be said with 95% confidence that the average intake of calcium by women is
between 794.36 and 1089.27.
Part D
The recommended daily allowance (RDA) of calcium for women is 1200 milligrams.
Mean calcium intake by women expressed as a percentage of recommended daily allowance
(RDA) of calcium for women = 941.82
1200 ×100=78.48 %.
Median calcium intake by women expressed as a percentage of recommended daily allowance
(RDA) of calcium for women = 845
1200 ×100=70.42 %.
Part E
To find out this confidence interval the data has been transformed to a new variable by
dividing the observed daily intake of calcium with the recommended daily allowance (RDA) and
multiplying the result by 100.
The 95% confidence interval for the mean of the transformed variable is given by:
X1 ± t × σ1
√ n
Here, X1 is the mean = 0.78, n is the sample size = 38, t is the critical value of the t statistic at
95% confidence interval = 2.026, σ 1 is the standard deviation of the sample = 0.37. Therefore,
Upper Confidence Limit = 0.78+2.026 × 0.37
√ 38 =0.91
Paraphrase This Document
Need a fresh take? Get an instant paraphrase of this document with our AI Paraphraser

4PHE5IST: BIOSTATISTICS ASSIGNMENT
Lower Confidence Limit = 0.78−2.026 × 0.37
√38 =0.66
Part F
Now, the transformed variables were formed by dividing the calcium intakes of the
women with the recommended daily allowance, i.e., by 1200. Now by multiplying the obtained
confidence intervals by 1200, the upper confidence limit is obtained as 1092 and the lower
confidence limit is obtained as 792. These limits equal the confidence limits obtained in part c.
Answer 2
Part A
The 95% confidence interval for the mean is given by X ± t × σ
√n . Here, X is the mean =
110.9, n is the sample size = 20, degrees of freedom = 19, t is the critical value of the t statistic at
95% confidence interval = 20.093 for 19 degrees of freedom, σ is the standard deviation of the
sample = 15.73. Therefore,
Upper Confidence Limit = 110.9+2.093 × 15.73
√20 =118.26
Lower Confidence Limit = 110.9−2.093× 15.73
√20 =103.54
Thus, it can be said with 95% confidence that the sodium concentration in blood by
women lies between 118.26 and 103.54.
Part B

5PHE5IST: BIOSTATISTICS ASSIGNMENT
To test if there is any significant difference between the sodium concentration in blood of
the selected 20 participants suffering from Everley’s syndrome, before and after the experimental
treatment program, a paired t-test has been conducted. The null and the alternate hypothesis are
given as:
Null Hypothesis (H0): Increase in the blood sodium levels have not been observed in the
participants with Everley’s syndrome after the treatment programme.
Alternate Hypothesis (HA): Significant increase in the blood sodium levels have been observed
in the participants with Everley’s syndrome after the treatment programme.
Let d be the differences in the sodium levels before and after the treatment. Then,
The mean of the sample differences (d) = – 6.3
The standard deviation of the sample differences (σ ) = 12.99
Degrees of freedom = n – 1 = 19.
Tabulated value of t for one-tailed test with 19 degrees of freedom = 1.73.
The test statistic for the paired t test is given by
tobserved= d
σ
√ n
= −6.3
12.99
√ 20
=−2.169
It can be seen from the test that the observed value of the t statistic is less than the
tabulated value of t. Thus, the null hypothesis is rejected. Therefore, there has been significant
increase in the sodium concentration of blood in the participants with Everley’s syndrome after
the treatment programme.
⊘ This is a preview!⊘
Do you want full access?
Subscribe today to unlock all pages.

Trusted by 1+ million students worldwide

6PHE5IST: BIOSTATISTICS ASSIGNMENT
Part C
It has been seen from the analysis conducted previously that there is significant rise in the
sodium levels in the blood of the people suffering from the Everley’s syndrome after they have
taken the treatment programme. The Syndrome is known to decrease the sodium concentration in
the blood. This treatment has been effective in increasing the blood sodium level and thus can be
recommended to all patients with Everley’s syndrome.
1 out of 7
Related Documents

Your All-in-One AI-Powered Toolkit for Academic Success.
+13062052269
info@desklib.com
Available 24*7 on WhatsApp / Email
Unlock your academic potential
© 2024 | Zucol Services PVT LTD | All rights reserved.