Biostatistics Assignment 2: Inference on Mussel Farm Data
VerifiedAdded on 2022/10/10
|5
|1422
|373
Homework Assignment
AI Summary
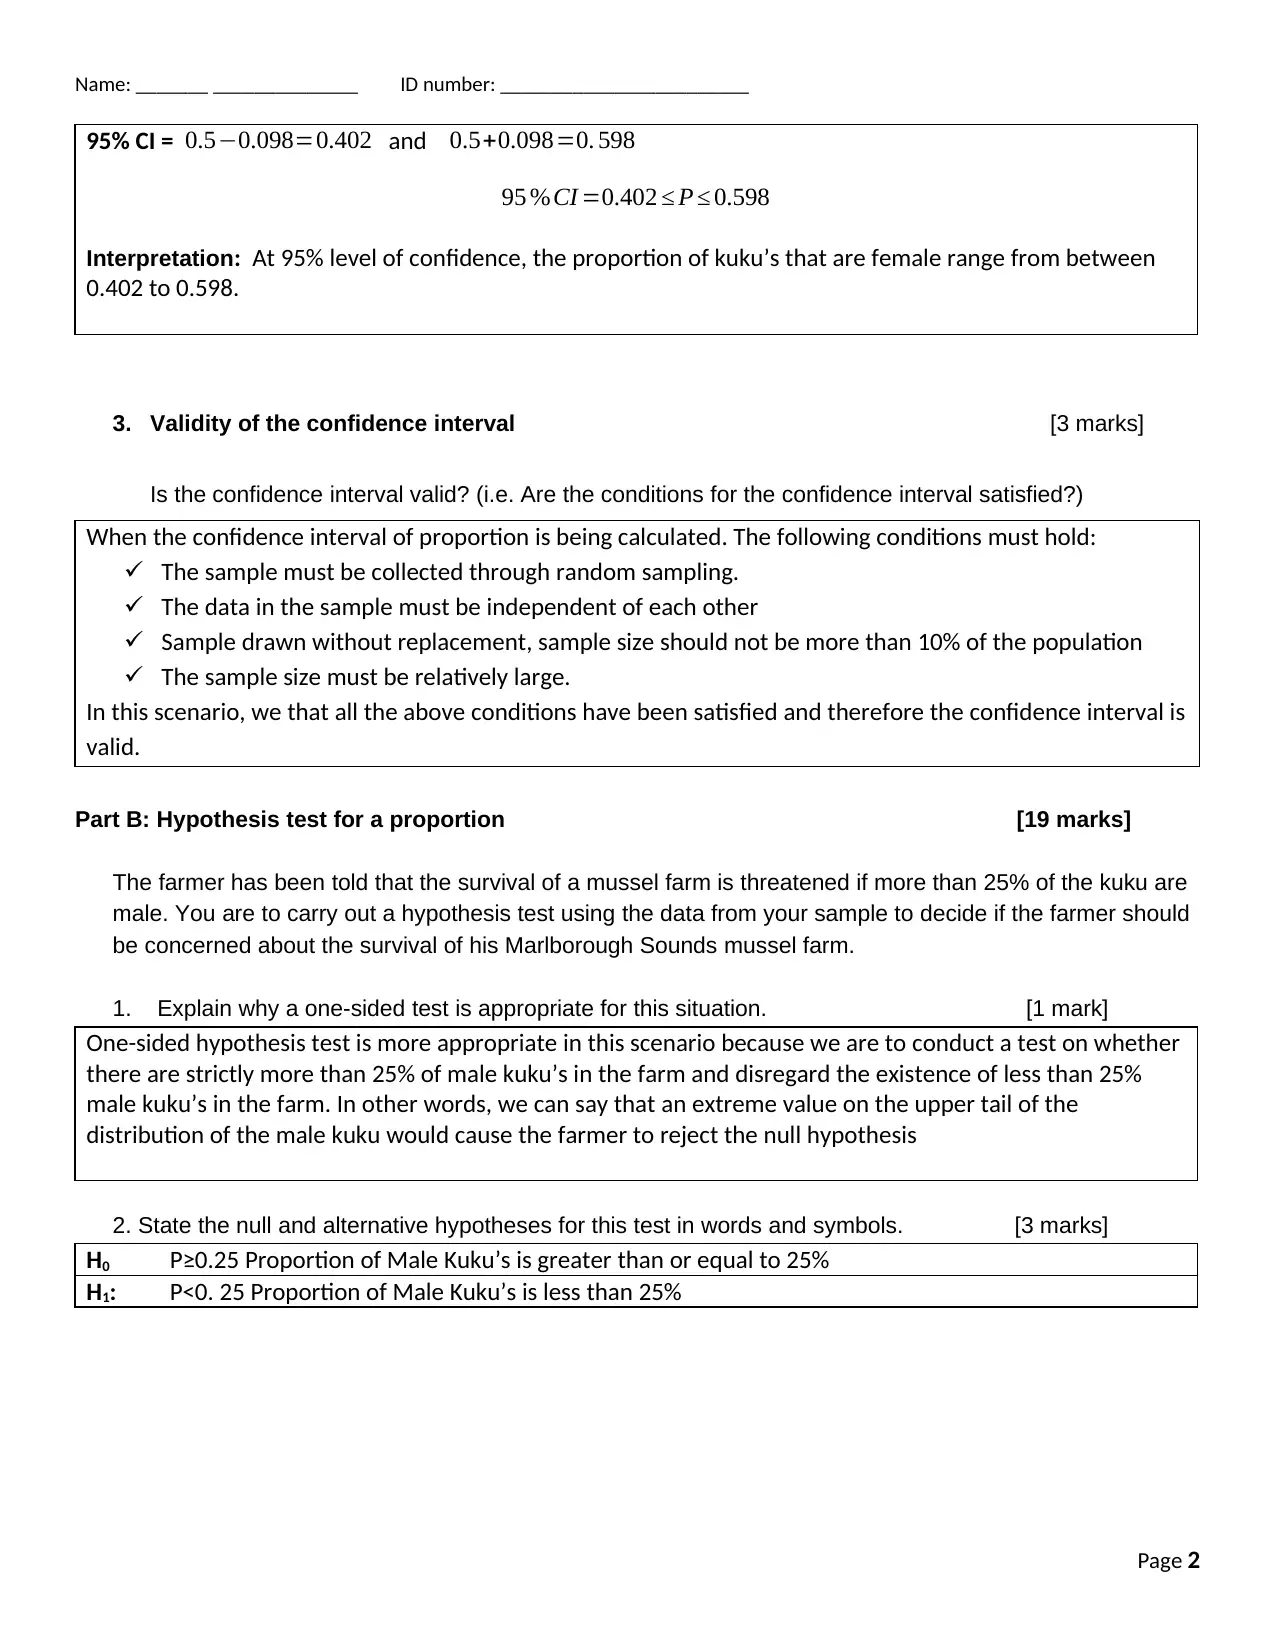
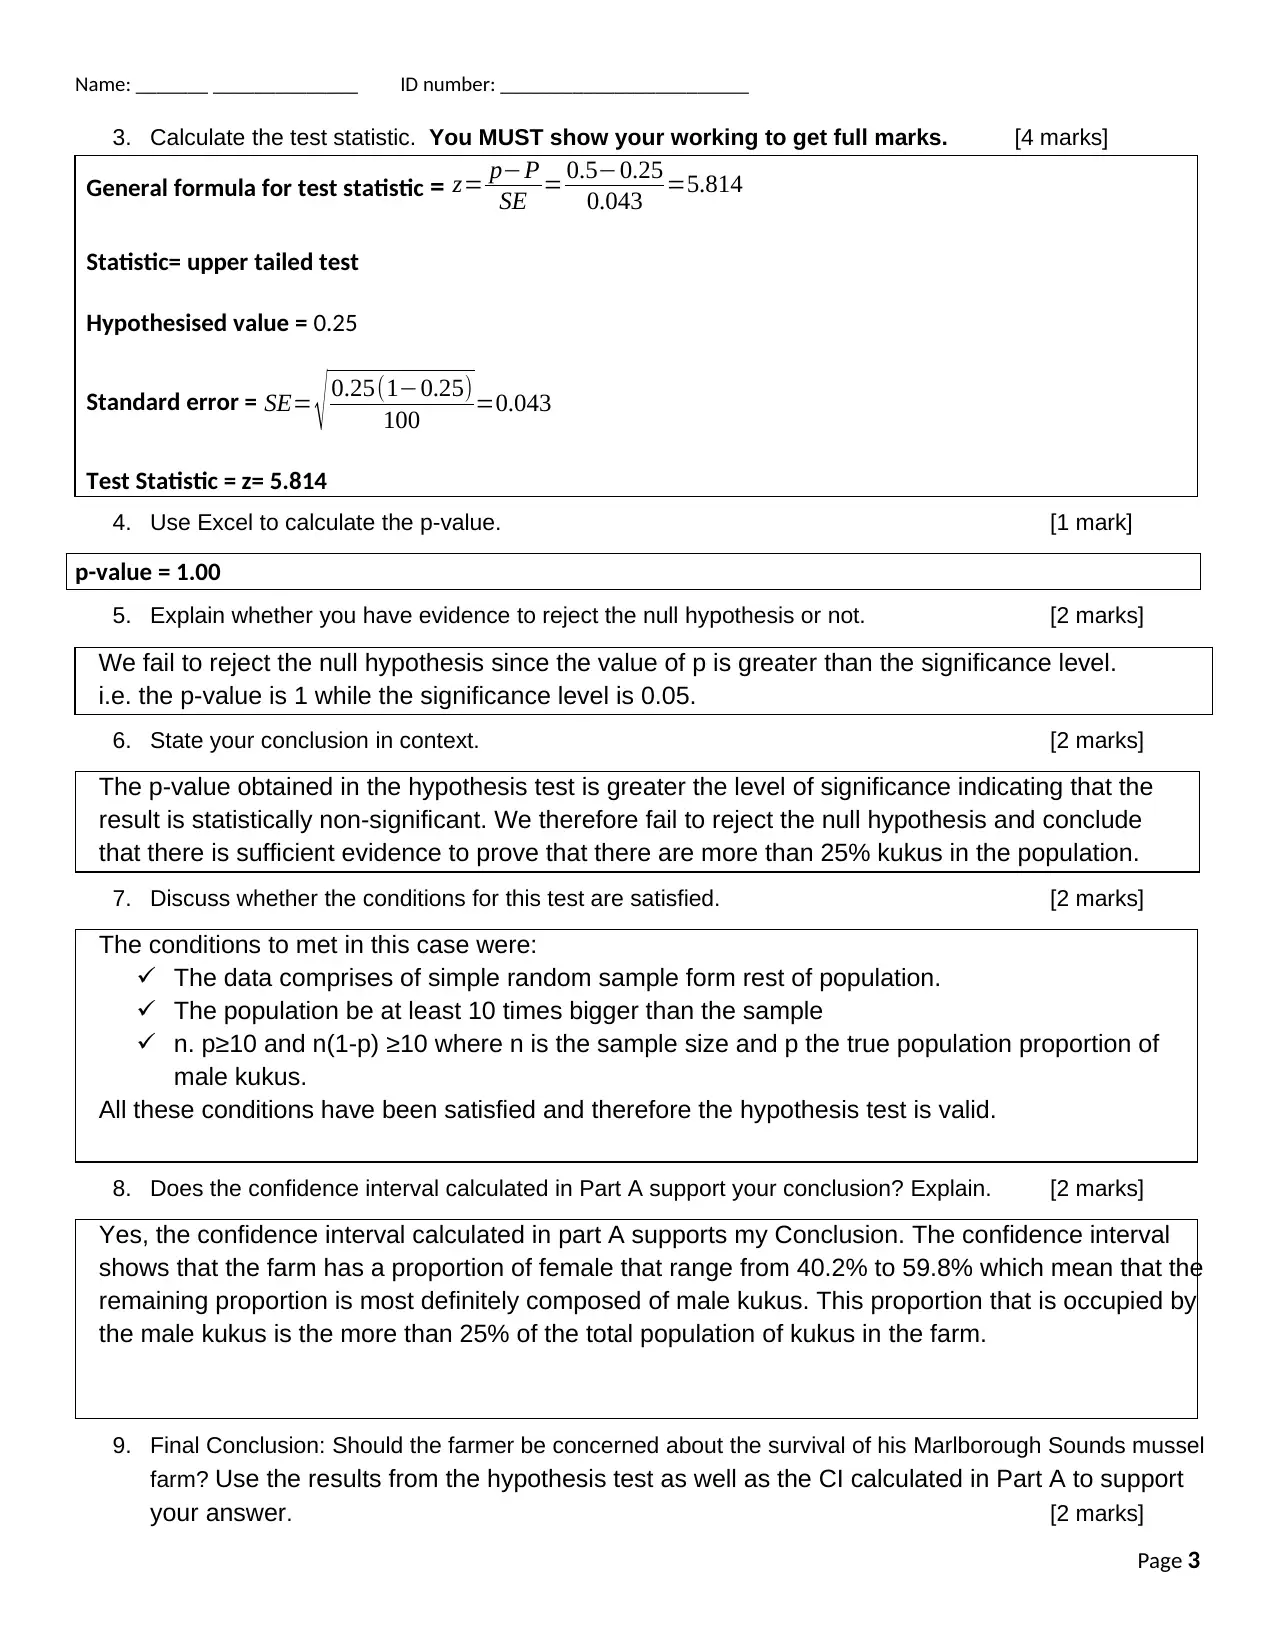
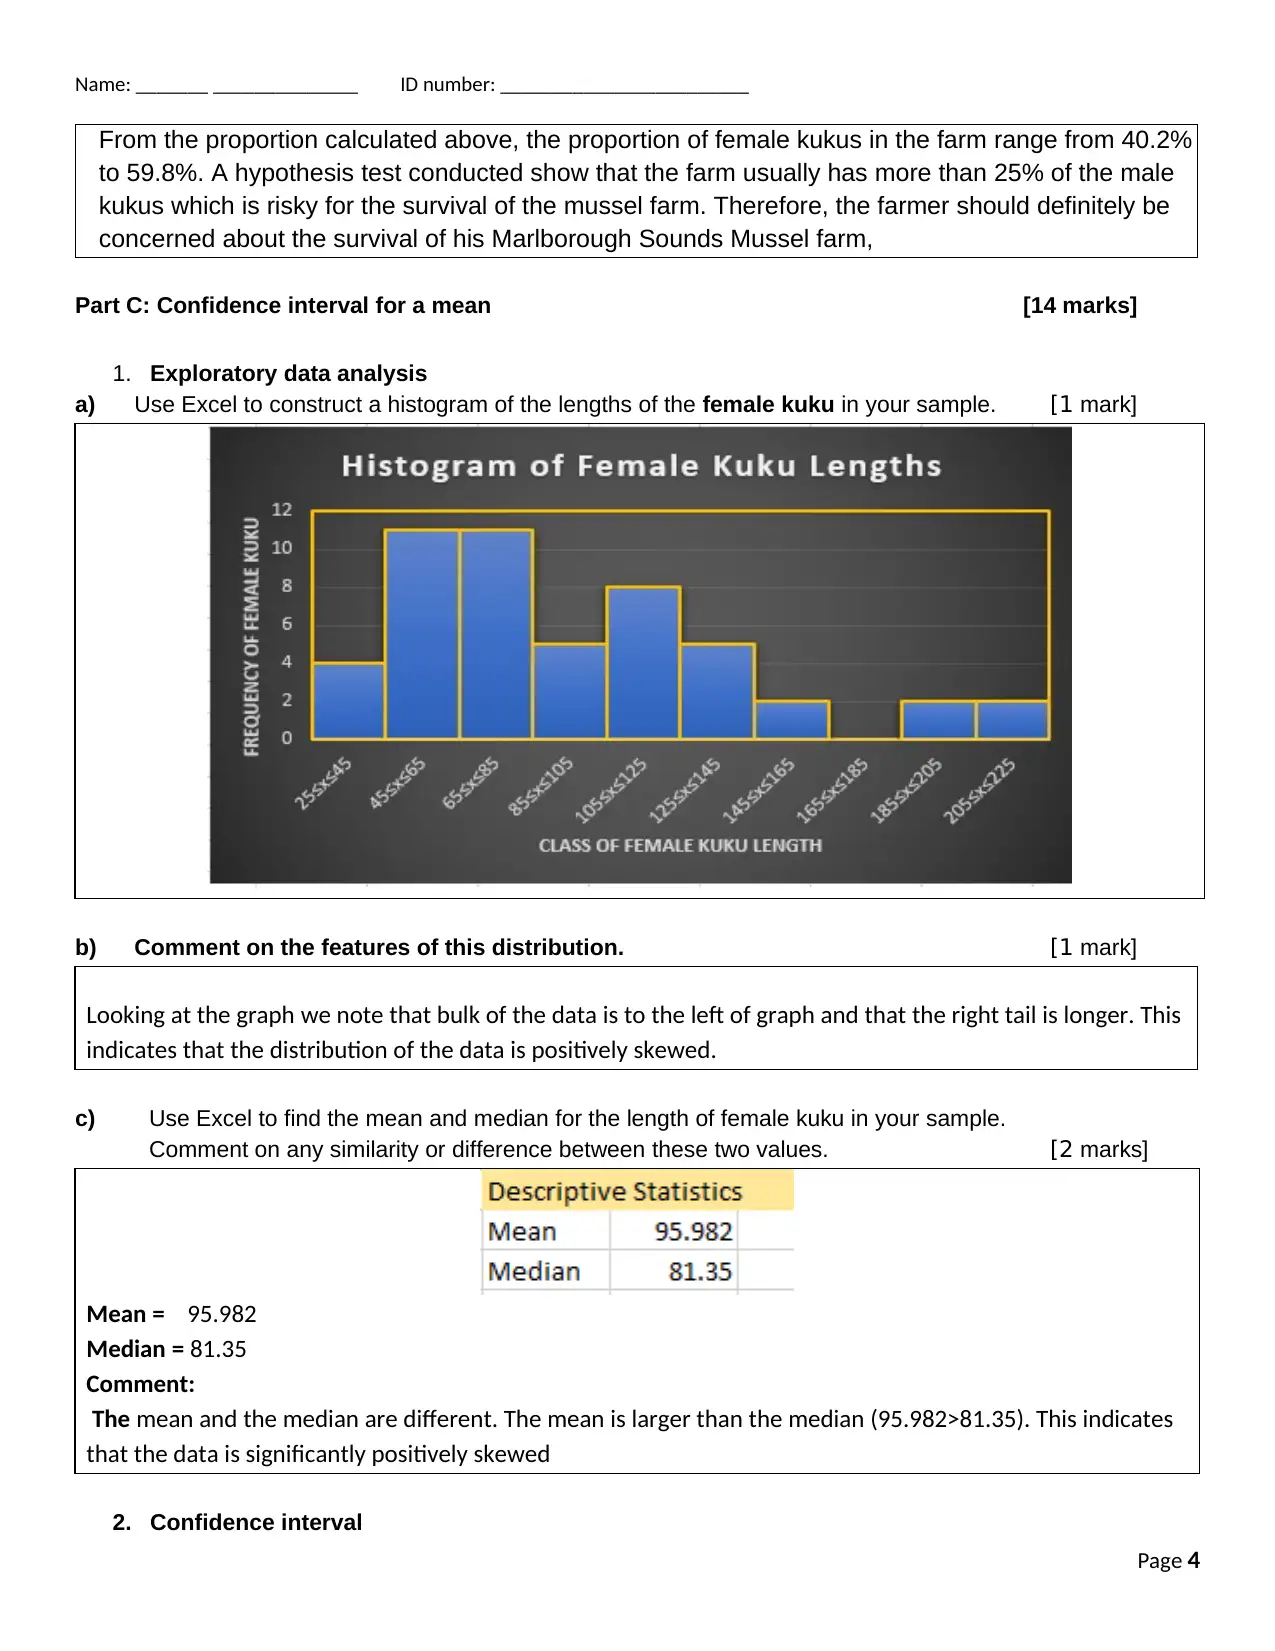
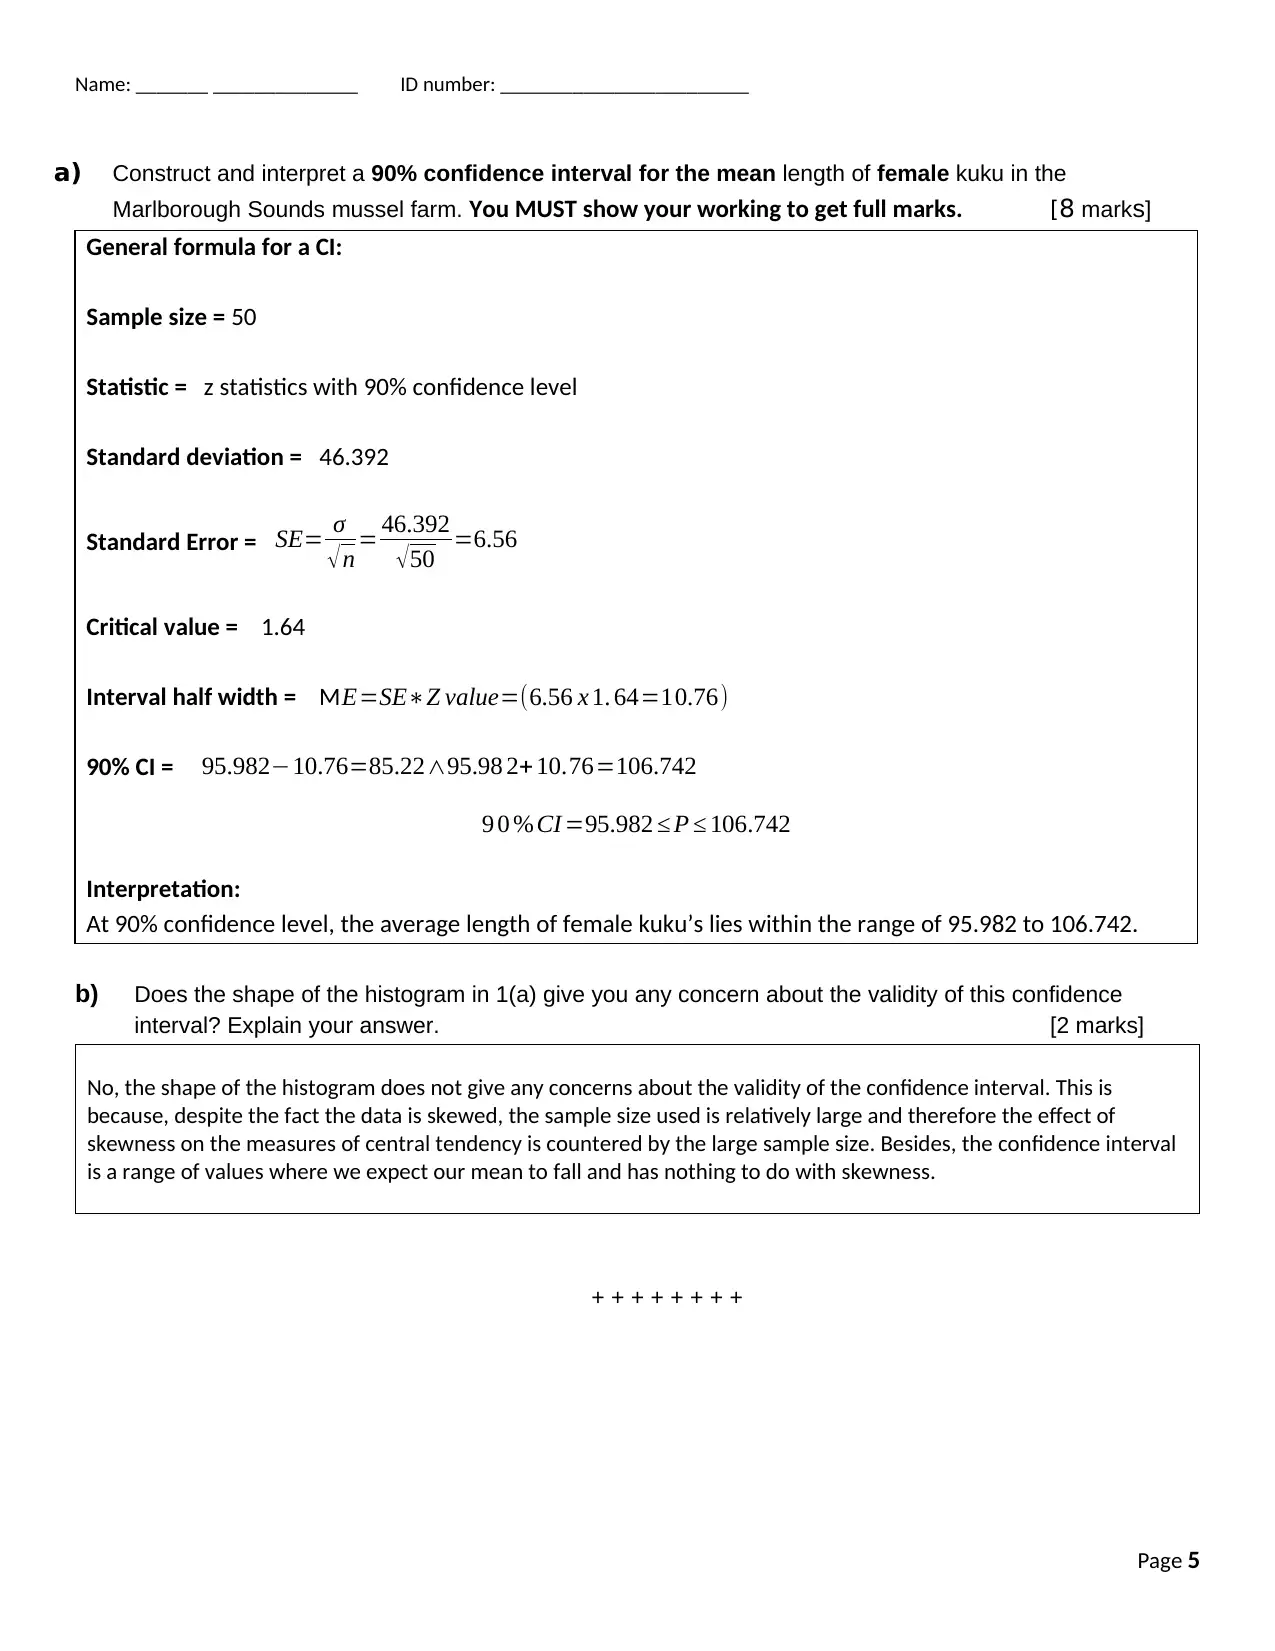
This assignment solution addresses introductory biostatistics concepts using data from a mussel farm. Part A focuses on constructing and interpreting a 95% confidence interval for the proportion of female kuku in a sample, along with assessing the validity of the interval. Part B involves a one-sided hypothesis test to determine if the proportion of male kuku exceeds a critical threshold, including stating hypotheses, calculating the test statistic and p-value, drawing conclusions, and discussing the conditions for the test. Finally, Part C explores confidence intervals for the mean length of female kuku, including exploratory data analysis with histograms and comments on distribution features, and interpreting a 90% confidence interval. The solution also discusses whether the shape of the data distribution affects the confidence interval validity.

Name: _______ ______________ ID number: ________________________
Introductory Biostatistics
Assignment 2: Inference
The population data
The population we are considering for this assignment are the 10,000
kuku (New Zealand green–lipped mussels) growing in a mussel farm in
the Marlborough Sounds.
For assignment 1 you obtained data on a sample of 100 randomly
selected kuku. You will use the data from this same sample for
Assignment 2.
The variables of interest are the length of the kuku (in millimetres), grade (small, medium or large)
and sex (male or female)
Part A: Confidence Interval for a proportion [12 marks]
1. What is the proportion of kuku that are female in your sample? [1 mark]
The proportion of kuku that are female in my sample is 0.5 expressed as percentage is 50%
2. Confidence interval [8 marks]
Construct and interpret a 95% confidence interval for the proportion of kuku in the Marlborough Sounds
mussel farm that are female.
You MUST show your working to get full marks.
General formula for a CI:
Sample size = 100
Statistic = Proportion = 0.5
Standard Error = SE= √ P (1−P)
n = √ 0.5( 1−0.5)
100 =0.05
Critical value = For 95% confidence level (0.05 significance level) critical value is 1.9600
Interval half width = ME=SE∗Z value=(0.05 x 1.96=0.098)
Page 1
Paraphrase This Document
Need a fresh take? Get an instant paraphrase of this document with our AI Paraphraser

Name: _______ ______________ ID number: ________________________
95% CI = 0.5−0.098=0.402 and 0.5+0.098=0. 598
95 %CI =0.402 ≤ P ≤ 0.598
Interpretation: At 95% level of confidence, the proportion of kuku’s that are female range from between
0.402 to 0.598.
3. Validity of the confidence interval [3 marks]
Is the confidence interval valid? (i.e. Are the conditions for the confidence interval satisfied?)
When the confidence interval of proportion is being calculated. The following conditions must hold:
The sample must be collected through random sampling.
The data in the sample must be independent of each other
Sample drawn without replacement, sample size should not be more than 10% of the population
The sample size must be relatively large.
In this scenario, we that all the above conditions have been satisfied and therefore the confidence interval is
valid.
Part B: Hypothesis test for a proportion [19 marks]
The farmer has been told that the survival of a mussel farm is threatened if more than 25% of the kuku are
male. You are to carry out a hypothesis test using the data from your sample to decide if the farmer should
be concerned about the survival of his Marlborough Sounds mussel farm.
1. Explain why a one-sided test is appropriate for this situation. [1 mark]
One-sided hypothesis test is more appropriate in this scenario because we are to conduct a test on whether
there are strictly more than 25% of male kuku’s in the farm and disregard the existence of less than 25%
male kuku’s in the farm. In other words, we can say that an extreme value on the upper tail of the
distribution of the male kuku would cause the farmer to reject the null hypothesis
2. State the null and alternative hypotheses for this test in words and symbols. [3 marks]
H0 P≥0.25 Proportion of Male Kuku’s is greater than or equal to 25%
H1: P<0. 25 Proportion of Male Kuku’s is less than 25%
Page 2

Name: _______ ______________ ID number: ________________________
3. Calculate the test statistic. You MUST show your working to get full marks. [4 marks]
General formula for test statistic = z= p−P
SE = 0.5−0.25
0.043 =5.814
Statistic= upper tailed test
Hypothesised value = 0.25
Standard error = SE= √ 0.25(1−0.25)
100 =0.043
Test Statistic = z= 5.814
4. Use Excel to calculate the p-value. [1 mark]
p-value = 1.00
5. Explain whether you have evidence to reject the null hypothesis or not. [2 marks]
We fail to reject the null hypothesis since the value of p is greater than the significance level.
i.e. the p-value is 1 while the significance level is 0.05.
6. State your conclusion in context. [2 marks]
The p-value obtained in the hypothesis test is greater the level of significance indicating that the
result is statistically non-significant. We therefore fail to reject the null hypothesis and conclude
that there is sufficient evidence to prove that there are more than 25% kukus in the population.
7. Discuss whether the conditions for this test are satisfied. [2 marks]
The conditions to met in this case were:
The data comprises of simple random sample form rest of population.
The population be at least 10 times bigger than the sample
n. p≥10 and n(1-p) ≥10 where n is the sample size and p the true population proportion of
male kukus.
All these conditions have been satisfied and therefore the hypothesis test is valid.
8. Does the confidence interval calculated in Part A support your conclusion? Explain. [2 marks]
Yes, the confidence interval calculated in part A supports my Conclusion. The confidence interval
shows that the farm has a proportion of female that range from 40.2% to 59.8% which mean that the
remaining proportion is most definitely composed of male kukus. This proportion that is occupied by
the male kukus is the more than 25% of the total population of kukus in the farm.
9. Final Conclusion: Should the farmer be concerned about the survival of his Marlborough Sounds mussel
farm? Use the results from the hypothesis test as well as the CI calculated in Part A to support
your answer. [2 marks]
Page 3
⊘ This is a preview!⊘
Do you want full access?
Subscribe today to unlock all pages.

Trusted by 1+ million students worldwide

Name: _______ ______________ ID number: ________________________
From the proportion calculated above, the proportion of female kukus in the farm range from 40.2%
to 59.8%. A hypothesis test conducted show that the farm usually has more than 25% of the male
kukus which is risky for the survival of the mussel farm. Therefore, the farmer should definitely be
concerned about the survival of his Marlborough Sounds Mussel farm,
Part C: Confidence interval for a mean [14 marks]
1. Exploratory data analysis
a) Use Excel to construct a histogram of the lengths of the female kuku in your sample. [1 mark]
b) Comment on the features of this distribution. [1 mark]
Looking at the graph we note that bulk of the data is to the left of graph and that the right tail is longer. This
indicates that the distribution of the data is positively skewed.
c) Use Excel to find the mean and median for the length of female kuku in your sample.
Comment on any similarity or difference between these two values. [2 marks]
Mean = 95.982
Median = 81.35
Comment:
The mean and the median are different. The mean is larger than the median (95.982>81.35). This indicates
that the data is significantly positively skewed
2. Confidence interval
Page 4
Paraphrase This Document
Need a fresh take? Get an instant paraphrase of this document with our AI Paraphraser

Name: _______ ______________ ID number: ________________________
a) Construct and interpret a 90% confidence interval for the mean length of female kuku in the
Marlborough Sounds mussel farm. You MUST show your working to get full marks. [8 marks]
General formula for a CI:
Sample size = 50
Statistic = z statistics with 90% confidence level
Standard deviation = 46.392
Standard Error = SE= σ
√n = 46.392
√50 =6.56
Critical value = 1.64
Interval half width = ME=SE∗Z value=(6.56 x 1. 64=10.76)
90% CI = 95.982−10.76=85.22∧95.98 2+ 10.76=106.742
9 0 % CI =95.982 ≤ P ≤ 106.742
Interpretation:
At 90% confidence level, the average length of female kuku’s lies within the range of 95.982 to 106.742.
b) Does the shape of the histogram in 1(a) give you any concern about the validity of this confidence
interval? Explain your answer. [2 marks]
No, the shape of the histogram does not give any concerns about the validity of the confidence interval. This is
because, despite the fact the data is skewed, the sample size used is relatively large and therefore the effect of
skewness on the measures of central tendency is countered by the large sample size. Besides, the confidence interval
is a range of values where we expect our mean to fall and has nothing to do with skewness.
+ + + + + + + +
Page 5
1 out of 5
Related Documents

Your All-in-One AI-Powered Toolkit for Academic Success.
+13062052269
info@desklib.com
Available 24*7 on WhatsApp / Email
Unlock your academic potential
© 2024 | Zucol Services PVT LTD | All rights reserved.