Biostatistics Assignment: Data Analysis, Interpretation, and Results

Verified

Added on  2020/06/04

|12
|1507
|54
Homework Assignment
AI Summary
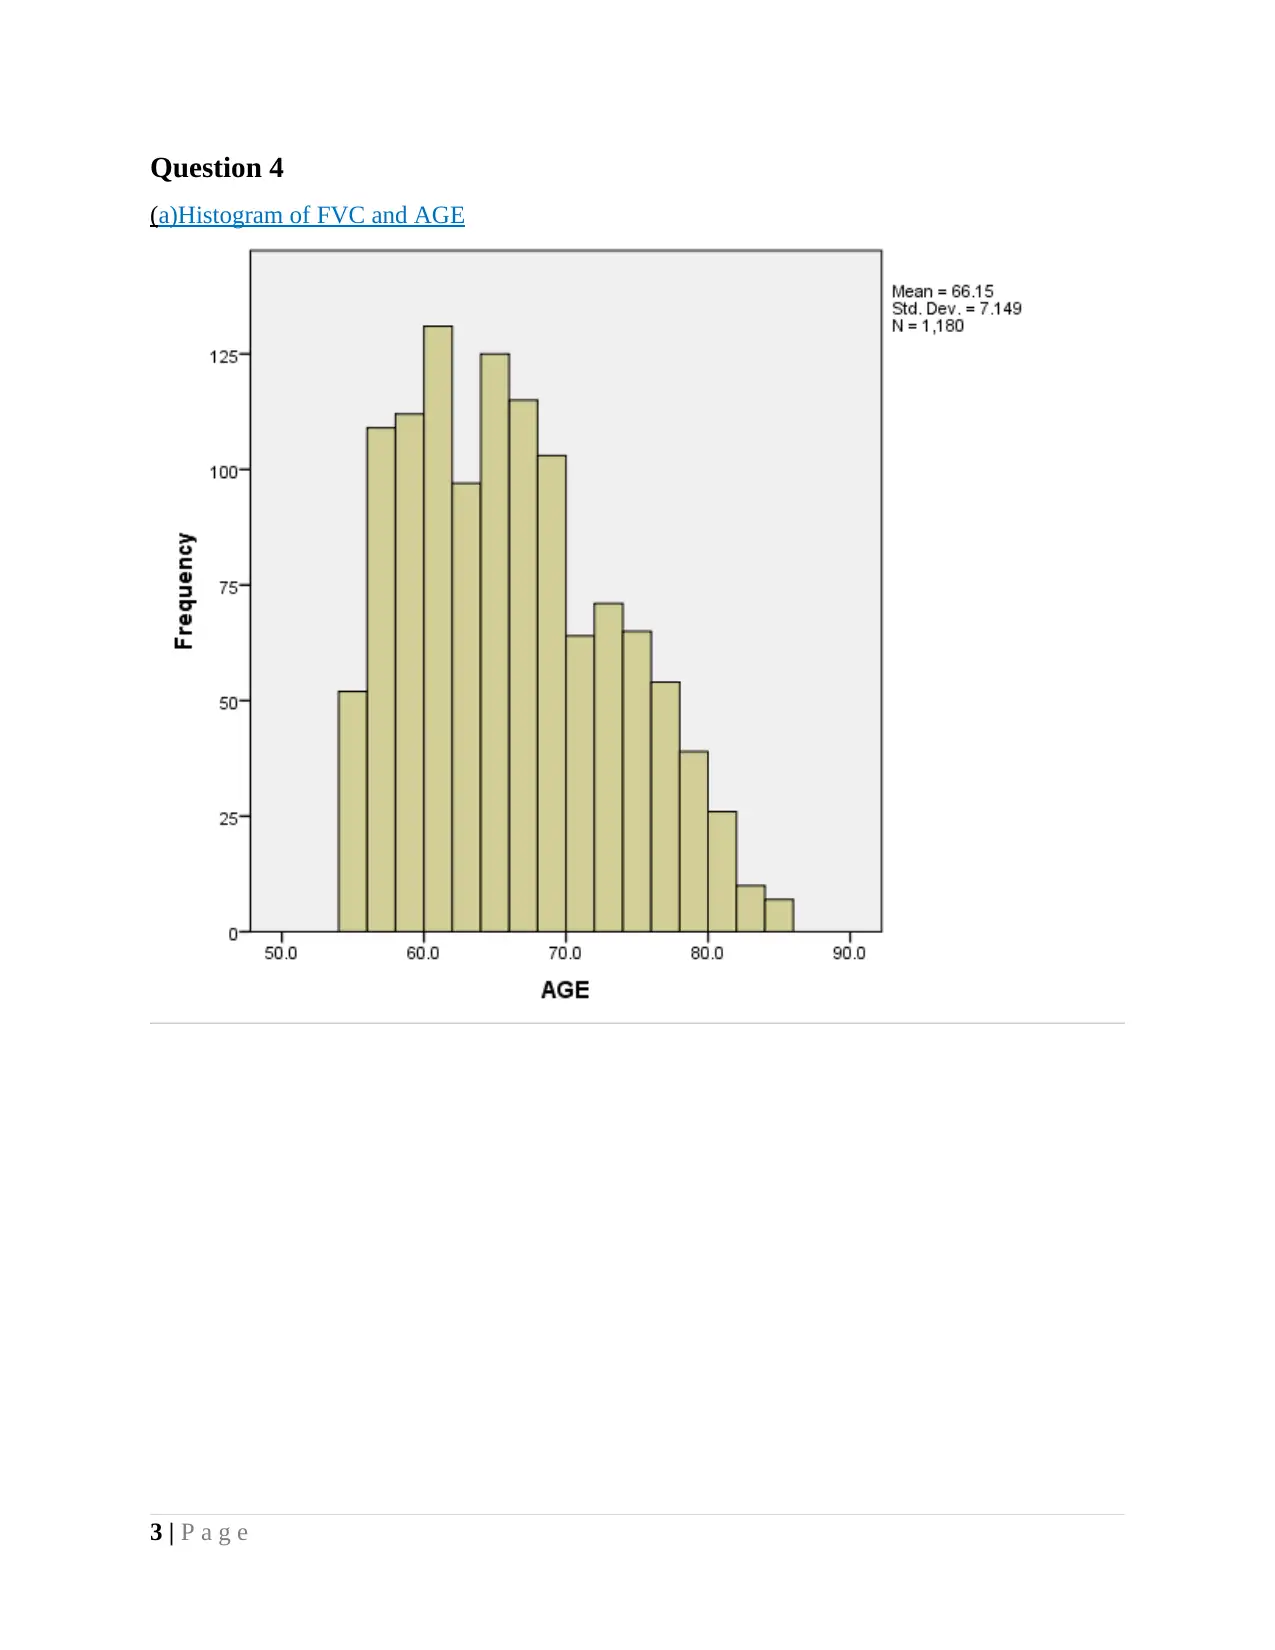
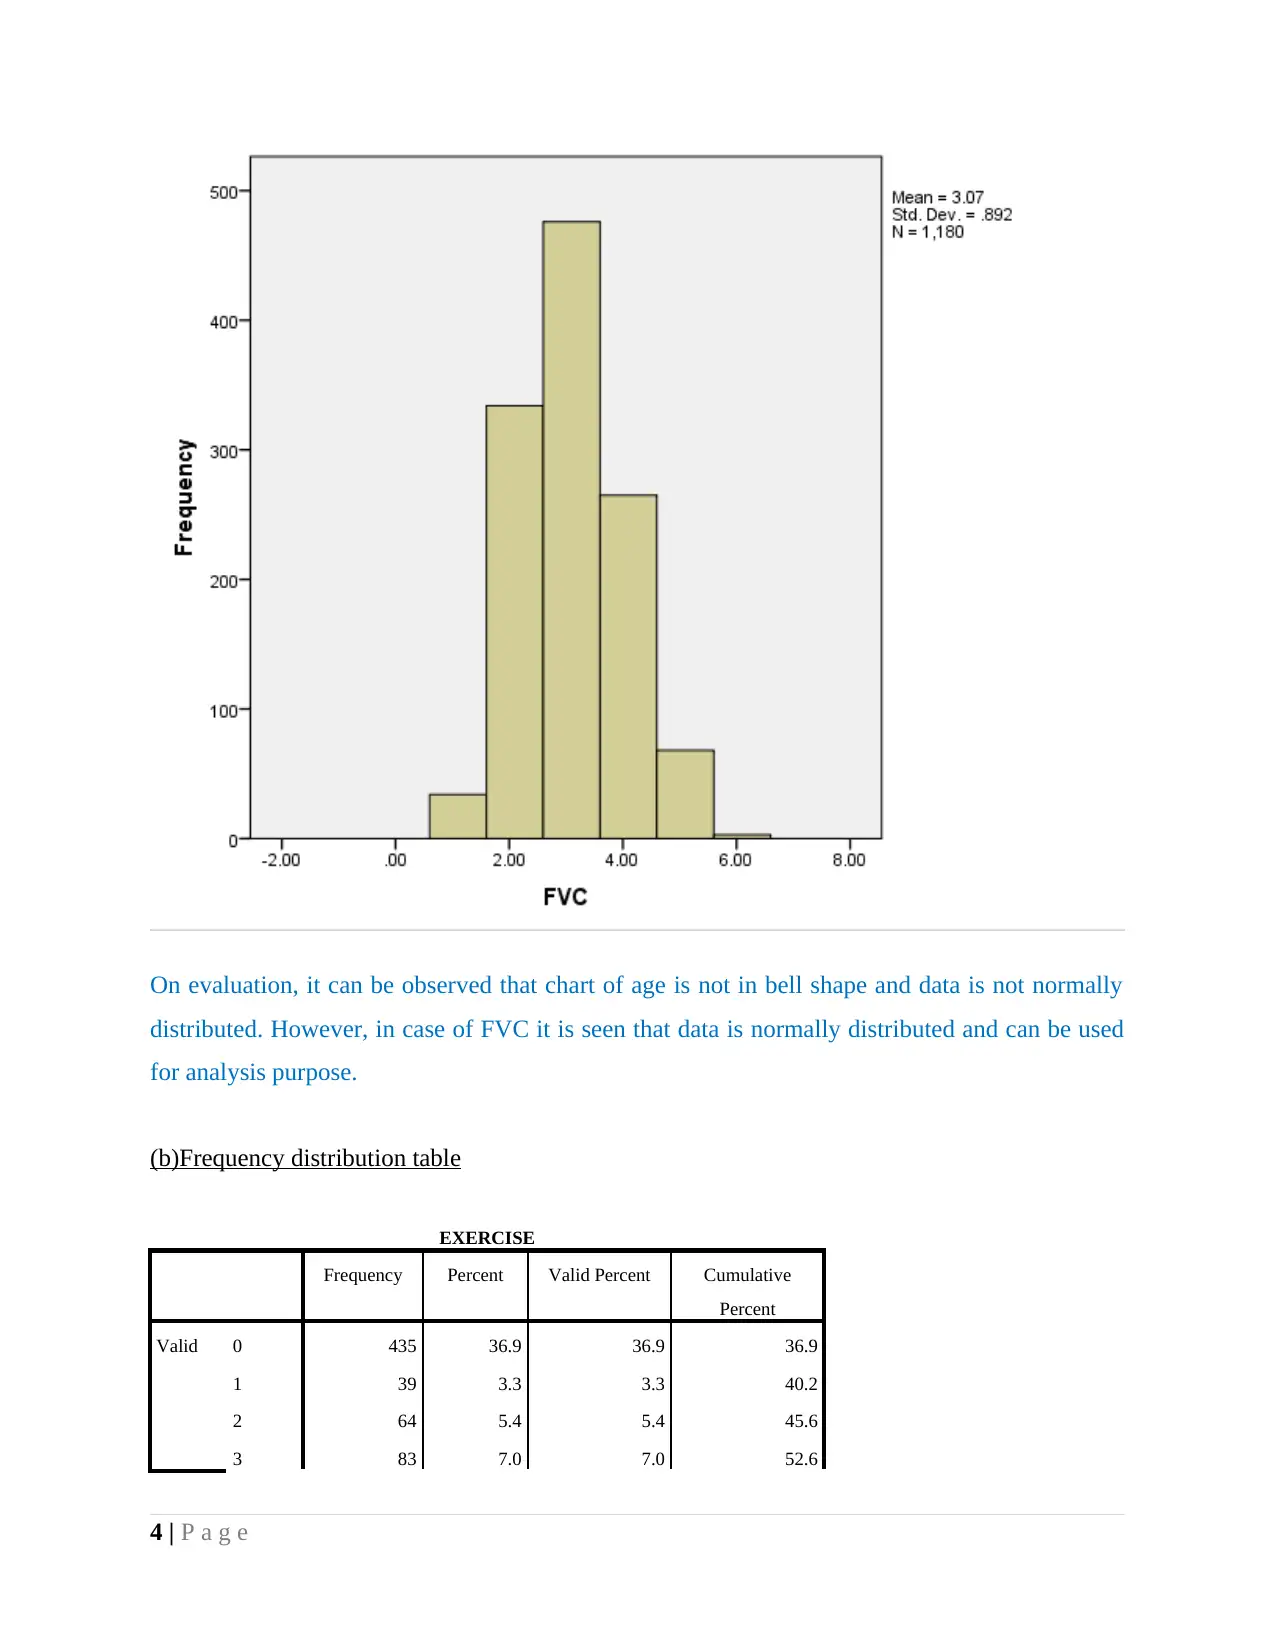
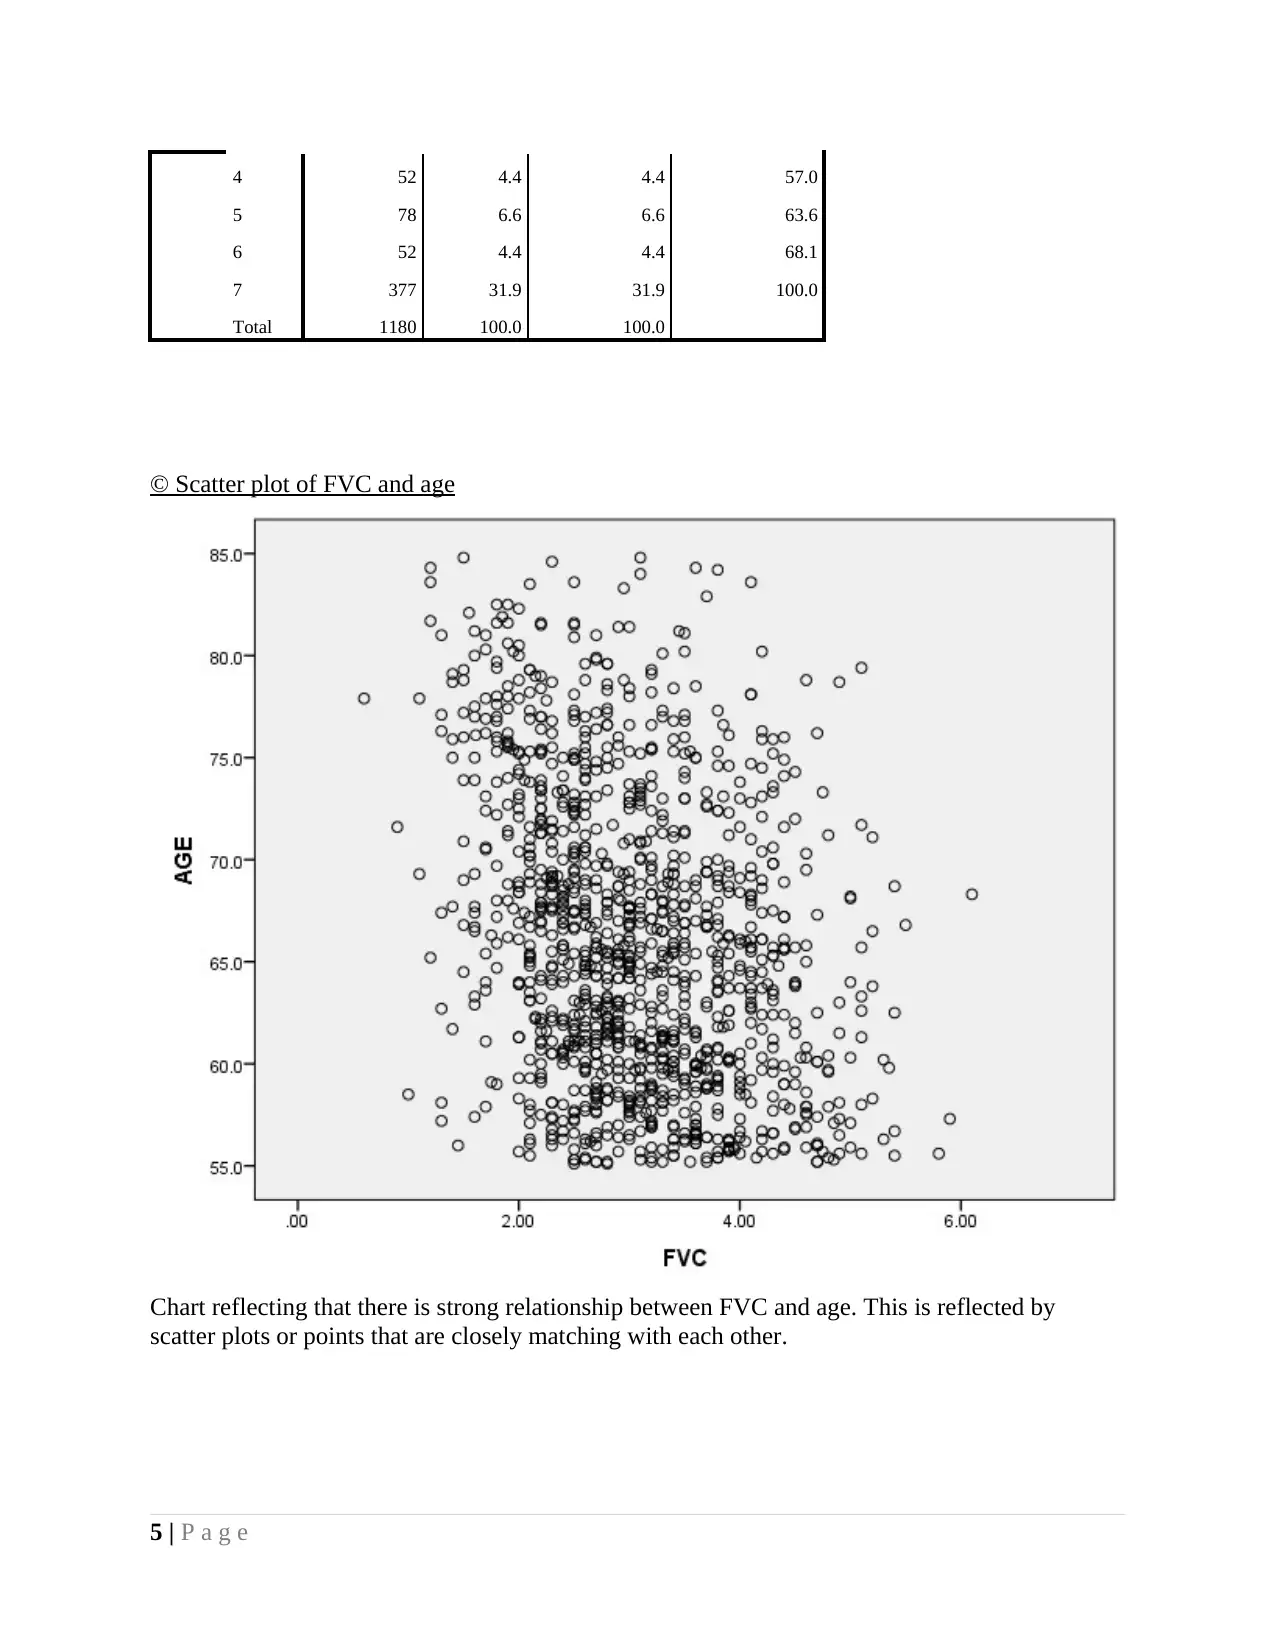
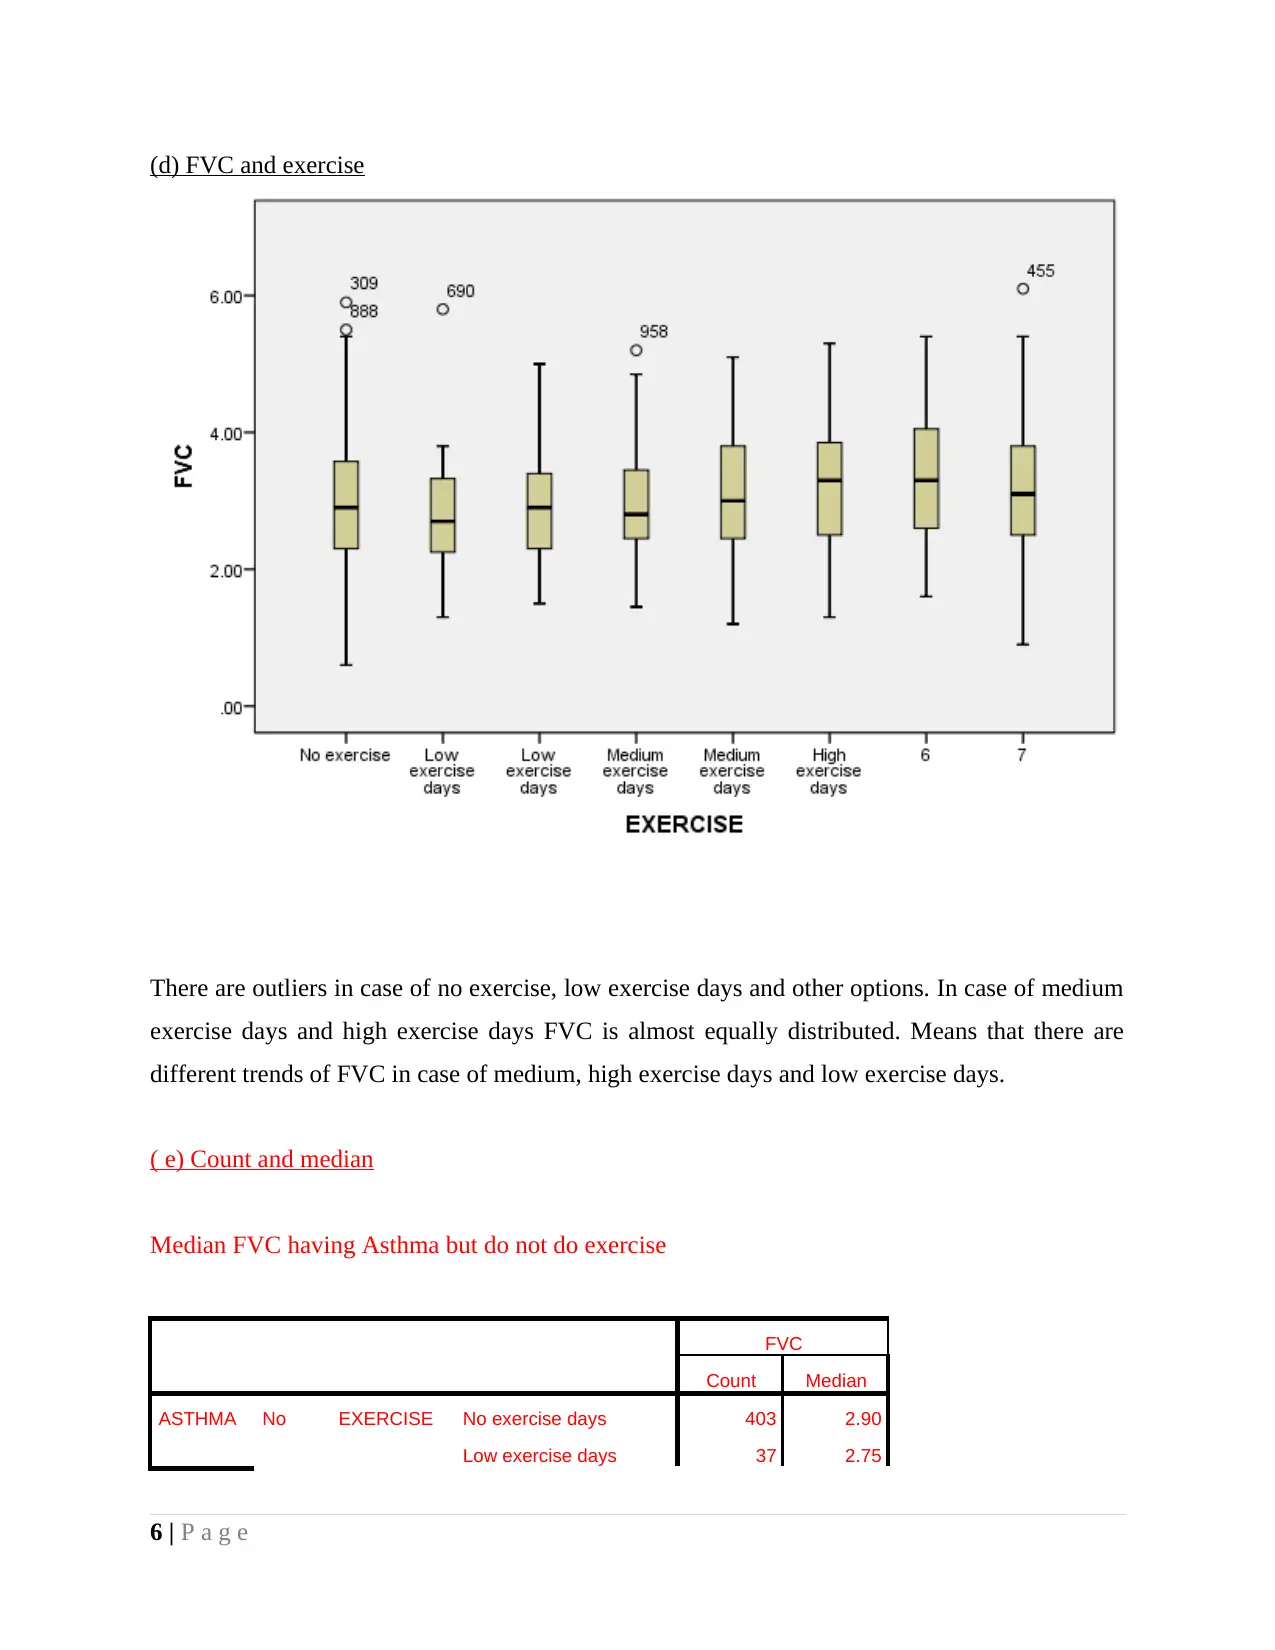
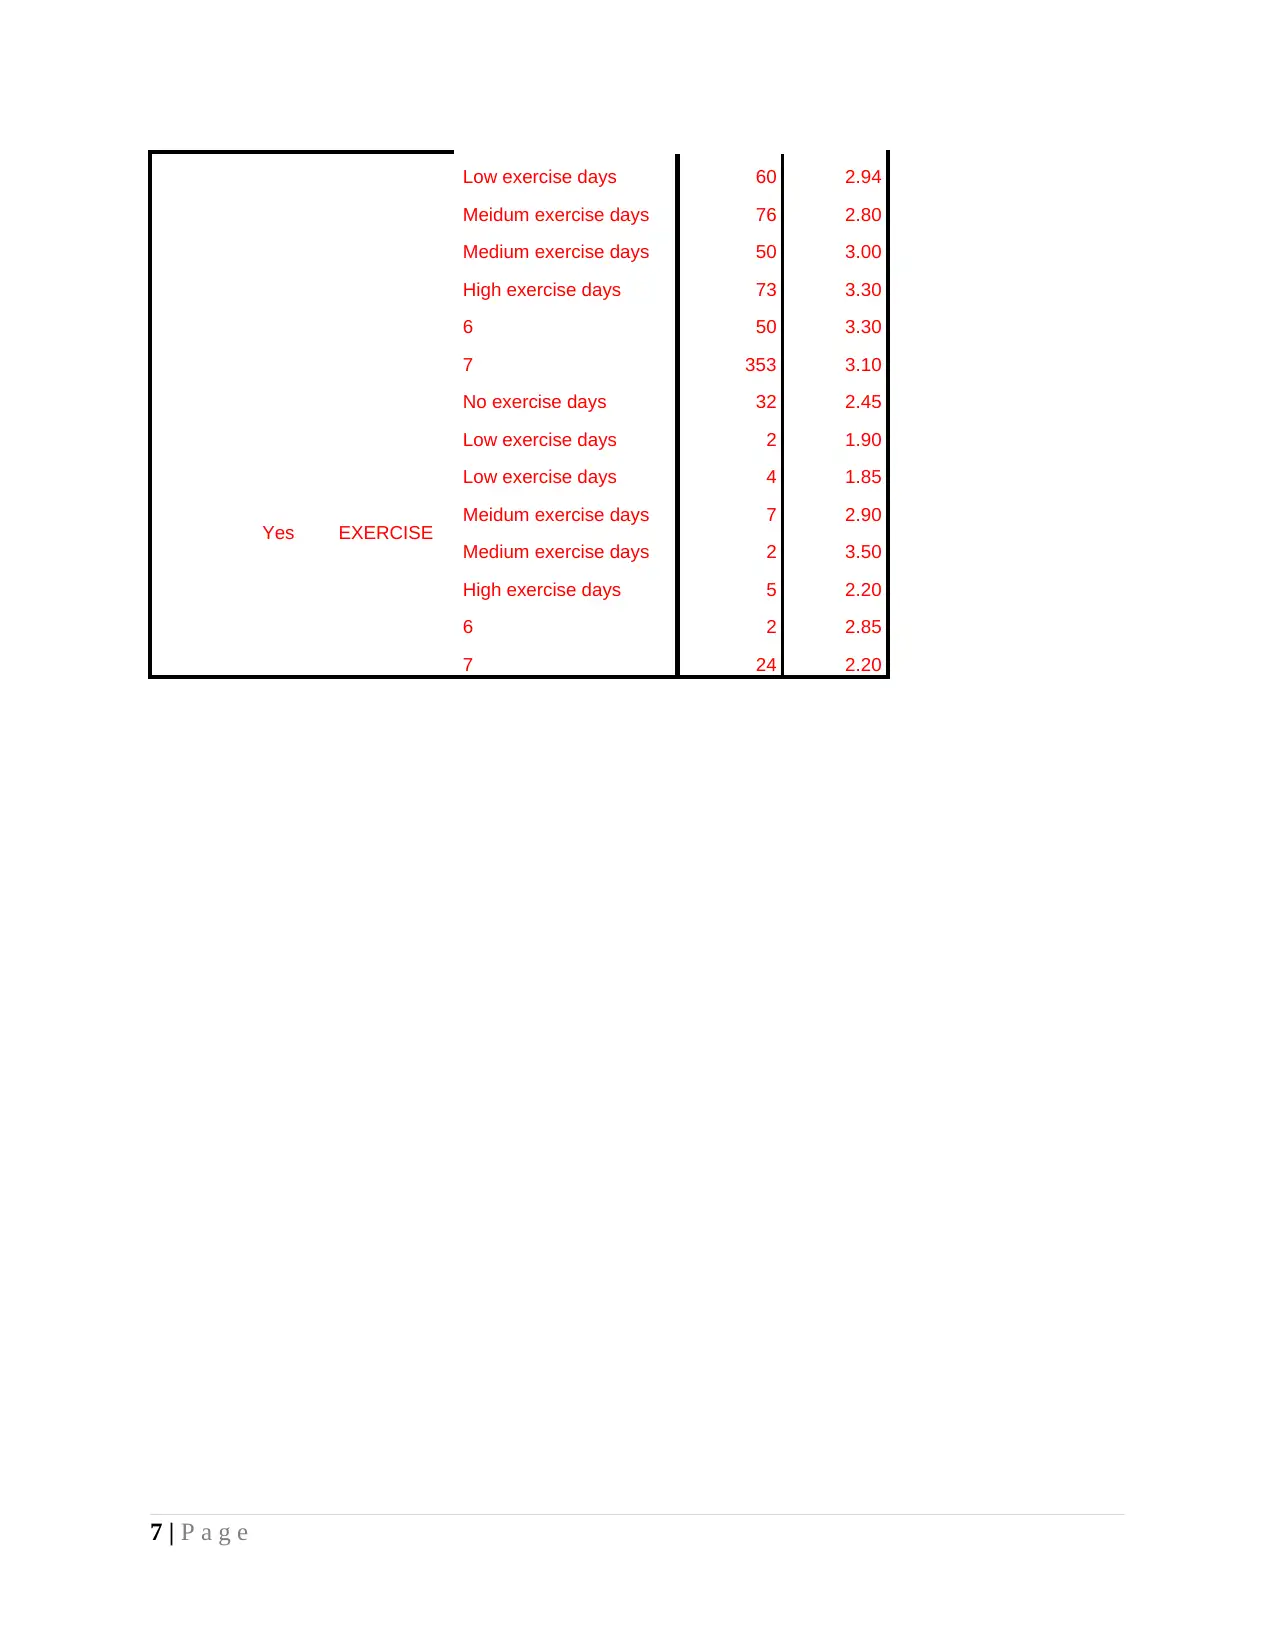
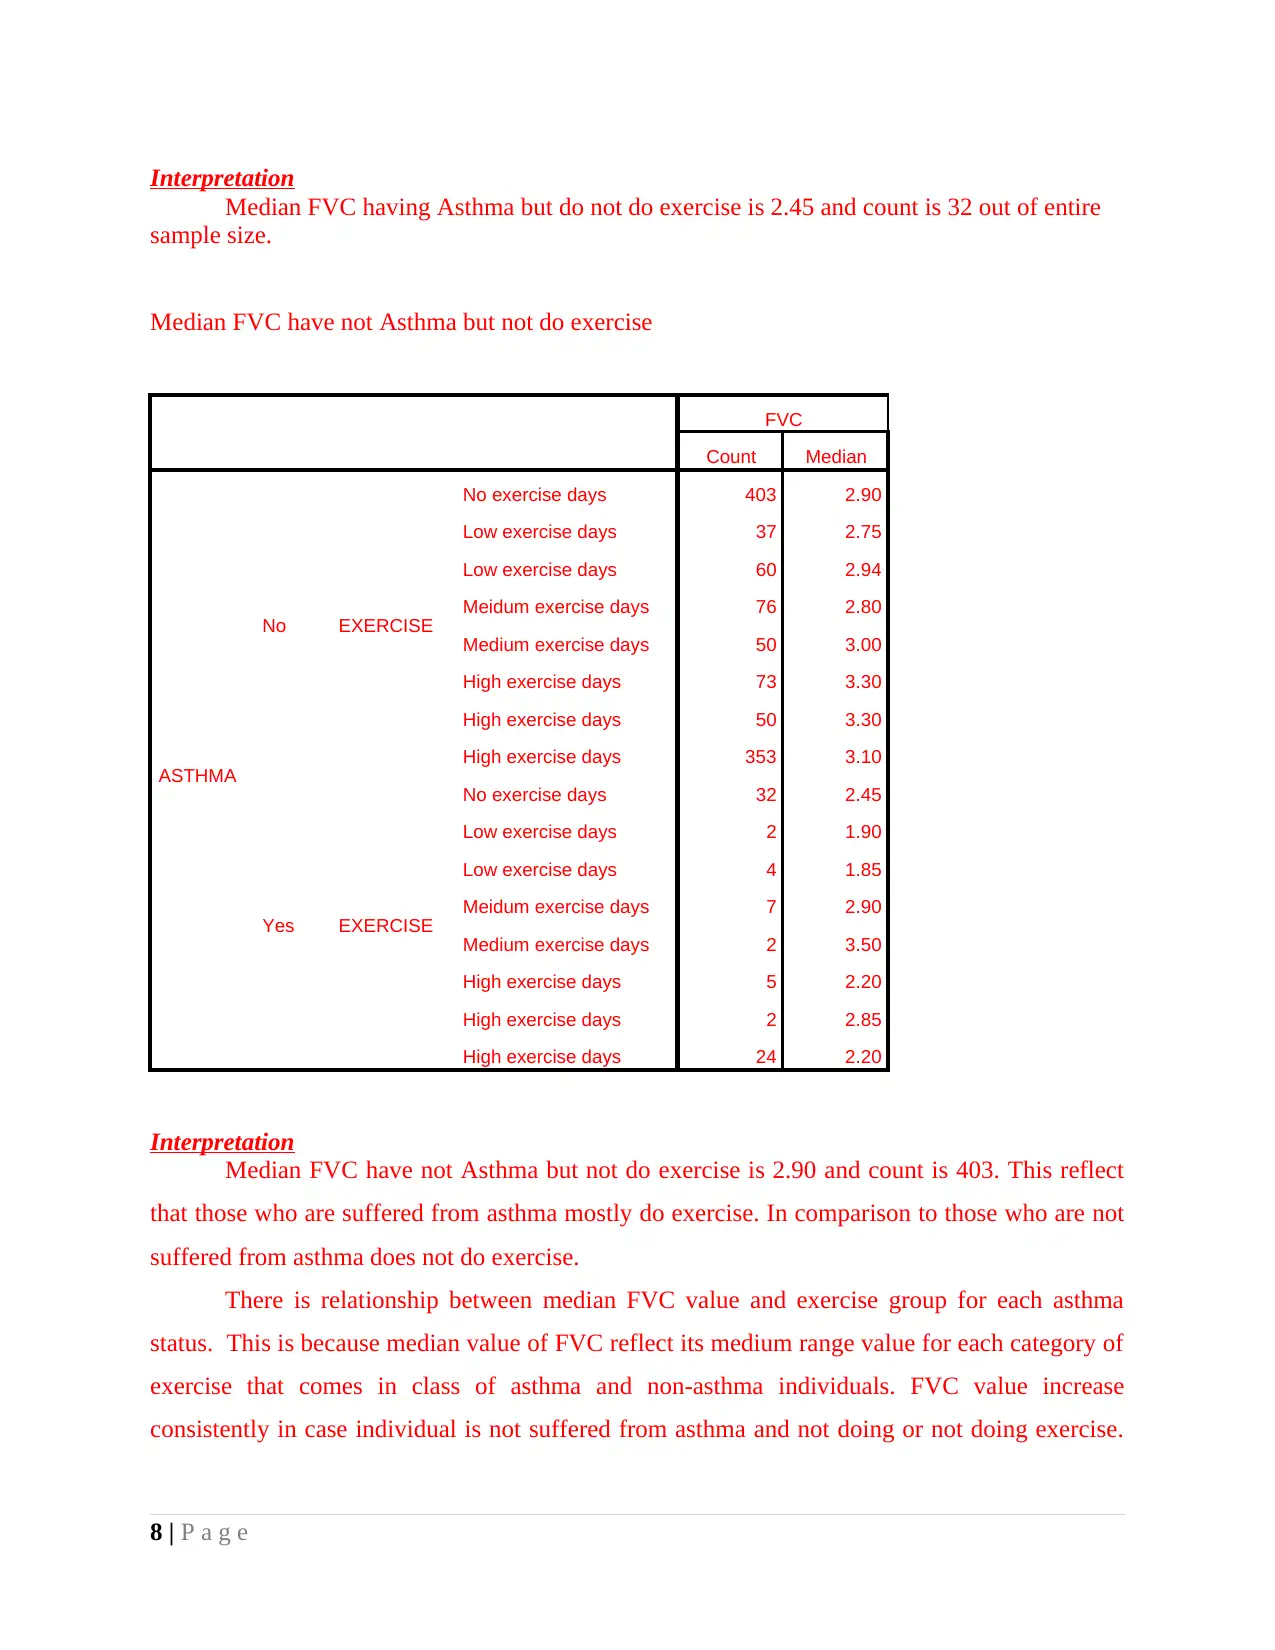
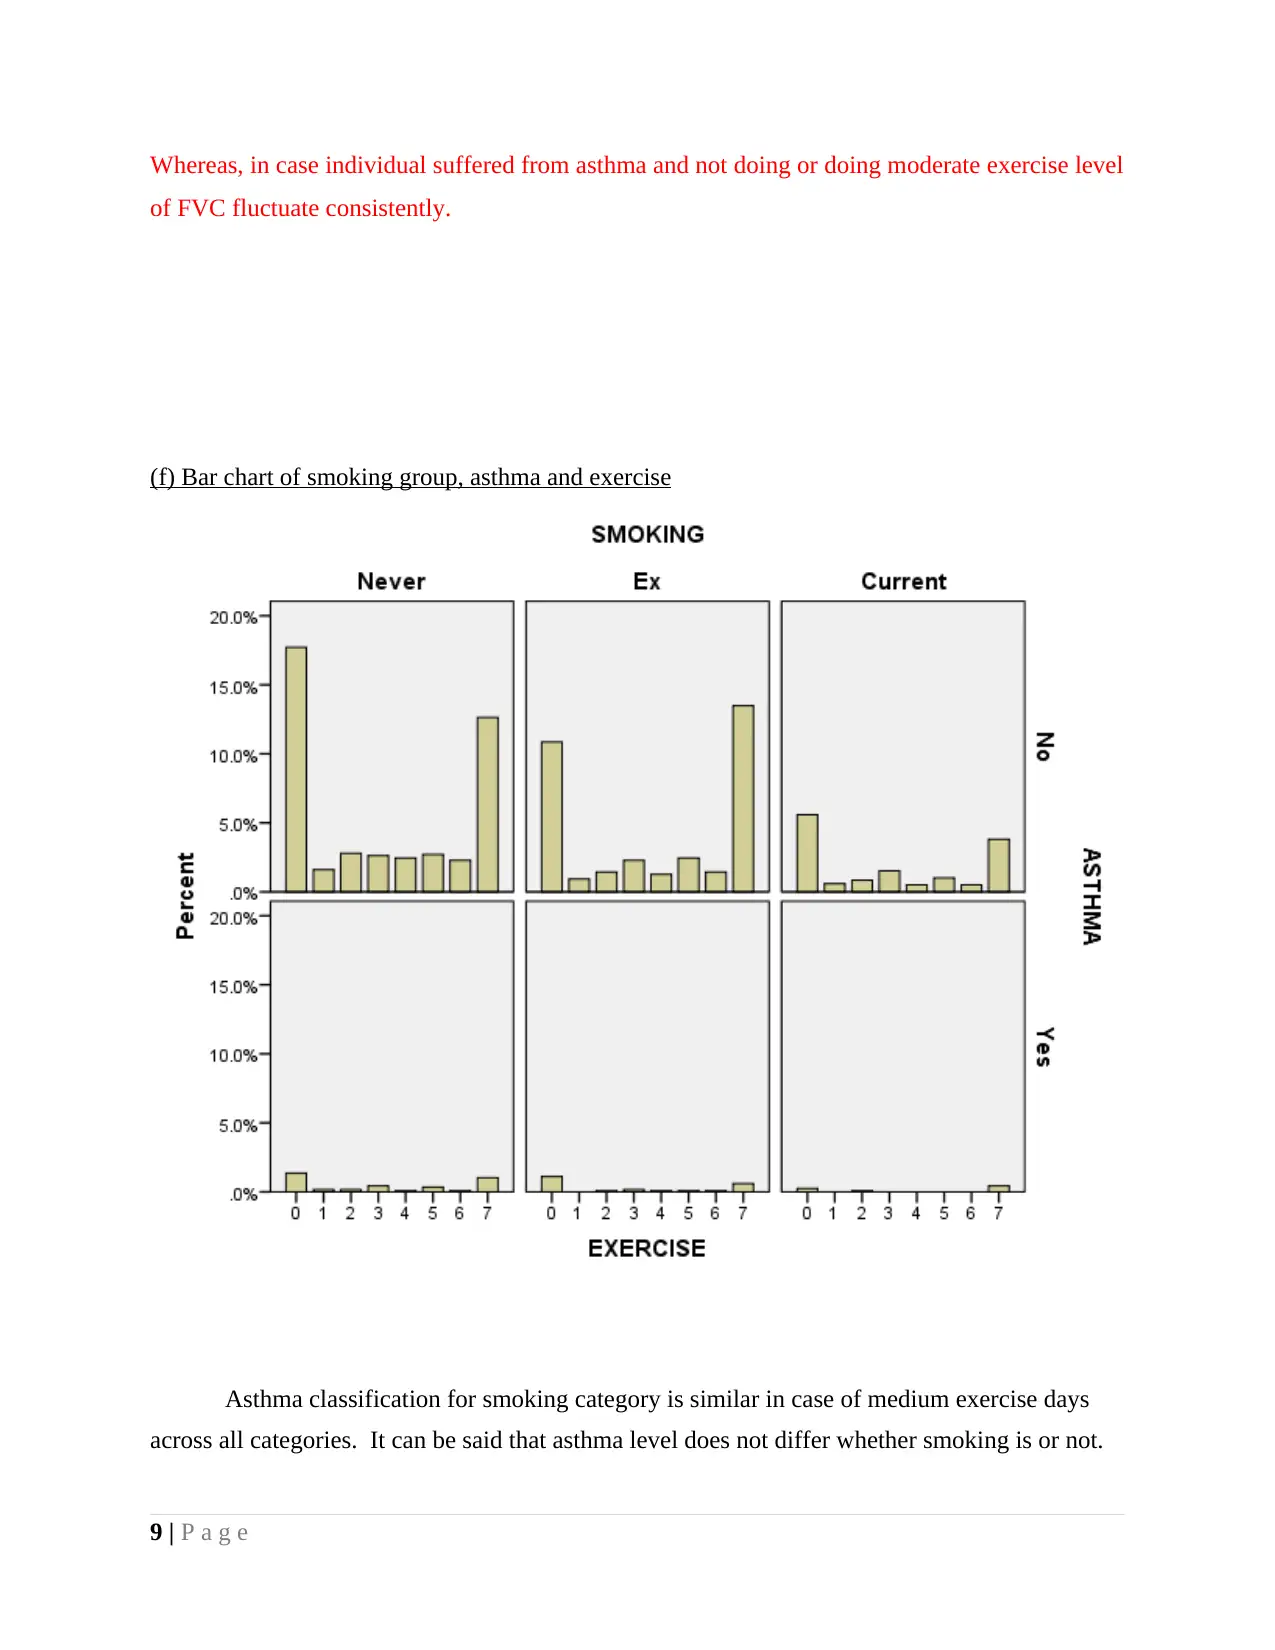
This biostatistics assignment presents a comprehensive analysis of various datasets, including mortality rates, tumour sizes, and Forced Vital Capacity (FVC) data. The analysis begins with an examination of external causes of death, comparing intentional deaths between men and women and calculating percentages. It then delves into the interquartile range of FUP values, the percentage of adults with FUP greater than 1, and reasons for differences between the mean and median. The assignment continues with the mean tumour size for females, identification of the age group with the lowest coefficient of variation, and confidence interval construction. Furthermore, it includes the creation and interpretation of histograms, frequency distribution tables, and scatter plots to analyze the relationship between FVC and age, as well as the impact of exercise. The report also provides a detailed analysis of median FVC values in relation to asthma status and exercise levels, and concludes with a bar chart analysis of smoking groups, asthma, and exercise habits. The assignment utilizes various statistical methods to interpret the data and draw meaningful conclusions.
Document Page
BIOSTATISTICS
tabler-icon-diamond-filled.svg

Paraphrase This Document

Need a fresh take? Get an instant paraphrase of this document with our AI Paraphraser
Document Page
TABLE OF CONTENTS
INTRODUCTION...........................................................................................................................1
Question 1........................................................................................................................................1
(a)Total external causes of death for men and women and porportion of internal casue of death
.....................................................................................................................................................1
(b) Percentage death of male in age category of less then 65 and between 65-74......................1
©Death of women by chocking and aspiration...........................................................................1
Question 2........................................................................................................................................1
(a)Inter quartile range of fup for sample of adults.......................................................................1
(b)Percentage of adults have fup greater than 1..........................................................................1
© Reason for mean of fup likely to smaller or longer then median value...................................1
Question 3........................................................................................................................................2
(a)Mean of tumour size for all females........................................................................................2
(b)Age group having lowest coffecient of variation....................................................................2
© Construction of interval...........................................................................................................2
Question 4........................................................................................................................................3
(a)Histogram of FVC and AGE...................................................................................................3
(b)Frequency distribution table....................................................................................................4
© Scatter plot of FVC and age.....................................................................................................5
(d) FVC and exercise...................................................................................................................6
( e) Count and median..................................................................................................................6
(f) Bar chart of smoking group, asthma and exercise..................................................................7
Document Page
INTRODUCTION
Question 1
(a)Total external causes of death for men and women and porportion of internal casue of death
It can be observed that there are total 66 females 117 males in category of intentional
causes of death. In order to compute total death that comes in intentional category addition of
values is done which are 66+117=183. In order to compute percentage of women died due to
intention equation is used which is 66/183=30.66% which means that toal women died due to
intention in overall intentional death cases are 36.06%. Whereas, same for male is
117/183*100=63.93% which means that overall death percentage of male was 63.93% in overall
deaths that happened due to some intention. It can be said that intentionally male died more then
females.
(b) Percentage death of male in age category of less then 65 and between 65-74
Overall number of male died in age category of less then 65 and between 65-74 are
57+132=189. Total women and male died across all age group are 119 and 189 and their total is
308. Proportion of male in overall death that comes in age group of less then 65 and between 65-
74 is 189/308= 61%.
©Death of women by chocking and aspiration
Death occur due to chocking in case of women is 57% which is computed by using
equation 128/225*10=57%. 128 reflect death of women caused by chocking and 225 reflect
overall women died by unintentional causes. Similalrly, in case of Asphyxia and aspiration total
death caused is 6% whuch is computed by using equation 14/225*100=6%.
Question 2
(a)Inter quartile range of fup for sample of adults
Value of Q1 0.25(473+1) and its value is 118.5 and value of Q2 is 355.5 which is
computed by using formula 0.75(473+1). Frequency of Q1 and Q2 is 2 and 7. Due to this reason
inter quartile value is 5.
(b)Percentage of adults have fup greater than 1
93% of observations have fup value greater then 1. Total number of observations are 417
out of 473 and due to this reason 417/473*100=88.16%.
1 | P a g e
Document Page
© Reason for mean of fup likely to smaller or longer then median value
Average may be little more then median value because in average oveall values are taken
in to show mean performance of variable. On other hand,median show trend that is in middle of
table. Hence, mean value will be slightly greater then median.
Question 3
(a)Mean of tumour size for all females
Table 1Mean across age groups
Less
than 40 17.81
40-60 15.93
Greater
then 60 15.71
Mean 16.48333
Mean value of tumour size is 16.84 across all age groups which means that on average
basis turmour size of mentioned value is observed in case of females. Mean value is computed
by using equation like 17.81+15.93+15.71/3=16.48.
(b)Age group having lowest coffecient of variation
Age group of greater then 60 have low cofficient of variation which is 6.59 for females
and 7.83 for males. In case of other age group value of deviaton is high which means that size of
tumour keeps on changing consistently at moderate or fast rate.
© Construction of interval
In order to compute confidence interval for male specific approach is followed. Mean
value of males that comes in age category of less then 40 is 18.29 and standard deviation is 7.92.
2*SD is equal to 7.92*2 which means value is 15.84. In order to compute condidence interval
this value will be added and subtracted from mean value which is 18.29. Thus, for lower
confidence interval value is 18.29-15.84= 2.45 and upper level is 18.29+15.84=34.13. Thus, at
95% confidence interval value lie in range of 2.45 to 34.13.
2 | P a g e
tabler-icon-diamond-filled.svg

Paraphrase This Document

Need a fresh take? Get an instant paraphrase of this document with our AI Paraphraser
Document Page
Question 4
(a)Histogram of FVC and AGE
3 | P a g e
Document Page
On evaluation, it can be observed that chart of age is not in bell shape and data is not normally
distributed. However, in case of FVC it is seen that data is normally distributed and can be used
for analysis purpose.
(b)Frequency distribution table
EXERCISE
Frequency Percent Valid Percent Cumulative
Percent
Valid 0 435 36.9 36.9 36.9
1 39 3.3 3.3 40.2
2 64 5.4 5.4 45.6
3 83 7.0 7.0 52.6
4 | P a g e
Document Page
4 52 4.4 4.4 57.0
5 78 6.6 6.6 63.6
6 52 4.4 4.4 68.1
7 377 31.9 31.9 100.0
Total 1180 100.0 100.0
© Scatter plot of FVC and age
Chart reflecting that there is strong relationship between FVC and age. This is reflected by
scatter plots or points that are closely matching with each other.
5 | P a g e
tabler-icon-diamond-filled.svg

Paraphrase This Document

Need a fresh take? Get an instant paraphrase of this document with our AI Paraphraser
Document Page
(d) FVC and exercise
There are outliers in case of no exercise, low exercise days and other options. In case of medium
exercise days and high exercise days FVC is almost equally distributed. Means that there are
different trends of FVC in case of medium, high exercise days and low exercise days.
( e) Count and median
Median FVC having Asthma but do not do exercise
FVC
Count Median
ASTHMA No EXERCISE No exercise days 403 2.90
Low exercise days 37 2.75
6 | P a g e
Document Page
Low exercise days 60 2.94
Meidum exercise days 76 2.80
Medium exercise days 50 3.00
High exercise days 73 3.30
6 50 3.30
7 353 3.10
Yes EXERCISE
No exercise days 32 2.45
Low exercise days 2 1.90
Low exercise days 4 1.85
Meidum exercise days 7 2.90
Medium exercise days 2 3.50
High exercise days 5 2.20
6 2 2.85
7 24 2.20
7 | P a g e
Document Page
Interpretation
Median FVC having Asthma but do not do exercise is 2.45 and count is 32 out of entire
sample size.
Median FVC have not Asthma but not do exercise
FVC
Count Median
ASTHMA
No EXERCISE
No exercise days 403 2.90
Low exercise days 37 2.75
Low exercise days 60 2.94
Meidum exercise days 76 2.80
Medium exercise days 50 3.00
High exercise days 73 3.30
High exercise days 50 3.30
High exercise days 353 3.10
Yes EXERCISE
No exercise days 32 2.45
Low exercise days 2 1.90
Low exercise days 4 1.85
Meidum exercise days 7 2.90
Medium exercise days 2 3.50
High exercise days 5 2.20
High exercise days 2 2.85
High exercise days 24 2.20
Interpretation
Median FVC have not Asthma but not do exercise is 2.90 and count is 403. This reflect
that those who are suffered from asthma mostly do exercise. In comparison to those who are not
suffered from asthma does not do exercise.
There is relationship between median FVC value and exercise group for each asthma
status. This is because median value of FVC reflect its medium range value for each category of
exercise that comes in class of asthma and non-asthma individuals. FVC value increase
consistently in case individual is not suffered from asthma and not doing or not doing exercise.
8 | P a g e
tabler-icon-diamond-filled.svg

Paraphrase This Document

Need a fresh take? Get an instant paraphrase of this document with our AI Paraphraser
Document Page
Whereas, in case individual suffered from asthma and not doing or doing moderate exercise level
of FVC fluctuate consistently.
(f) Bar chart of smoking group, asthma and exercise
Asthma classification for smoking category is similar in case of medium exercise days
across all categories. It can be said that asthma level does not differ whether smoking is or not.
9 | P a g e
Document Page
Facts are revealing that those who doing smoke and suffered from asthma do less exercise then
those who are not suffered from asthma and doing smoke. It can be said that there is difference
in terms of doing exericise among those that smoking and are or not suffered from asthma.
10 | P a g e
chevron_up_icon
1 out of 12
circle_padding
hide_on_mobile
zoom_out_icon
[object Object]