Introduction to Biostatistics Assignment 1: Analysis of Sydney Workers
VerifiedAdded on 2023/01/10
|10
|1714
|61
Homework Assignment
AI Summary
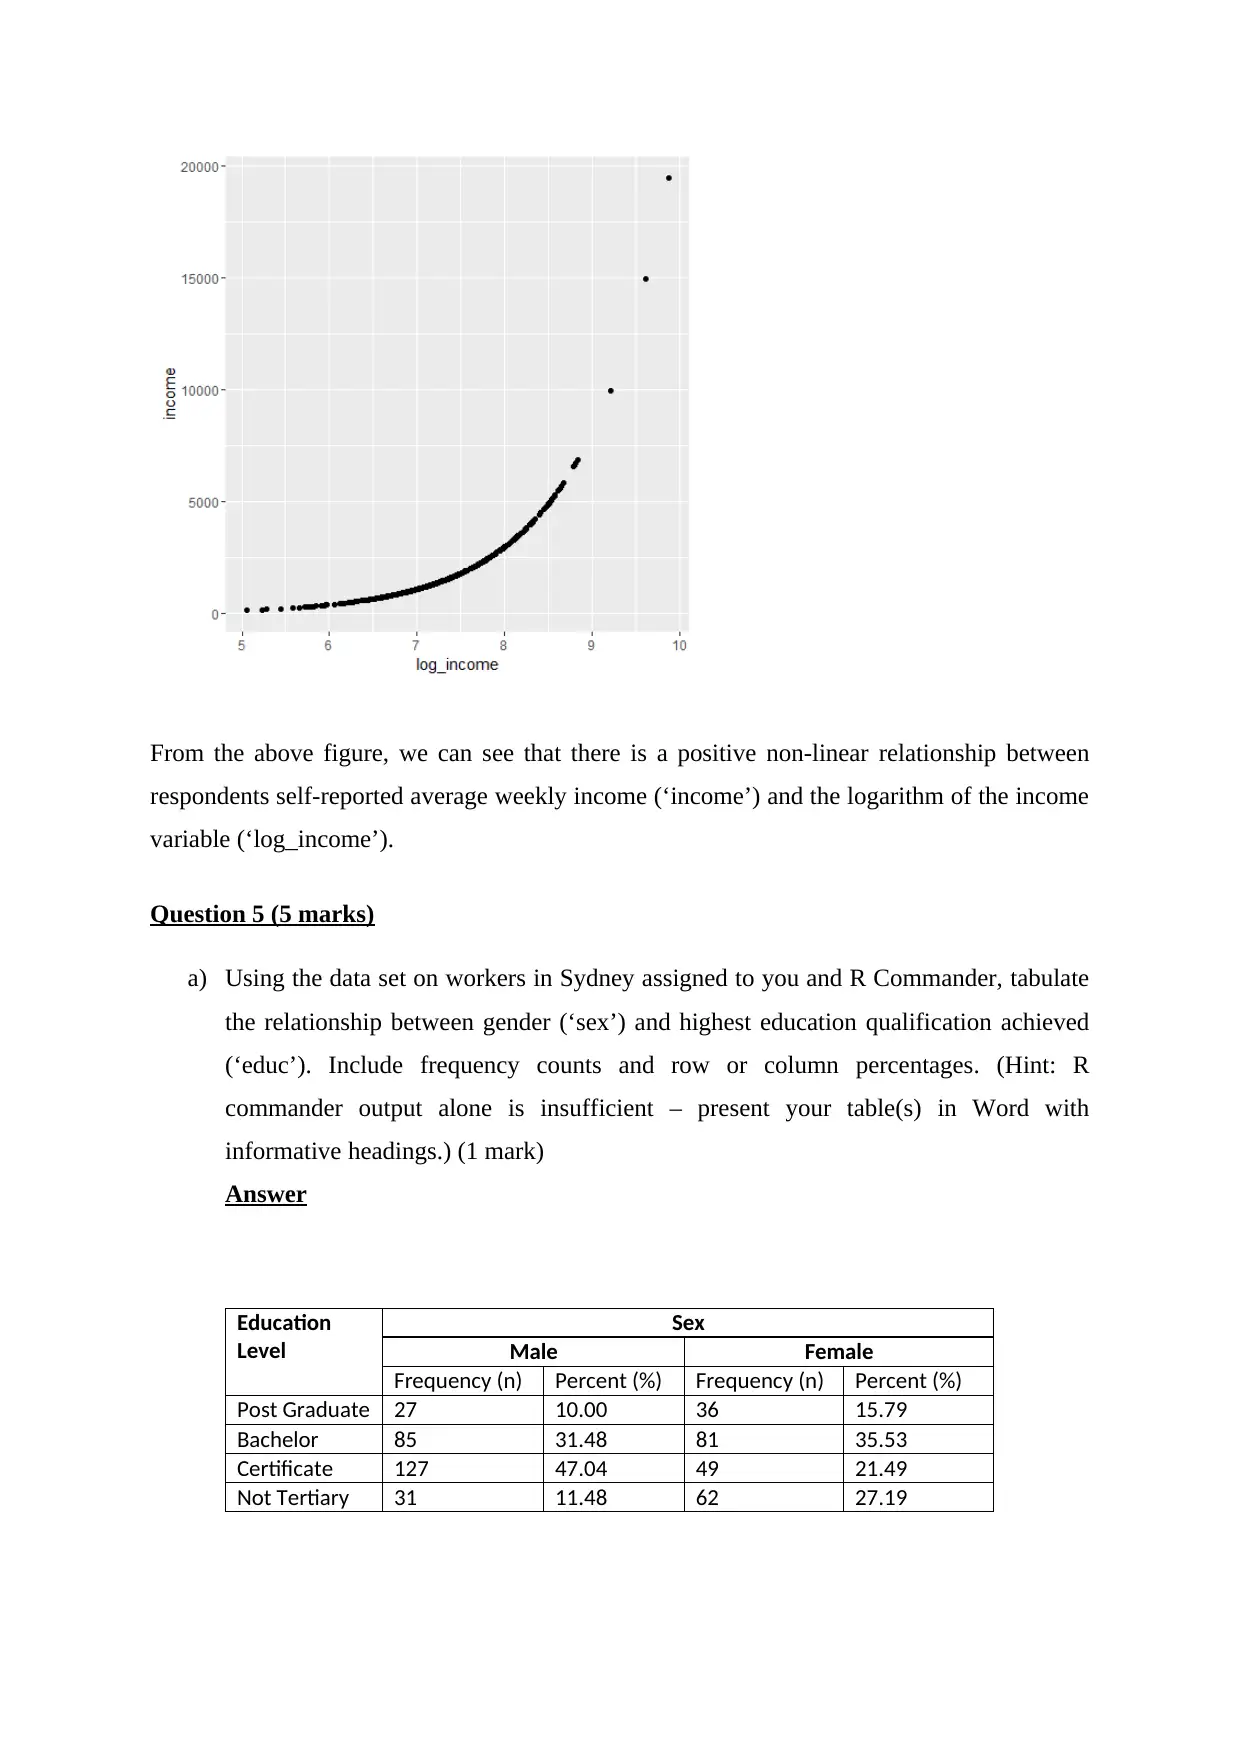
This assignment solution addresses a biostatistics assignment focused on analyzing a dataset of Sydney workers. The assignment covers identifying categorical variables, graphing and describing distributions (age, education), examining relationships between variables (income and log_income, gender and education), calculating probabilities (blood types, gender and education), and applying statistical concepts like z-scores and team means. The solution utilizes R Commander for data analysis and provides detailed answers to each question, including calculations and interpretations. The assignment assesses understanding of descriptive statistics, probability, and data analysis techniques relevant to biostatistics. The provided solution serves as a comprehensive guide for students studying biostatistics and preparing for similar assignments.
1 out of 10
Related Documents


Your All-in-One AI-Powered Toolkit for Academic Success.
+13062052269
info@desklib.com
Available 24*7 on WhatsApp / Email
![[object Object]](/_next/static/media/star-bottom.7253800d.svg)
Copyright © 2020–2026 A2Z Services. All Rights Reserved. Developed and managed by ZUCOL.