Biostatistics Semester 21A: Project 1 - Statistical Data Analysis

Verified

Added on  2023/06/18

|7
|1830
|397
Homework Assignment
AI Summary
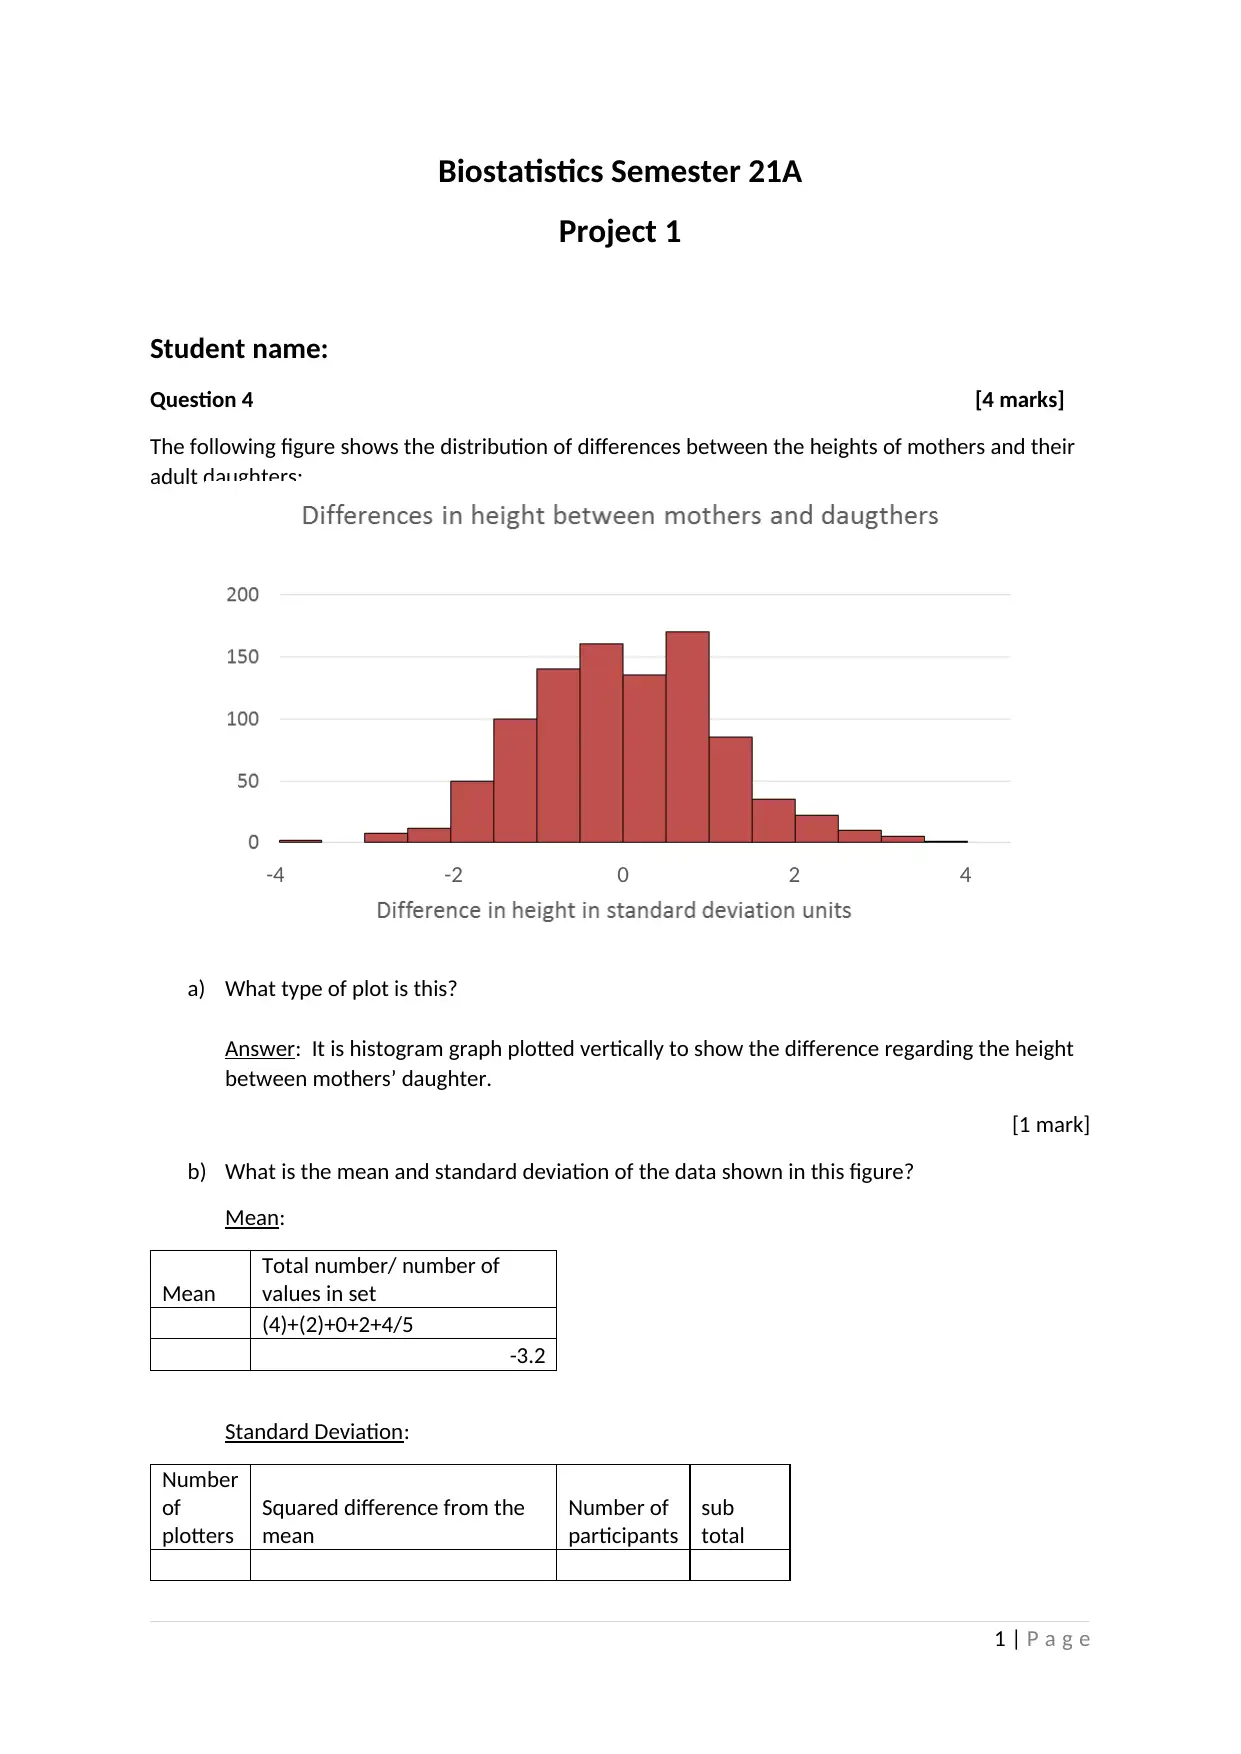
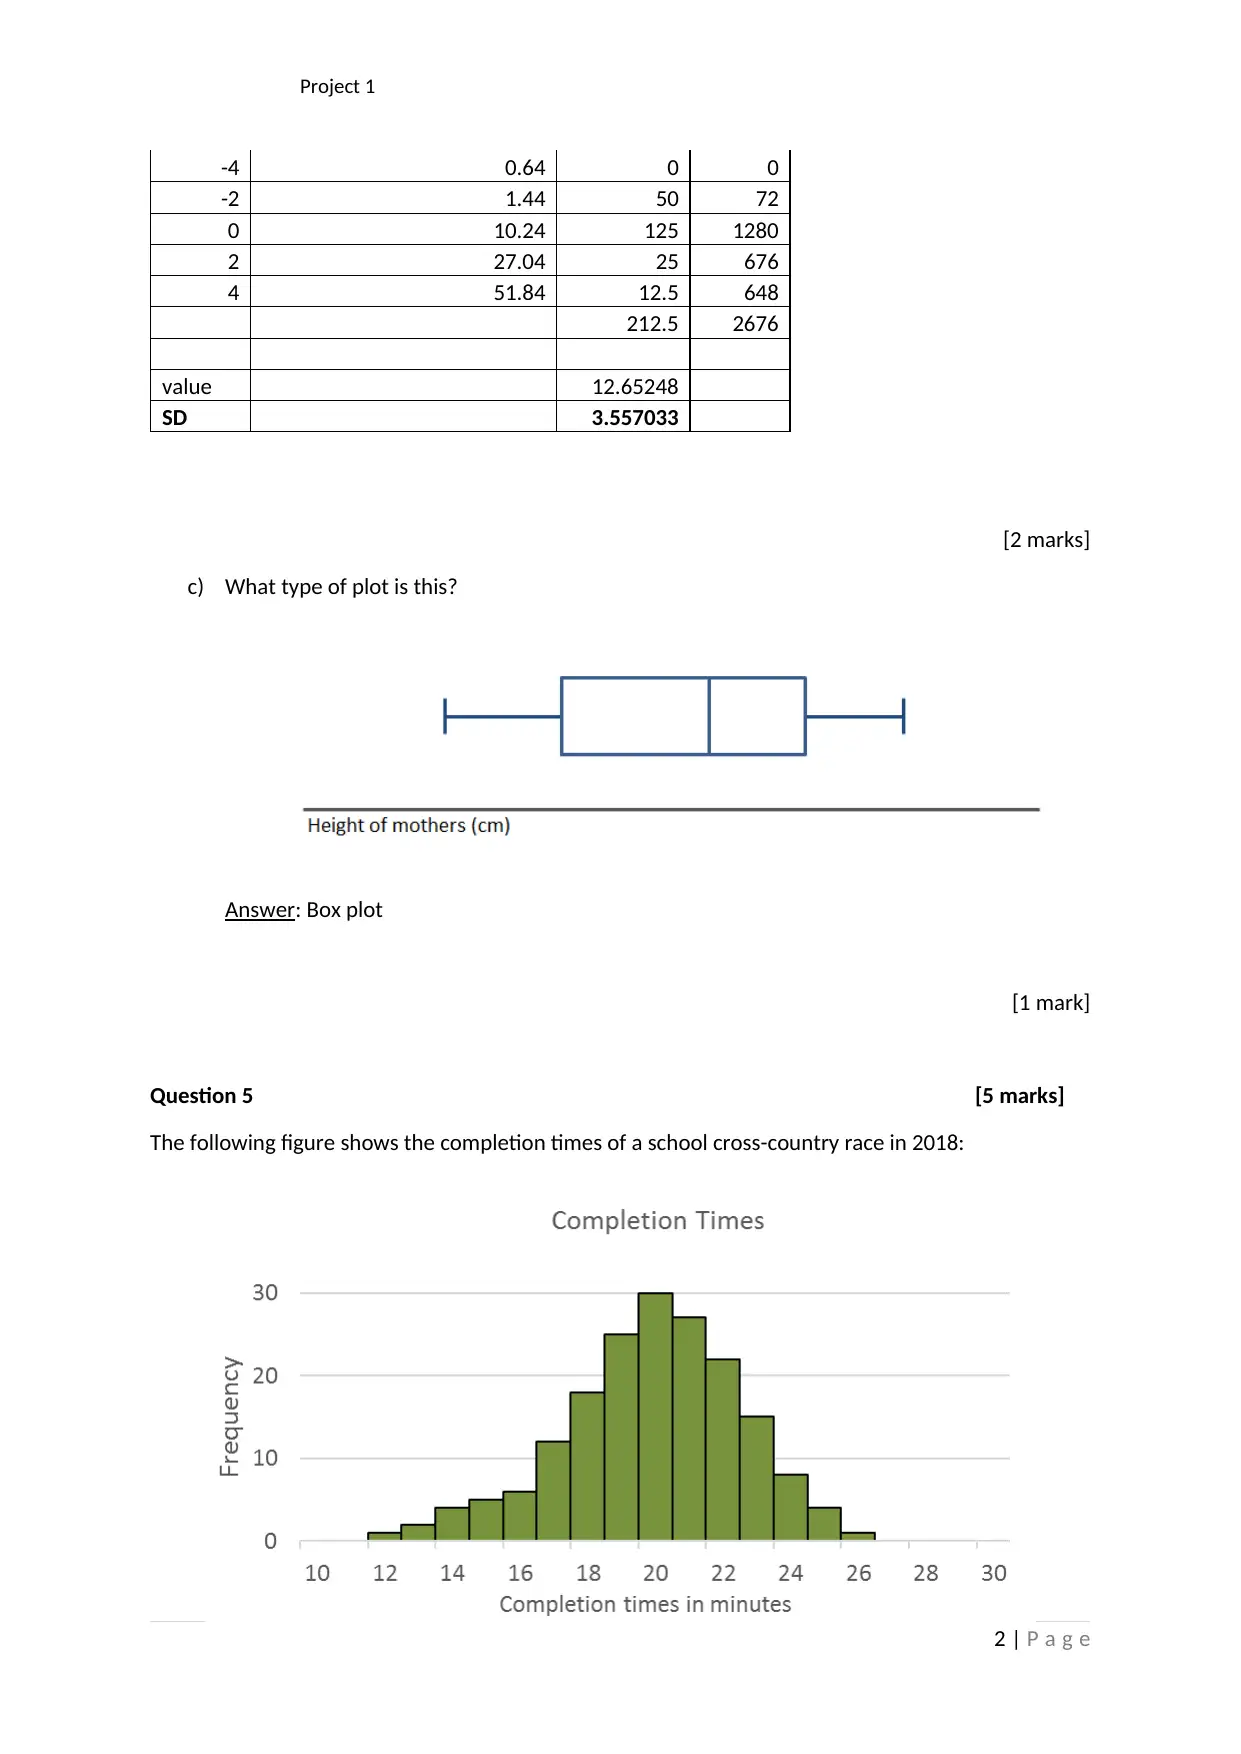
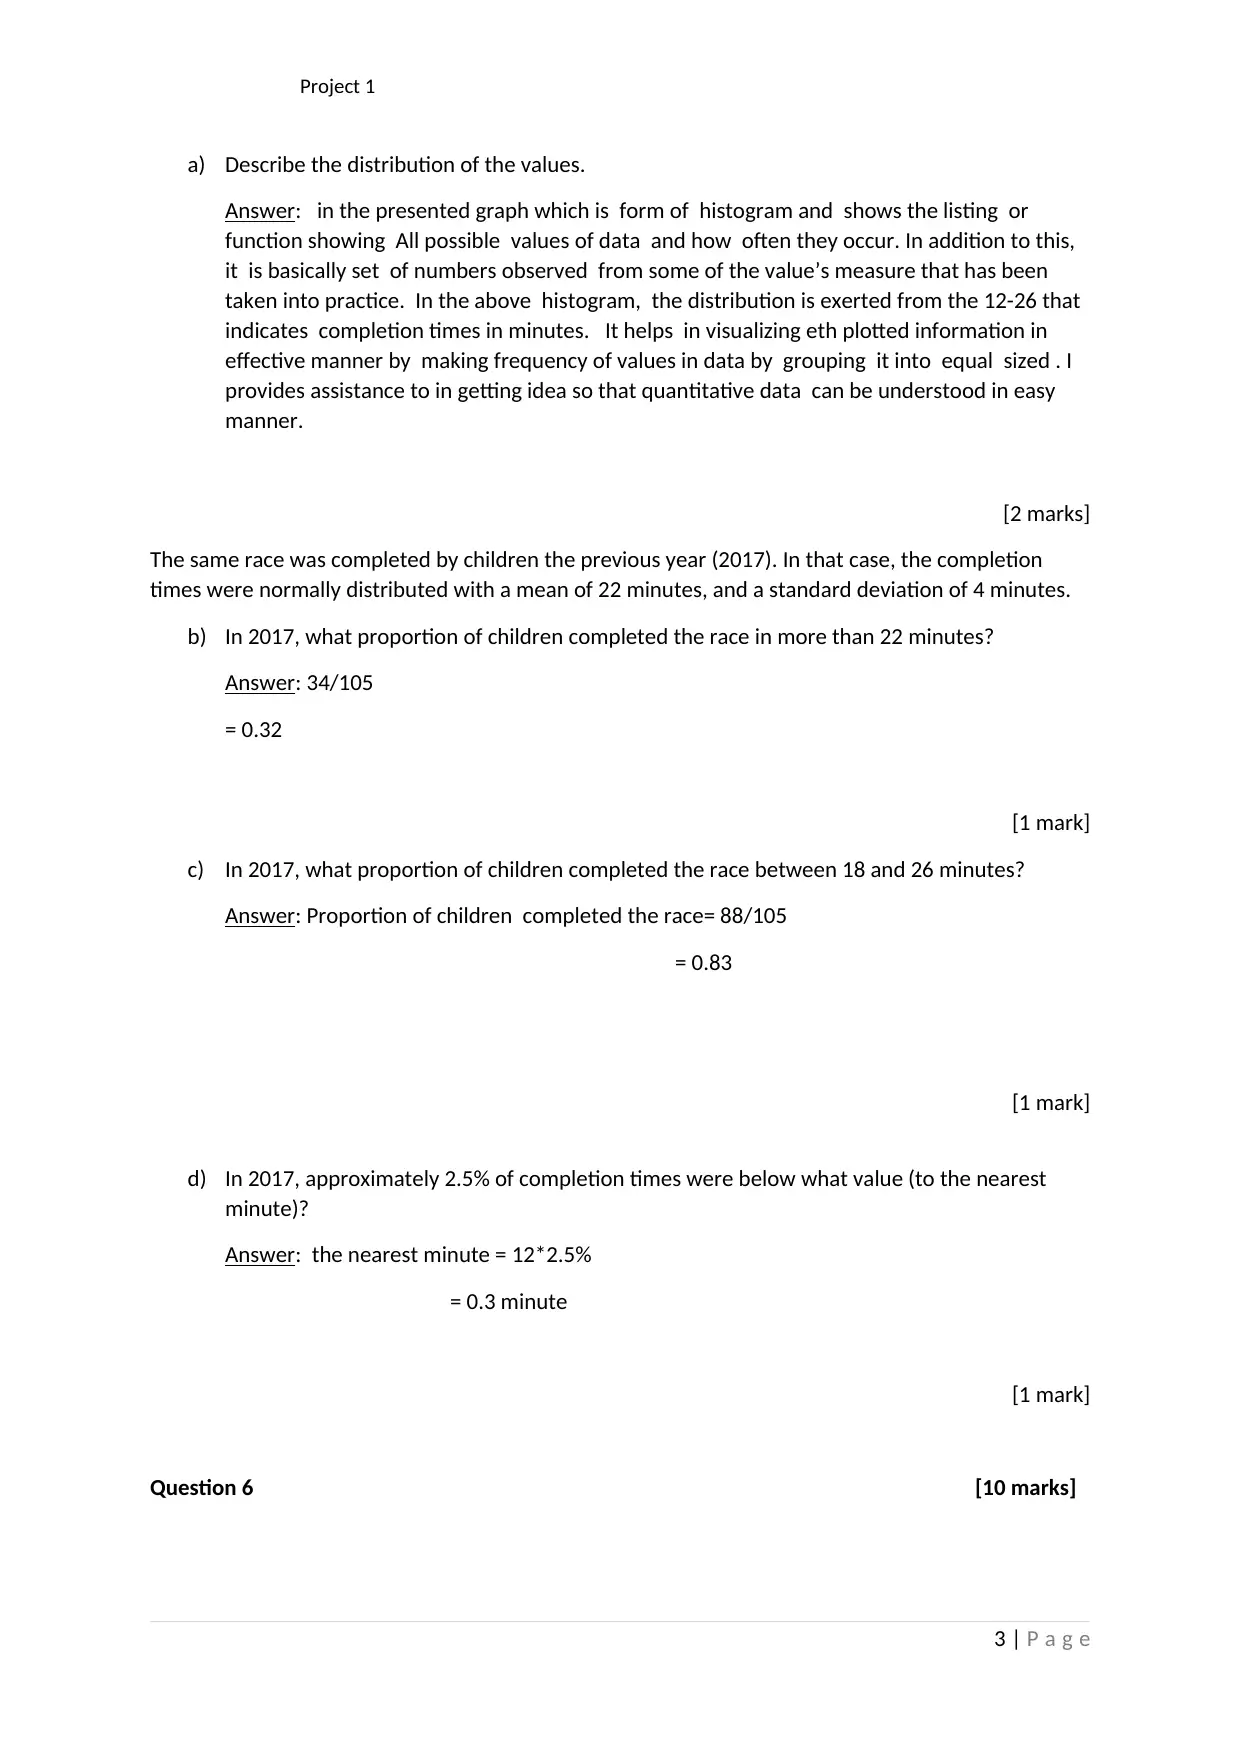
This Biostatistics assignment, Project 1 from Semester 21A, delves into statistical data analysis, covering a range of topics from identifying plot types and calculating descriptive statistics to hypothesis testing and probability analysis. The assignment includes questions involving histograms, box plots, mean and standard deviation calculations, and the application of statistical tests such as binomial tests and Z-scores. Specific scenarios, such as analyzing differences in mother-daughter heights, evaluating completion times in a cross-country race, and investigating the impact of educational programs on insecticide-treated net usage, are presented. The project also explores familial links in cholesterol levels and changes in polio vaccination rates, requiring students to calculate standard errors, confidence intervals, and interpret significance levels. Furthermore, it examines the association between Zika virus infection and birthweights, utilizing Z-scores for analysis. This comprehensive assignment provides a thorough assessment of biostatistical concepts and their practical applications.
Document Page
Biostatistics Semester 21A
Project 1
Student name:
Question 4 [4 marks]
The following figure shows the distribution of differences between the heights of mothers and their
adult daughters:
a) What type of plot is this?
Answer: It is histogram graph plotted vertically to show the difference regarding the height
between mothers’ daughter.
[1 mark]
b) What is the mean and standard deviation of the data shown in this figure?
Mean:
Mean
Total number/ number of
values in set
(4)+(2)+0+2+4/5
-3.2
Standard Deviation:
Number
of
plotters
Squared difference from the
mean
Number of
participants
sub
total
1 | P a g e
-4 -2 0 2 4
tabler-icon-diamond-filled.svg

Paraphrase This Document

Need a fresh take? Get an instant paraphrase of this document with our AI Paraphraser
Document Page
Project 1
-4 0.64 0 0
-2 1.44 50 72
0 10.24 125 1280
2 27.04 25 676
4 51.84 12.5 648
212.5 2676
value 12.65248
SD 3.557033
[2 marks]
c) What type of plot is this?
Answer: Box plot
[1 mark]
Question 5 [5 marks]
The following figure shows the completion times of a school cross-country race in 2018:
2 | P a g e
Document Page
Project 1
a) Describe the distribution of the values.
Answer: in the presented graph which is form of histogram and shows the listing or
function showing All possible values of data and how often they occur. In addition to this,
it is basically set of numbers observed from some of the value’s measure that has been
taken into practice. In the above histogram, the distribution is exerted from the 12-26 that
indicates completion times in minutes. It helps in visualizing eth plotted information in
effective manner by making frequency of values in data by grouping it into equal sized . I
provides assistance to in getting idea so that quantitative data can be understood in easy
manner.
[2 marks]
The same race was completed by children the previous year (2017). In that case, the completion
times were normally distributed with a mean of 22 minutes, and a standard deviation of 4 minutes.
b) In 2017, what proportion of children completed the race in more than 22 minutes?
Answer: 34/105
= 0.32
[1 mark]
c) In 2017, what proportion of children completed the race between 18 and 26 minutes?
Answer: Proportion of children completed the race= 88/105
= 0.83
[1 mark]
d) In 2017, approximately 2.5% of completion times were below what value (to the nearest
minute)?
Answer: the nearest minute = 12*2.5%
= 0.3 minute
[1 mark]
Question 6 [10 marks]
3 | P a g e
Document Page
Project 1
It is known that in a given population, 40% of people are regular users of insecticide-treated nets
(ITNs). One hundred people from this population attend an educational program, after which 52
report regular ITN use.
a) Using GraphPad (p59 of e-book) or any other software, calculate the probability that at least
52 out of the 100 people who underwent the educational program used an ITN regularly, if
they have the same probability of regular ITN use as the rest of the population.
Answer: Probability of number of people underwent in the educational program= 52/100
= 0.52
Probability of rest of population who did not go to the educational program = 48/100
= 0.48
[3 marks]
b) What can you conclude based on the above result?
Answer: From the above result it can be interpreted that in case of visited people in
educational program, there is 50-50 chances that the possible outcome will occur regular.
On the basis of this, it can be interpreted that result will tend to occur for the near future as
well which helps in understanding people’s consistency to underwent the educational
program used an ITN. On the other side, it can be identified that there is possibility of
occurring 0.48 people which will not went to ITN use as the rest of population.
[2 marks]
c) Is your conclusion above reached with certainty? Why or why not?
Answer: From the conclusion, it can be interpreted that certainty is associated with how
likely something is to happen. On the basis of above derived outcome, it can be articulated
that there is equal chances that, the mentioned population will underwent to educational
program. This can be taken as certain situation will tend to happen in near future as the
result is more than 0.5 that shows 50-50 chances of happening.
[2 marks]
d) You read two papers each describing the effects of educational programs on ITN use, and
comparing ITN use before and after the program. One found a significant increase in ITN use
(p=0.04) and the other found a significant decrease in ITN use (p=0.02). Suggest three
possible reasons for the different results.
Answer: The probability helps in understanding the situation that is shows occurrence of
random event. It can be articulated that the main reasons for changing the outcome is that
each person may have taken different perspective & method for computing the probability.
Another reason for the same can be articulated that there are few principles and rules
which need to apply for computing the same which may have been omitted or wrongly
interpreted. In addition to this, there are different types of probability which have been
used to measure increase & decrease that has outcome in different results.
[3 marks]
Question 7 [6 marks]
4 | P a g e
tabler-icon-diamond-filled.svg

Paraphrase This Document

Need a fresh take? Get an instant paraphrase of this document with our AI Paraphraser
Document Page
Project 1
Large-scale studies suggest the mean blood cholesterol level in children aged 10 to 14 years is 150
mg/dL (standard deviation 30 mg/dL). In order to determine if cholesterol levels have a familial link,
you identify 100 men who have high cholesterol [designated “high-risk”] and have a child aged 10-14
years, and measure the cholesterol level in the child.
You find that the mean cholesterol level of the 100 children is 170 mg/dL.
a) What is (i) the standard error and (ii) 95% confidence interval for the average cholesterol
level for children with high-risk fathers? (Please show any formulas you are using.)
Answer:
i) Standard error = SD/ SQRT of n
= 30/10
= 3
ii) confidence interval for the average cholesterol level for children with high-risk
fathers= ± z* σ / (√n)
= 170±0.05(30/ √100)
= 170±0.05 *3
= 170+0.15 or 170-0.15
= 170.15 or 169.85
[4 marks]
b) Can you reject the null hypothesis that the average cholesterol level for children with high-
risk fathers is 150 mg/dL? Explain your choice.
Answer: It is null hypothesis as it is less than average data that why it will be rejected.
[2 marks]
Question 8 [8 marks]
You are investigating whether polio vaccination rates have changed over a 10-year period in a
particular country. You obtain a random sample of 60 districts in the country, and find that the
vaccination rate has decreased in 20 of them, and increased in 40 of them. (There were no districts
in which the vaccination rate had not changed.)
a) What proportion of observed districts showed an increase in vaccination rates?
Answer: Probability of an increase in vaccination rates = district with increase in the country
vaccination rate / Total number of sample
= 40/60
= 2/3 or 0.66
[1 mark]
5 | P a g e
Document Page
Project 1
b) Assuming across the country there had been no real change in vaccination rates over the 10-
year period, what would be the probability of observing a district with a positive change?
Answer: 1/40 = 0.025
[1 mark]
c) Using a binomial test, you find the probability of observing 40 or more positive changes (or
20 or fewer negative changes), when the true vaccination rate has not changed, is 0.0135.
What can you conclude about the change in vaccination rates?
Answer: On the basis of shown result it can be articulated that derived outcome is closer to
the zero which indicates that there is small chance that specific event will occur. In addition
to this, it can be stated that there is less possibility that more positive changes than 40 and
fewer than 20 in negative perspective will occur.
[2 marks]
d) What is the observed significance level for the test that the vaccination rate has not
changed?
Answer: The observed significance level = 20/60 = 1/3 = 0.33
[1 mark]
e) If you had only observed 6 districts, and found that 4 had a positive change and 2 had a
negative change, would you expect to draw the same conclusions as when you observed 60
districts with a similar pattern? Explain your choice.
Answer: Yes, the same conclusion will be drawn hen the observed district pattern of 60
change. The main reason behind this is associated with the fact of mathematics that there
will be same fraction will obtained while computing results.
[2 marks]
f) Are your observed results possible if there has not been a change in vaccination rates in the
country’s population? [Yes or No]
Answer: Yes
[1 mark]
Question 9 [3 marks]
Zika virus infection in pregnant women is associated with microcephaly (small head) in the baby,
although this only occurs in a small proportion of cases. You want to investigate whether babies
born to Zika-infected mothers, who do not have microcephaly, still have a lower birthweight. A
6 | P a g e
Document Page
Project 1
sample of 100 non-microcephalic babies from Zika-infected mothers shows the average birthweight
to be 2500 grams.
It is known that in the population, the average birthweight of all babies is 3000 grams (standard
deviation = 500 grams), and is normally distributed.
a) Calculate a Z score for your sample birthweight of 2500 grams. Indicate the formula you use
and show your working.
Answer:
z = (x-μ)/σ
= (2500-3000)500
= -500/500
Z =- 1
[3 marks]
7 | P a g e
chevron_up_icon
1 out of 7
circle_padding
hide_on_mobile
zoom_out_icon
[object Object]