Biostatistics in Healthcare Research: Homework Solutions

Verified

Added on  2022/09/12

|10
|1028
|23
Homework Assignment
AI Summary
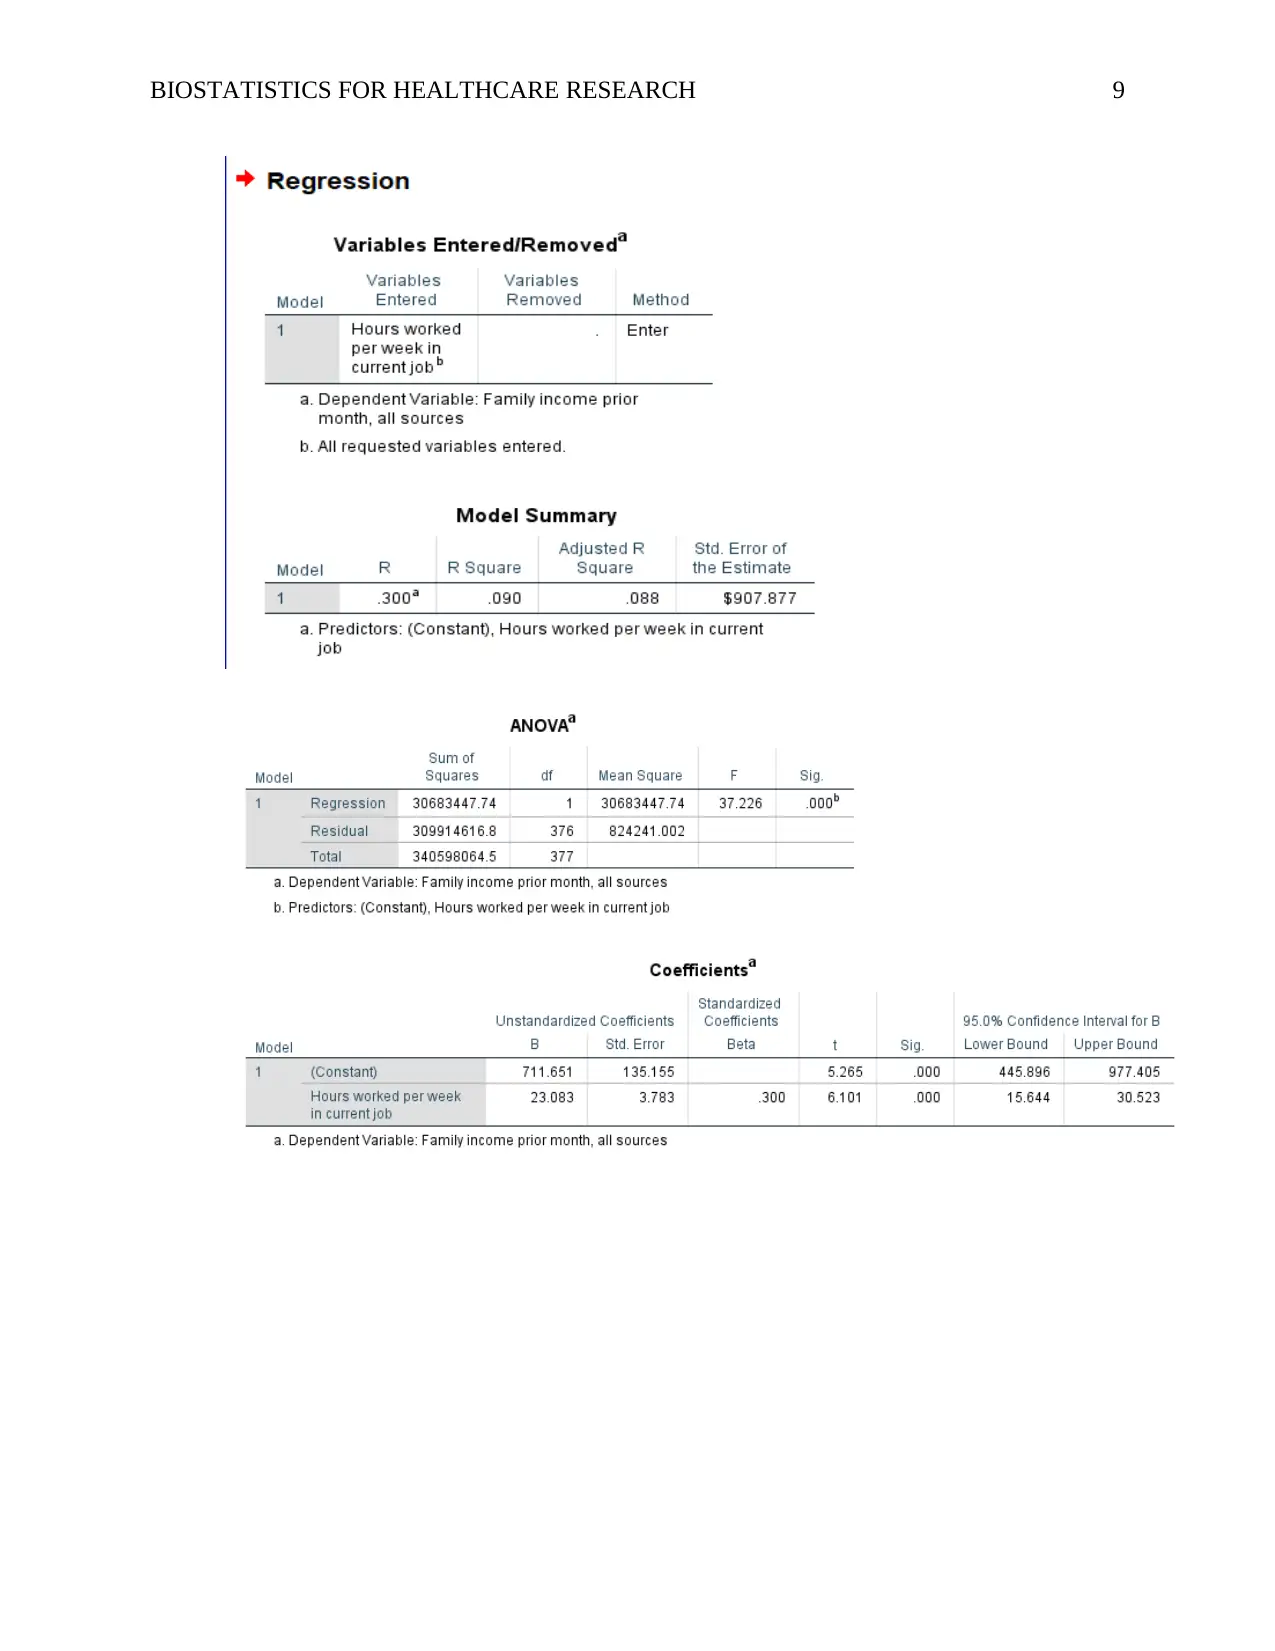
This assignment focuses on biostatistics within the context of healthcare research, addressing key concepts such as statistical significance, correlation, and regression analysis. The solution meticulously examines scenarios with varying sample sizes and correlation coefficients to determine statistical significance, including one and two-tailed tests. It explores how sample restrictions and outliers can affect correlation values. The assignment also delves into power analysis, type II errors, and the calculation of required sample sizes for replication studies. Furthermore, it presents an analysis of real-world data, including SPSS outputs, to interpret the relationships between variables like hours worked, family income, and educational attainment. The solution includes regression equations, predicted values, and a comprehensive understanding of variance explained by the model, offering a thorough exploration of biostatistical methods in healthcare research.
tabler-icon-diamond-filled.svg

Contribute Materials

Your contribution can guide someone’s learning journey. Share your documents today.
Document Page
Running head: BIOSTATISTICS FOR HEALTHCARE RESEARCH 1
Biostatistics for Healthcare Research
Student Name
Professor’s Name
University Name
Date
tabler-icon-diamond-filled.svg

Secure Best Marks with AI Grader

Need help grading? Try our AI Grader for instant feedback on your assignments.
Document Page
BIOSTATISTICS FOR HEALTHCARE RESEARCH 2
Biostatistics for Healthcare Research
Solutions
Question 1
To determine whether the calculated values of r statistically significant when:
a. R=0.29, N=35, =0.01, two tailed.
HO : ρ=0
H1 : ρ 0
Where ρ corresponds to the population correlation (Fowler, 2009). The degrees of
freedom are:
df =n2
df =352=33
The critical correlation value rc for the given significance level and two-tailed test is:
rc=0.43
The null hypothesis will be rejected if |r|> rc=0.43
In this case, |r|=0.29<r c=0.43, hence the r value is not statistically significant.
b. R=0.50, N=15, =0.05, two tailed.
HO : ρ=0
H1 : ρ 0
Where ρ corresponds to the population correlation. The degrees of freedom are:
df =n2
df =152=13
The critical correlation value rc for the given significance level and two-tailed test is:
rc=0.514
Document Page
BIOSTATISTICS FOR HEALTHCARE RESEARCH 3
The null hypothesis will be rejected if |r|> rc=0.514
In this case, |r|=0.5< rc=0.514, hence the r value is not statistically significant.
c. R=0.12, N=500, =0.05, two tailed.
HO : ρ=0
H1 : ρ 0
Where ρ corresponds to the population correlation. The degrees of freedom are:
df =n2
df =5002=498
The critical correlation value rc for the given significance level and two-tailed test is:
rc=0.088
The null hypothesis will be rejected if |r|> rc=0.088
In this case, |r|=0.12>r c=0.088, hence the r value is statistically significant.
d. R=0.55, N=12, =0.05, one tailed.
HO : ρ=0
H1 : ρ>0
Where ρ corresponds to the population correlation. The degrees of freedom are:
df =n2
df =122=10
The critical correlation value rc for the given significance level and one-tailed test is:
rc=0.497
The null hypothesis will be rejected if r >r c=0.497
In this case, r =0.55>rc=0.497, hence the r value is statistically significant.
Document Page
BIOSTATISTICS FOR HEALTHCARE RESEARCH 4
e. R=0.44, N=26, =0.01, one tailed.
HO : ρ=0
H1 : ρ>0
Where ρ corresponds to the population correlation. The degrees of freedom are:
df =n2
df =262=24
The critical correlation value rc for the given significance level and one-tailed test is:
rc=0.453
The null hypothesis will be rejected if r >r c=0.453
In this case, r =0.44<r c=0.453, hence the r value is not statistically significant.
Question 2
The random sample size =100 people, the correlation is -0.21. The likely effect on the absolute
value of the correlation coefficient under the following circumstances is:
a. When the sample is restricted to people who weighed less than 180 pounds, the value of
r is likely to be smaller since the deviation from the mean will be small (Pilot, 2010).
b. When the sample is restricted to people who get virtually no daily exercise versus those
who exercise at least 30 minutes a day, the value of r is likely to be larger because of
the increase in the deviation from the mean.
c. When sample weight is 150 pounds, and one person is added to the sample who weighs
275 pounds, the R-value is likely to be larger because the weight added would acts as
an outlier which could possibly cause a higher deviation from the mean.
tabler-icon-diamond-filled.svg

Secure Best Marks with AI Grader

Need help grading? Try our AI Grader for instant feedback on your assignments.
Document Page
BIOSTATISTICS FOR HEALTHCARE RESEARCH 5
Question 3
The sample size =75 primiparas, the correlation is 0.19, alpha value=0.05.
The estimated power of the statistical test is one minus the probability of conducting type II error
for =0.05, sample size n=75 and Zc=1.96. The effect size d=0.19 (Selvanathan & Keller,
2017)
β= pr ( Fail¿reject a false null hypothesis)
β=Pr (Zcd n Z Zcd n)
β=Pr (1.960.19 75 Z 1.960.19 75)
β=0.62340.0002=0.6233 0.6
power=1β
power=10.6
power=0.4
Conversely, the risk that a type II error was committed is 60% and is represented by the beta
value (Freund, 2014).
β=0.6
β=60 %
If 0.19 is a good estimation of the population correlation, the sample size that would be needed
in a replication study to achieve power =0.80 at α=0.05 is about 218.
Question 4
a. The range of Ns for the variables in the analysis is from 425 for the hours worked per
week in the current job to 989 for the highest school grade completed.
b. The highest correlation coefficient in the matrix is 0.03 and its statistically significant at a
p-value level of 0.01. It indicates a weak positive linear relationship between the number
Document Page
BIOSTATISTICS FOR HEALTHCARE RESEARCH 6
of hours worked per week in the current job and family income prior month for all
sources (Hinton, 2014).
c. The weakest correlation coefficient in the matrix is 0.02. It is not statistically significant
any p-value level. It indicates a very weak positive linear relationship between age at
birth and the number of hours worked per week in the current job (Shao, 2010).
d. The percent of variance that age at first birth share with highest grade completed is given
by:
variance=σ2
variance=0.1792
variance=0.032 3.2 %
variance=3.2 %
e. The percent of variance that weekly hours worked share with household income is given
by:
variance=σ2
variance=0.32
variance=0.09 9 %
variance=9 %
f. The SPSS outputs are shown below:
Document Page
BIOSTATISTICS FOR HEALTHCARE RESEARCH 7
Question 5
a. The values of r2 and adjusted r2 are 0.09 and 0.088 respectively.
r2=0.09
adjusted r2=0.088
b. The regression sum of squares and the total sum of squares in this analysis are:
SSregression=30683447.74
tabler-icon-diamond-filled.svg

Paraphrase This Document

Need a fresh take? Get an instant paraphrase of this document with our AI Paraphraser
Document Page
BIOSTATISTICS FOR HEALTHCARE RESEARCH 8
SSTotal=340598064.5
The value of SSregression divided by SSTotal is
30683447.737
340598064.5 =0.09
The division value above represents the proportion of variance that is shared by the
variables used in the regression model.
c. The intercept constant and the slope in the in this regression are:
Intercept constant=711.651
Slope=23.083
d. The regression equation for predicting new values of family income is:
Y =23.083 x +711.651
Where Y is family income and x is hours worked.
e. The predicted monthly family income for women working 35hours per week using the
regression equation is:
Y =23.083(35)+ 711.651
Y =$ 1519.56
f. The SPSS output is attached below
Document Page
BIOSTATISTICS FOR HEALTHCARE RESEARCH 9
Document Page
BIOSTATISTICS FOR HEALTHCARE RESEARCH 10
References
Fowler, F. (2009). Survey research methods. Thousand Oaks, Calif.: Sage.
Freund, J. E. (2014). Modern elementary statistics (12th ed). Boston: Pearson.
Hinton, P. R. (2014). Statistics explained (3rd ed). London: Routledge, Taylor & Francis Group.
Polit, D. F. (2010). Statistics and Data Analysis for Nursing Research (2nd ed.). Upsadle River,
NJ: Pearson.
Selvanathan, E. A., & Keller, G. (2017). Business statistics abridged (7th ed). South Melbourne,
Victoria: Cengage Learning.
Shao, J. (2010). Mathematical statistics (2nd ed). New York: Springer.
chevron_up_icon
1 out of 10
circle_padding
hide_on_mobile
zoom_out_icon
logo.png

Your All-in-One AI-Powered Toolkit for Academic Success.

Available 24*7 on WhatsApp / Email

[object Object]