Biostatistics Homework: Analysis of Drug Use and Dietary Fat

Verified

Added on  2021/06/17

|7
|700
|57
Homework Assignment
AI Summary
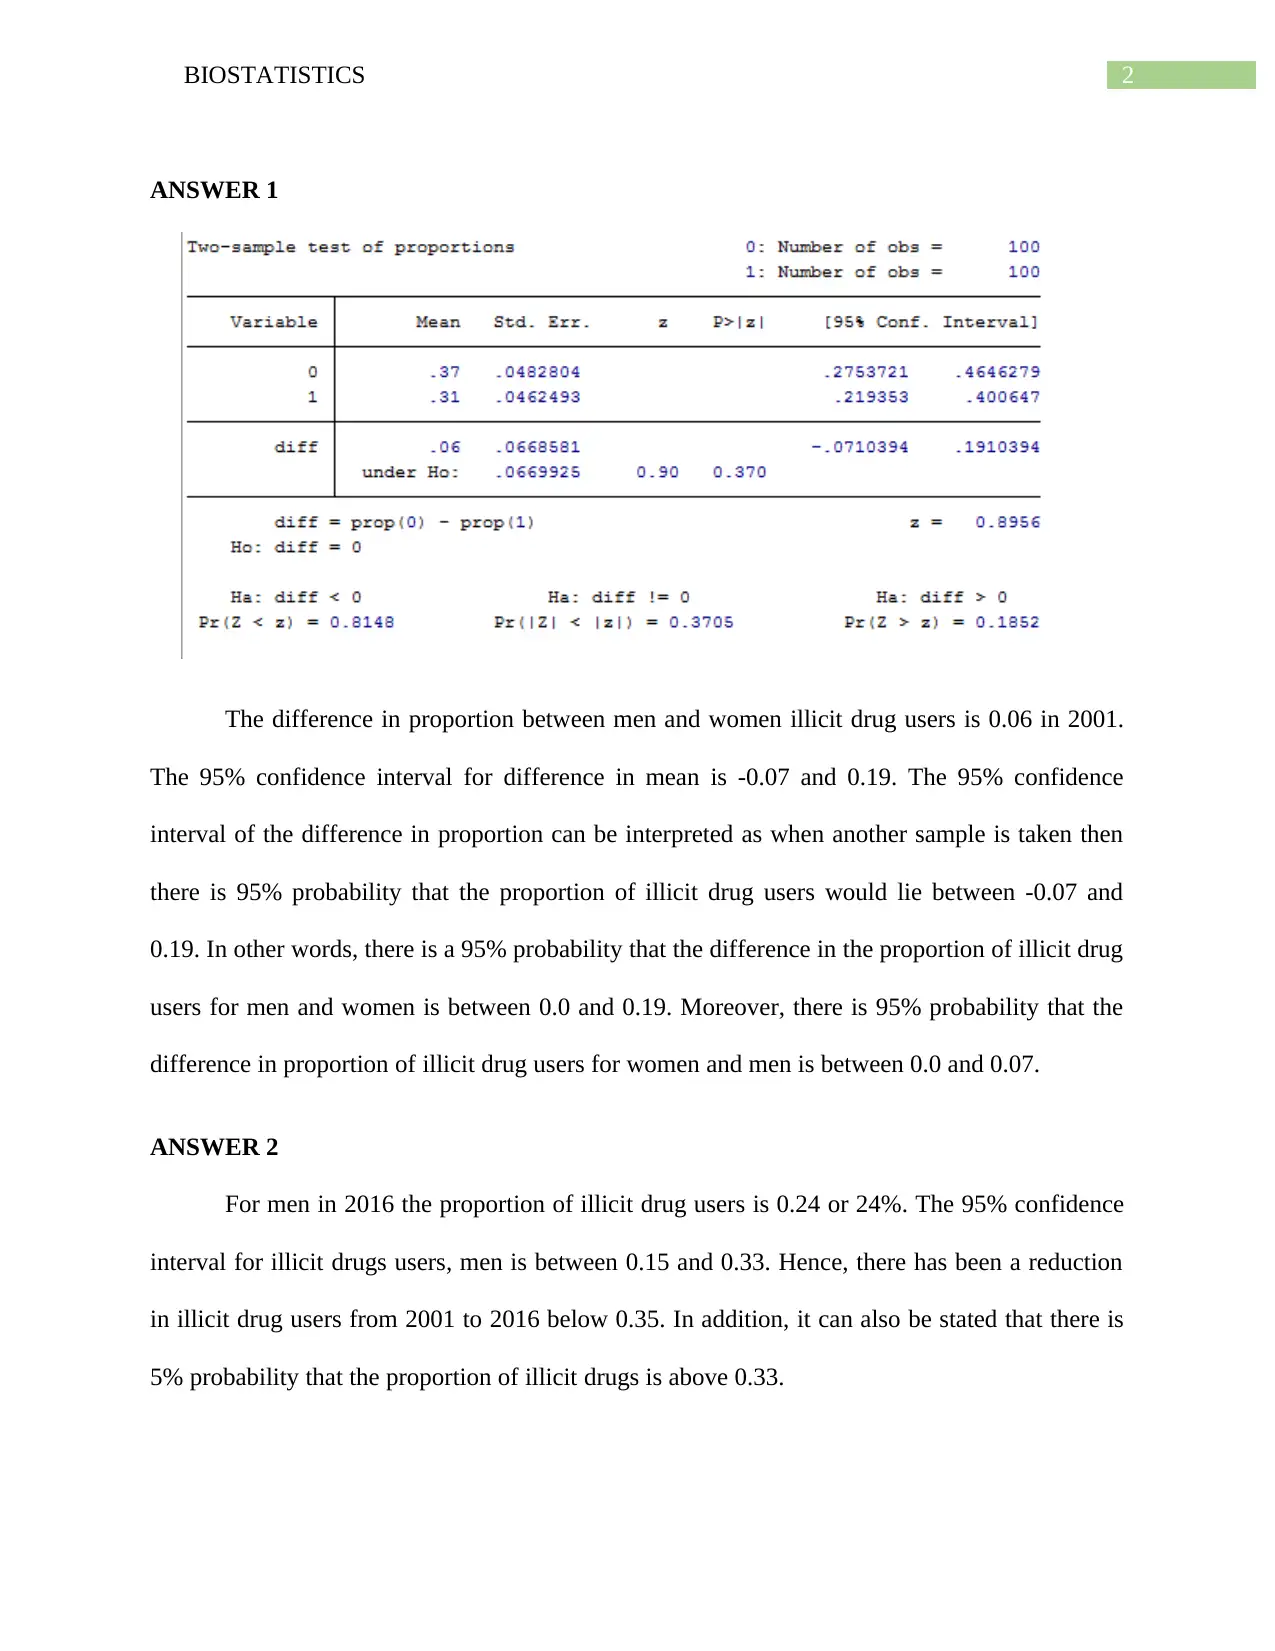
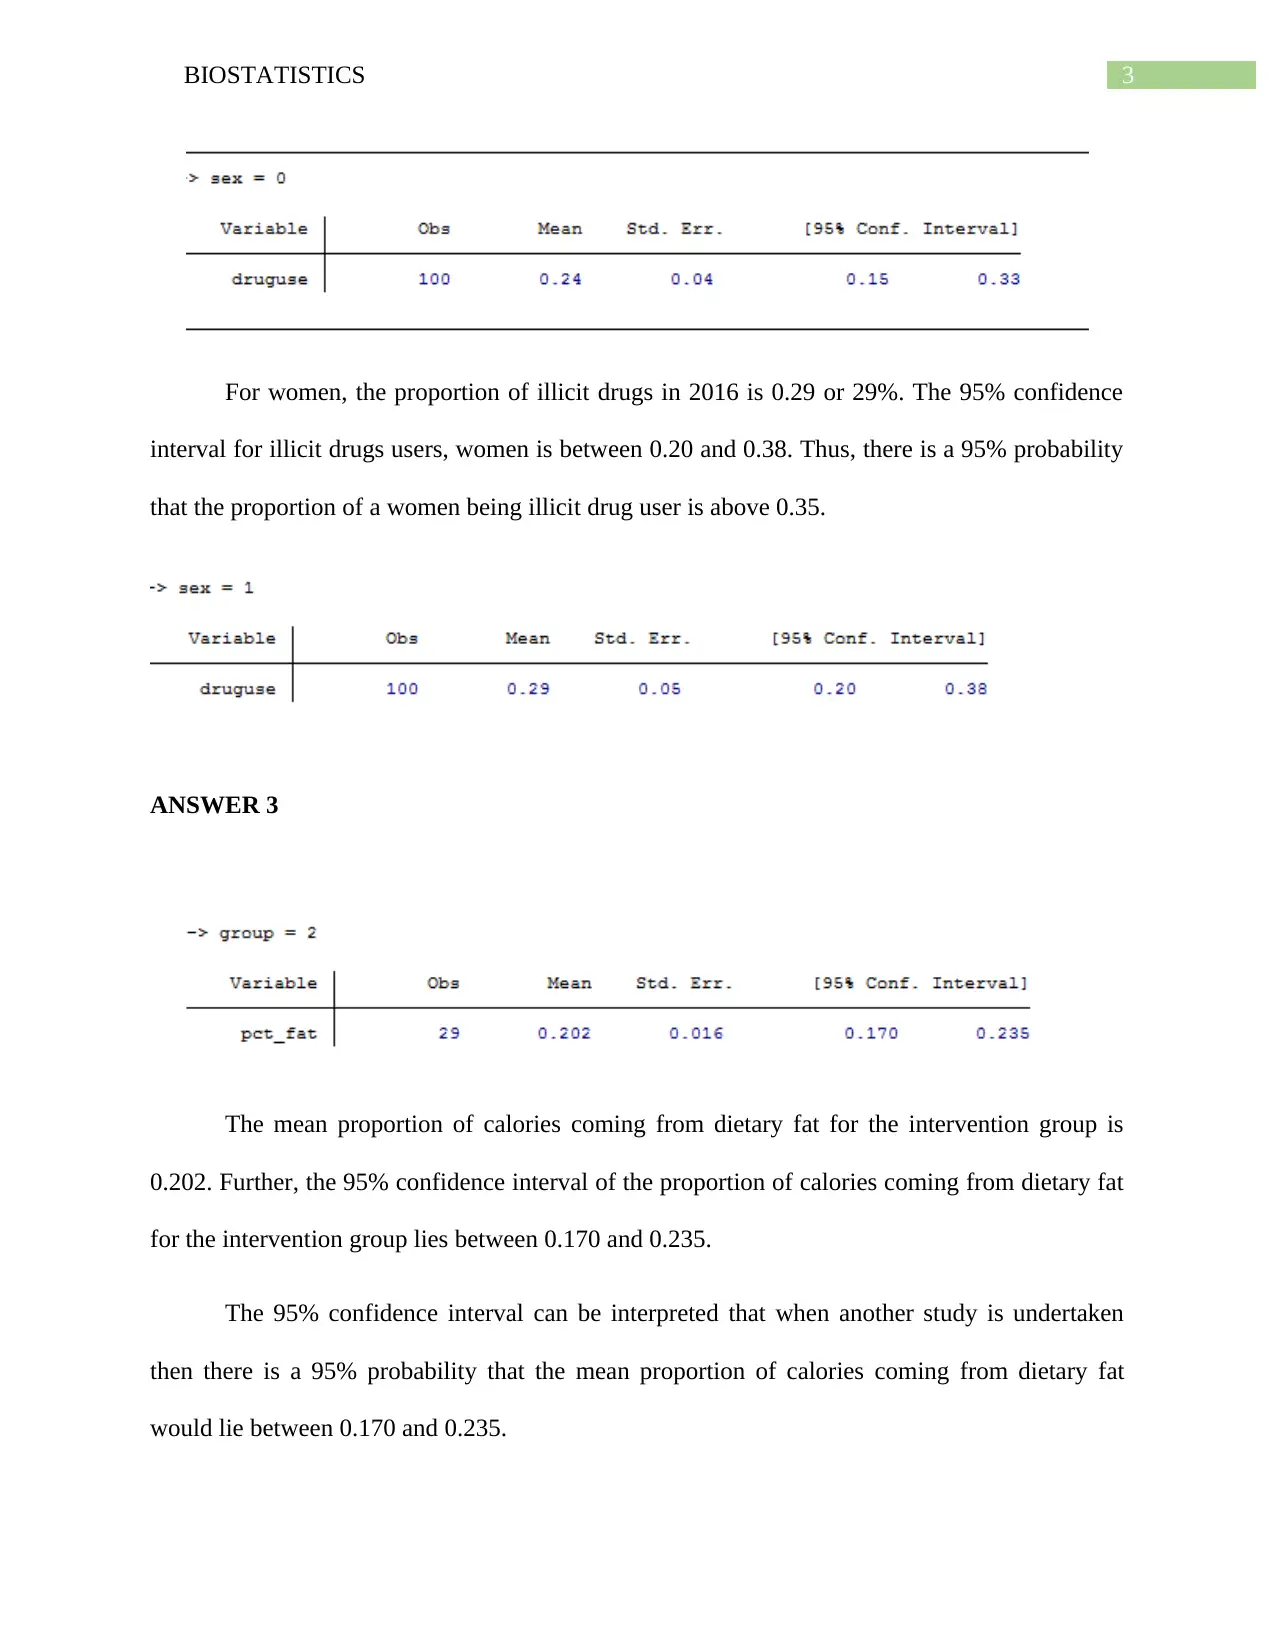
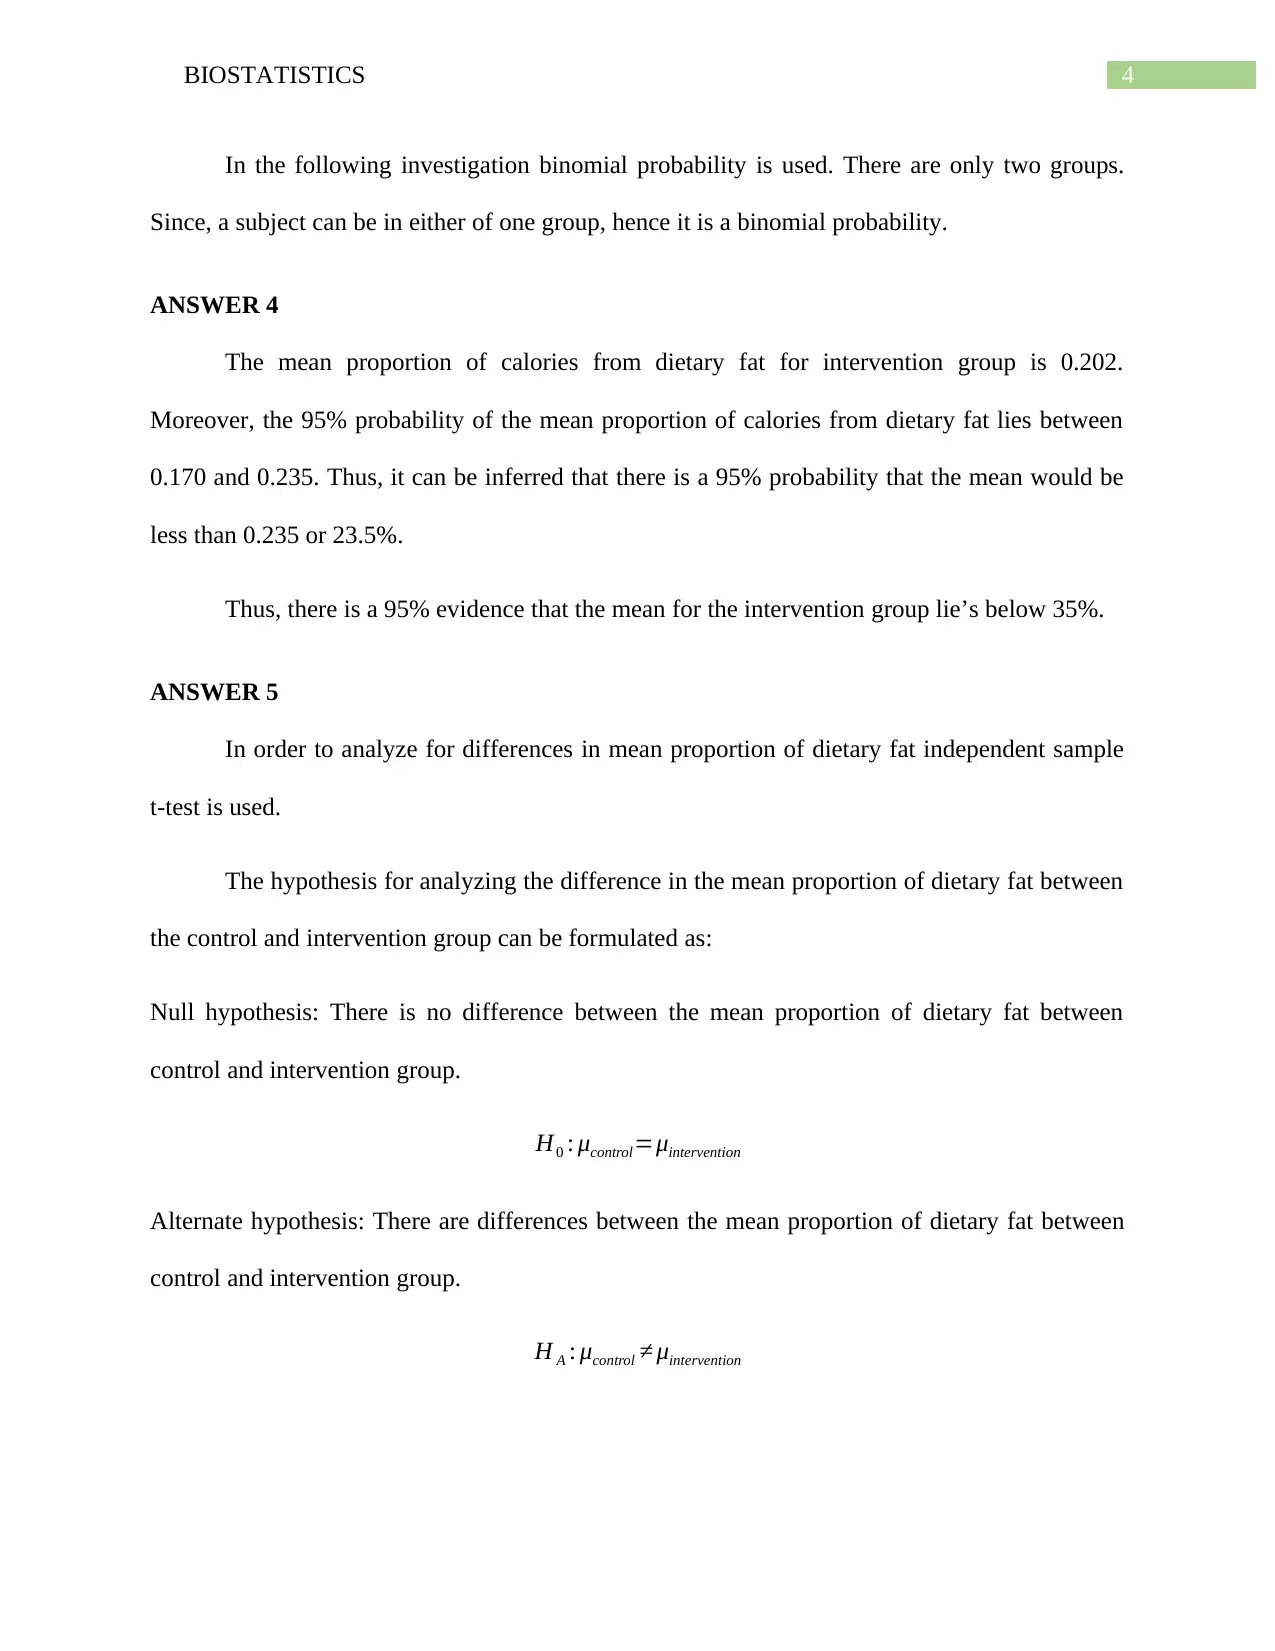
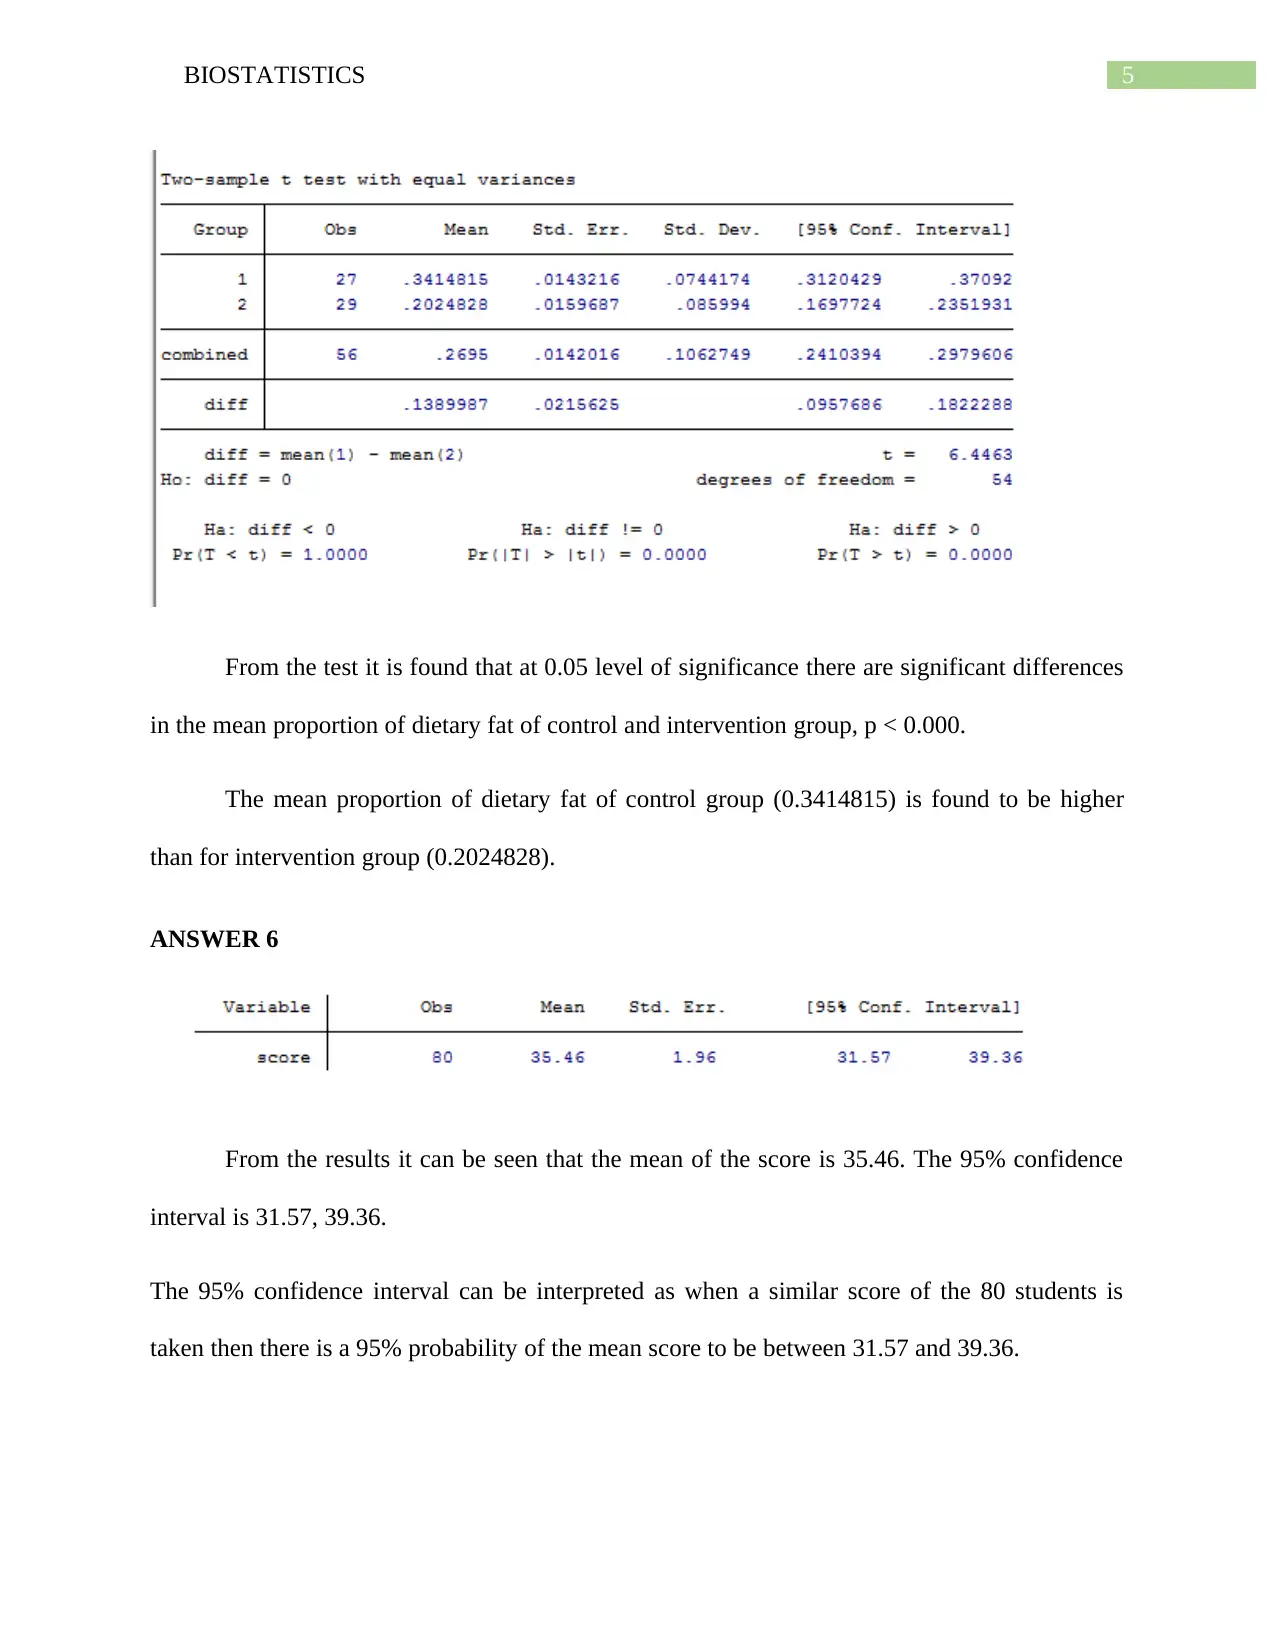
This biostatistics assignment provides solutions to several key statistical problems. The assignment analyzes the difference in proportion of illicit drug users between men and women using confidence intervals, interpreting the probability of differences in proportions. It also examines the proportion of illicit drug users in 2016 for both genders and provides confidence intervals. Furthermore, it explores the mean proportion of calories from dietary fat in an intervention group, including the interpretation of the confidence intervals and the use of binomial probability. The assignment also uses independent sample t-tests to analyze the differences in the mean proportion of dietary fat between control and intervention groups, formulating null and alternative hypotheses and interpreting the p-values. Finally, it presents the mean score and confidence interval of a test, explaining its interpretation.
Document Page
Running Head: BIOSTATISTICS
Biostatistics
Name of the Student
Name of the University
Author Note
tabler-icon-diamond-filled.svg

Paraphrase This Document

Need a fresh take? Get an instant paraphrase of this document with our AI Paraphraser
Document Page
1BIOSTATISTICS
Table of Contents
ANSWER 1.....................................................................................................................................2
ANSWER 2.....................................................................................................................................5
ANSWER 3.....................................................................................................................................7
ANSWER 4...................................................................................................................................10
ANSWER 5...................................................................................................................................13
Document Page
2BIOSTATISTICS
ANSWER 1
The difference in proportion between men and women illicit drug users is 0.06 in 2001.
The 95% confidence interval for difference in mean is -0.07 and 0.19. The 95% confidence
interval of the difference in proportion can be interpreted as when another sample is taken then
there is 95% probability that the proportion of illicit drug users would lie between -0.07 and
0.19. In other words, there is a 95% probability that the difference in the proportion of illicit drug
users for men and women is between 0.0 and 0.19. Moreover, there is 95% probability that the
difference in proportion of illicit drug users for women and men is between 0.0 and 0.07.
ANSWER 2
For men in 2016 the proportion of illicit drug users is 0.24 or 24%. The 95% confidence
interval for illicit drugs users, men is between 0.15 and 0.33. Hence, there has been a reduction
in illicit drug users from 2001 to 2016 below 0.35. In addition, it can also be stated that there is
5% probability that the proportion of illicit drugs is above 0.33.
Document Page
3BIOSTATISTICS
For women, the proportion of illicit drugs in 2016 is 0.29 or 29%. The 95% confidence
interval for illicit drugs users, women is between 0.20 and 0.38. Thus, there is a 95% probability
that the proportion of a women being illicit drug user is above 0.35.
ANSWER 3
The mean proportion of calories coming from dietary fat for the intervention group is
0.202. Further, the 95% confidence interval of the proportion of calories coming from dietary fat
for the intervention group lies between 0.170 and 0.235.
The 95% confidence interval can be interpreted that when another study is undertaken
then there is a 95% probability that the mean proportion of calories coming from dietary fat
would lie between 0.170 and 0.235.
tabler-icon-diamond-filled.svg

Paraphrase This Document

Need a fresh take? Get an instant paraphrase of this document with our AI Paraphraser
Document Page
4BIOSTATISTICS
In the following investigation binomial probability is used. There are only two groups.
Since, a subject can be in either of one group, hence it is a binomial probability.
ANSWER 4
The mean proportion of calories from dietary fat for intervention group is 0.202.
Moreover, the 95% probability of the mean proportion of calories from dietary fat lies between
0.170 and 0.235. Thus, it can be inferred that there is a 95% probability that the mean would be
less than 0.235 or 23.5%.
Thus, there is a 95% evidence that the mean for the intervention group lie’s below 35%.
ANSWER 5
In order to analyze for differences in mean proportion of dietary fat independent sample
t-test is used.
The hypothesis for analyzing the difference in the mean proportion of dietary fat between
the control and intervention group can be formulated as:
Null hypothesis: There is no difference between the mean proportion of dietary fat between
control and intervention group.
H0 : μcontrol=μintervention
Alternate hypothesis: There are differences between the mean proportion of dietary fat between
control and intervention group.
H A : μcontrol μintervention
Document Page
5BIOSTATISTICS
From the test it is found that at 0.05 level of significance there are significant differences
in the mean proportion of dietary fat of control and intervention group, p < 0.000.
The mean proportion of dietary fat of control group (0.3414815) is found to be higher
than for intervention group (0.2024828).
ANSWER 6
From the results it can be seen that the mean of the score is 35.46. The 95% confidence
interval is 31.57, 39.36.
The 95% confidence interval can be interpreted as when a similar score of the 80 students is
taken then there is a 95% probability of the mean score to be between 31.57 and 39.36.
Document Page
6BIOSTATISTICS
chevron_up_icon
1 out of 7
circle_padding
hide_on_mobile
zoom_out_icon
[object Object]