Biostatistics Assignment: Hypothesis Testing and Statistical Analysis

Verified

Added on  2022/12/12

|10
|1582
|13
Homework Assignment
AI Summary
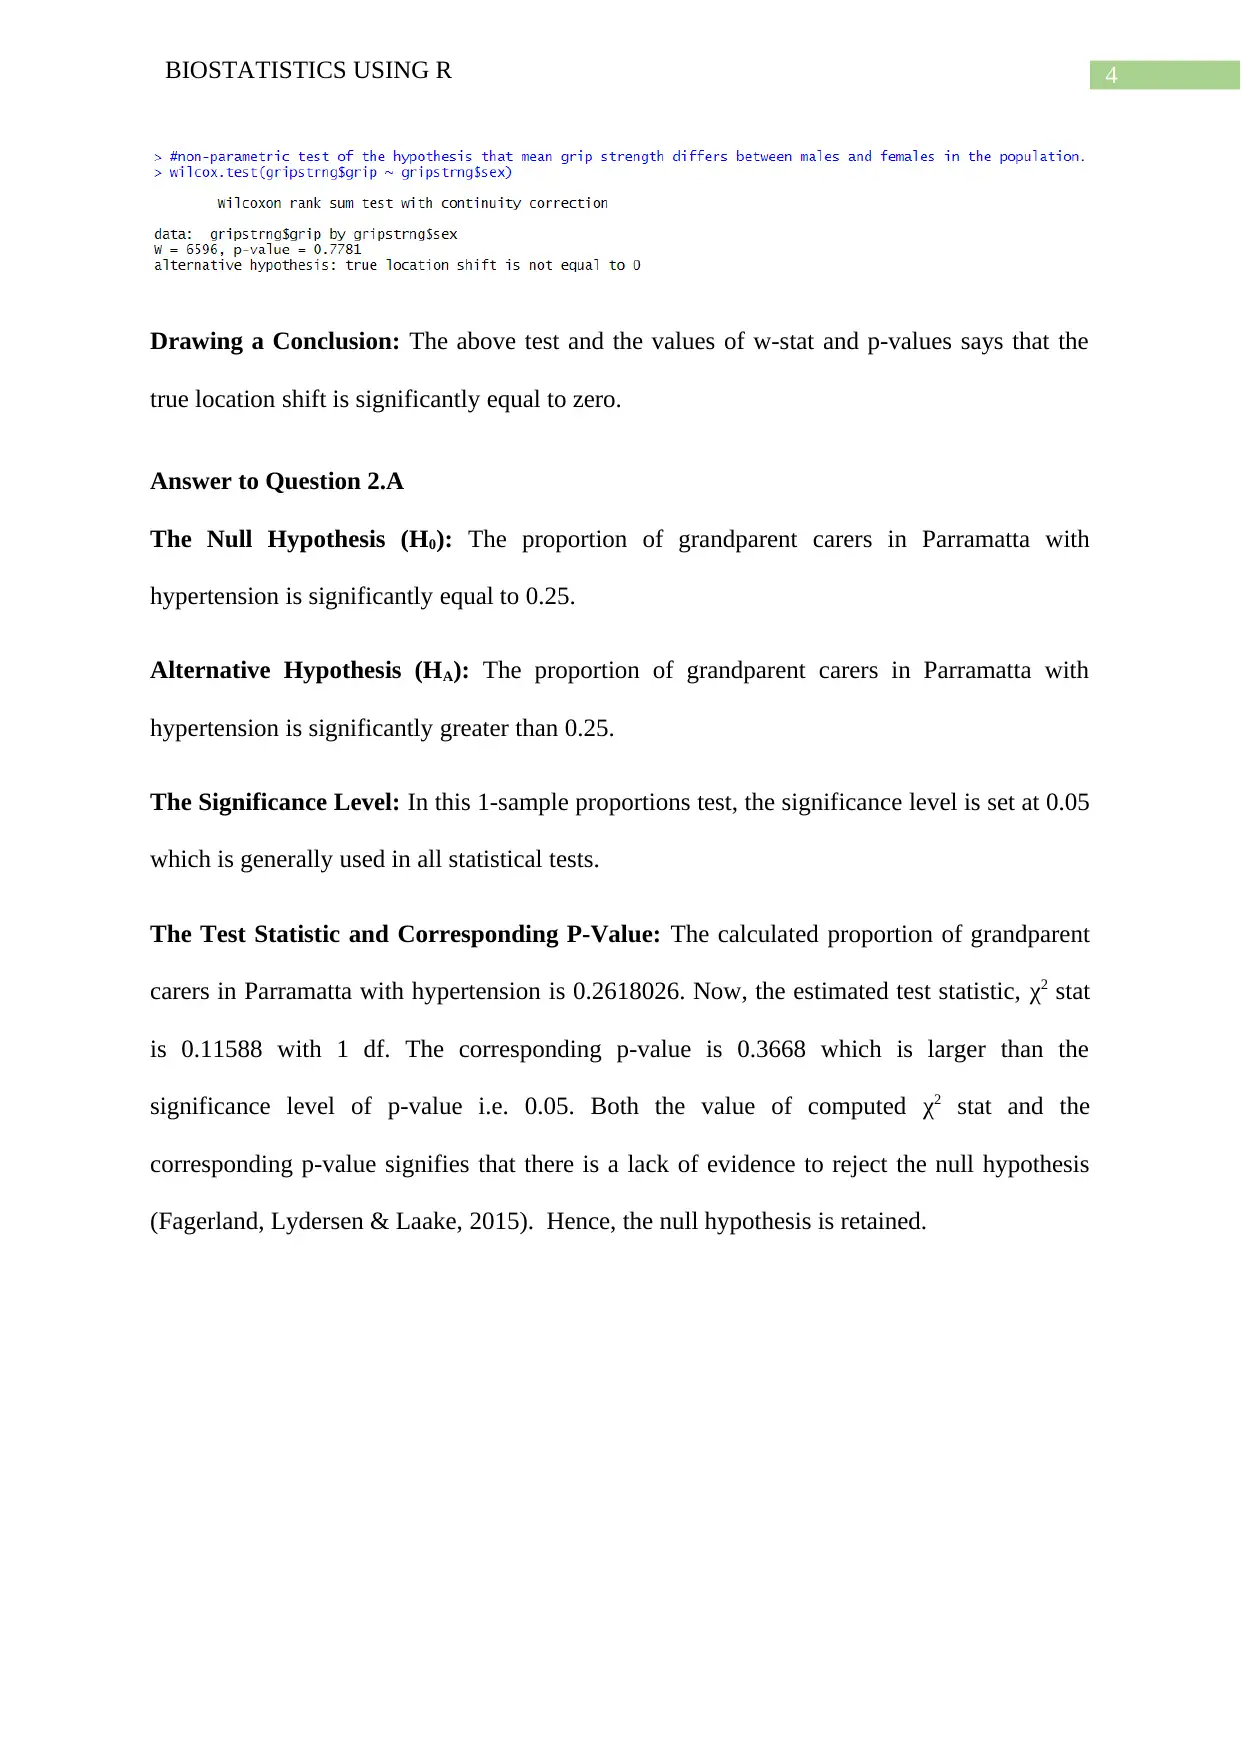
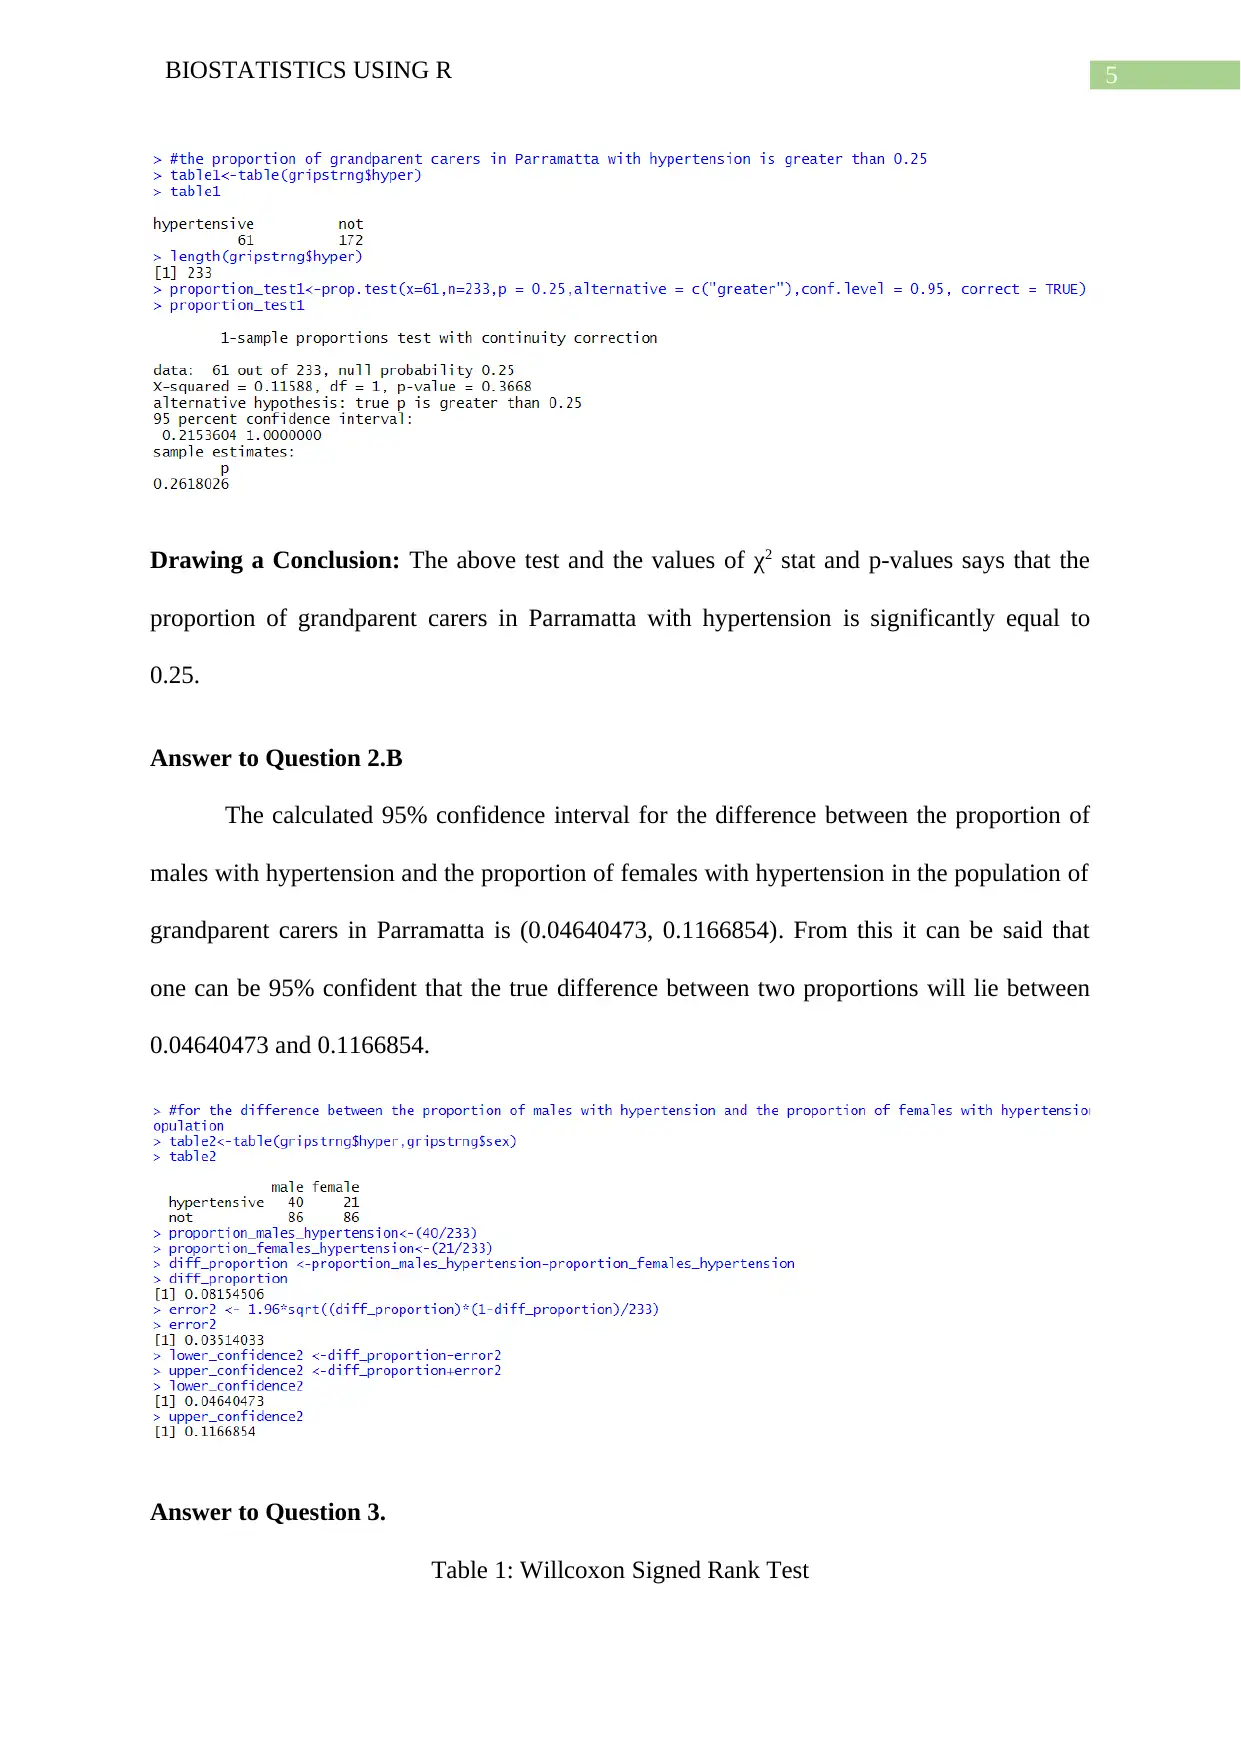
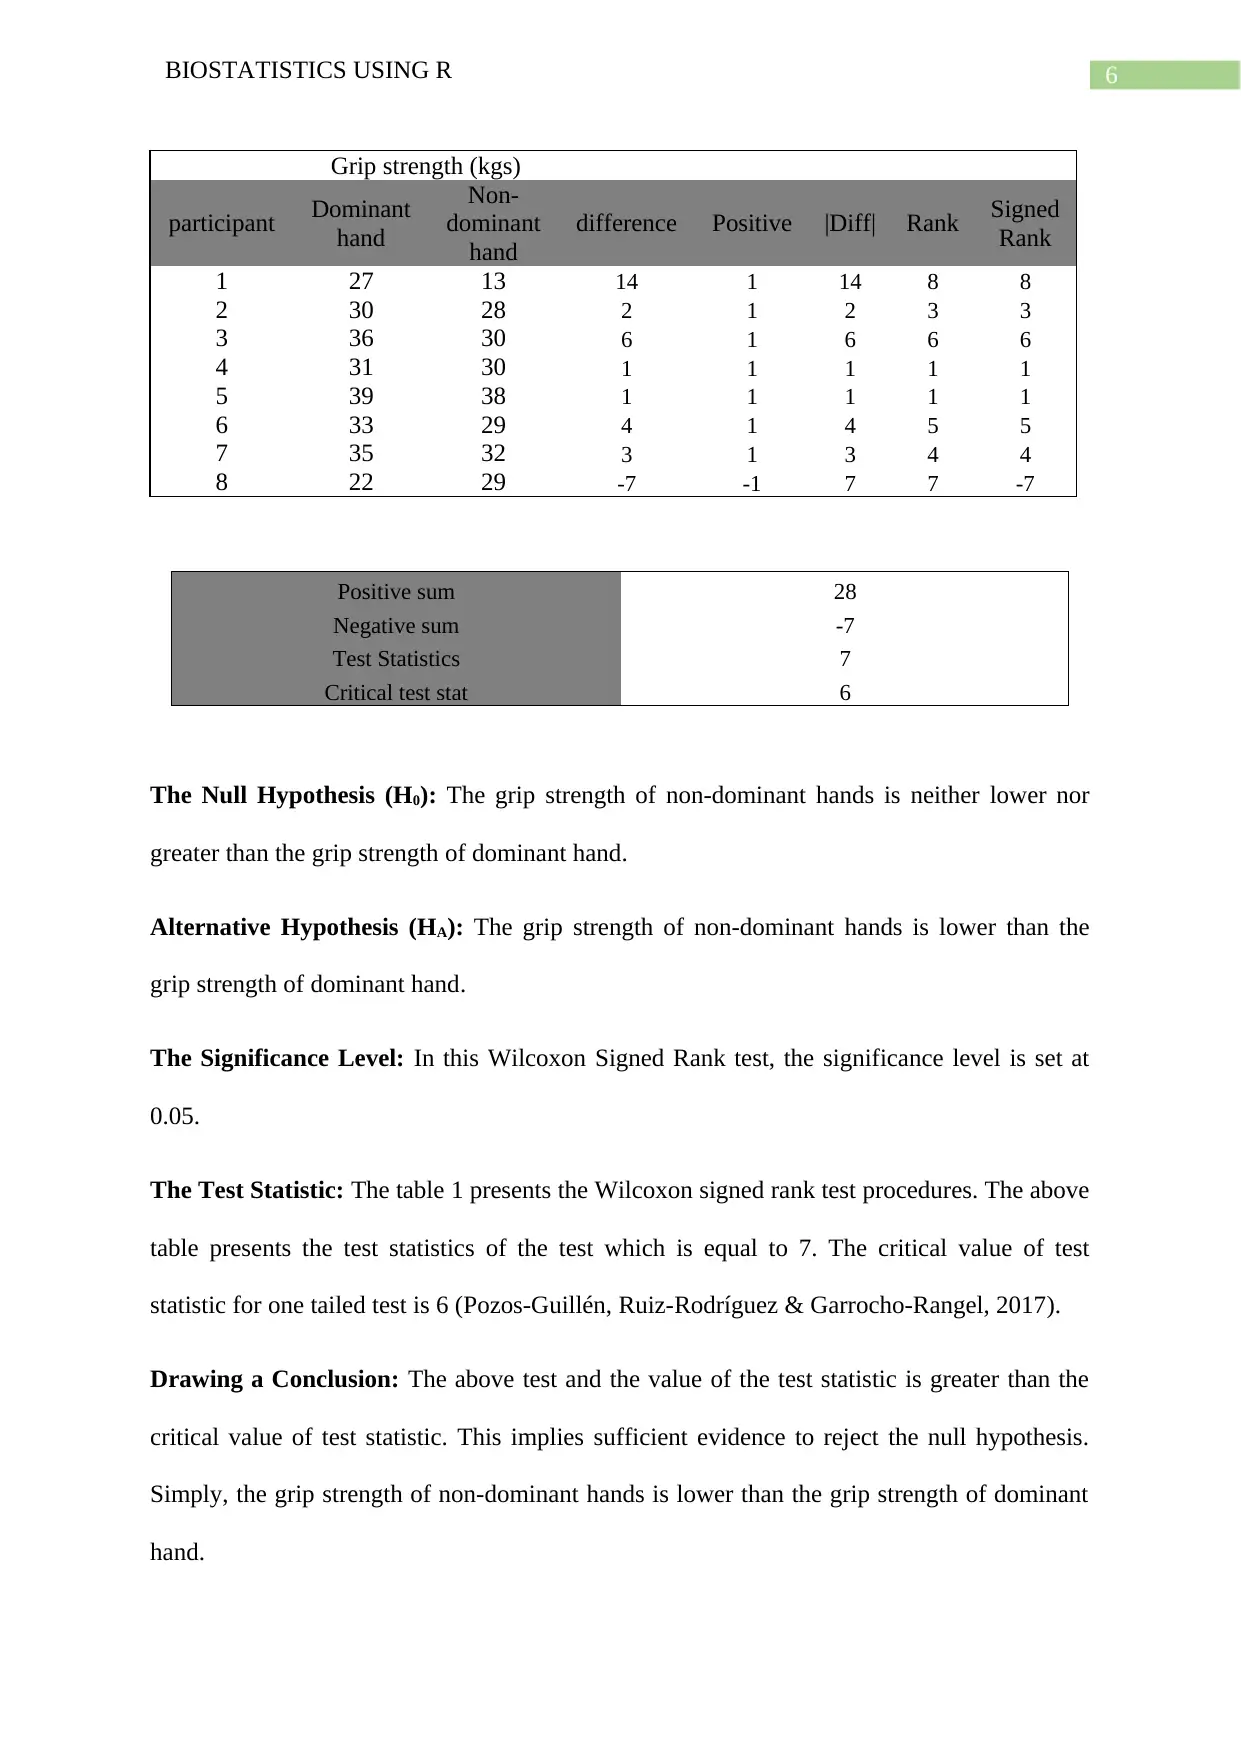
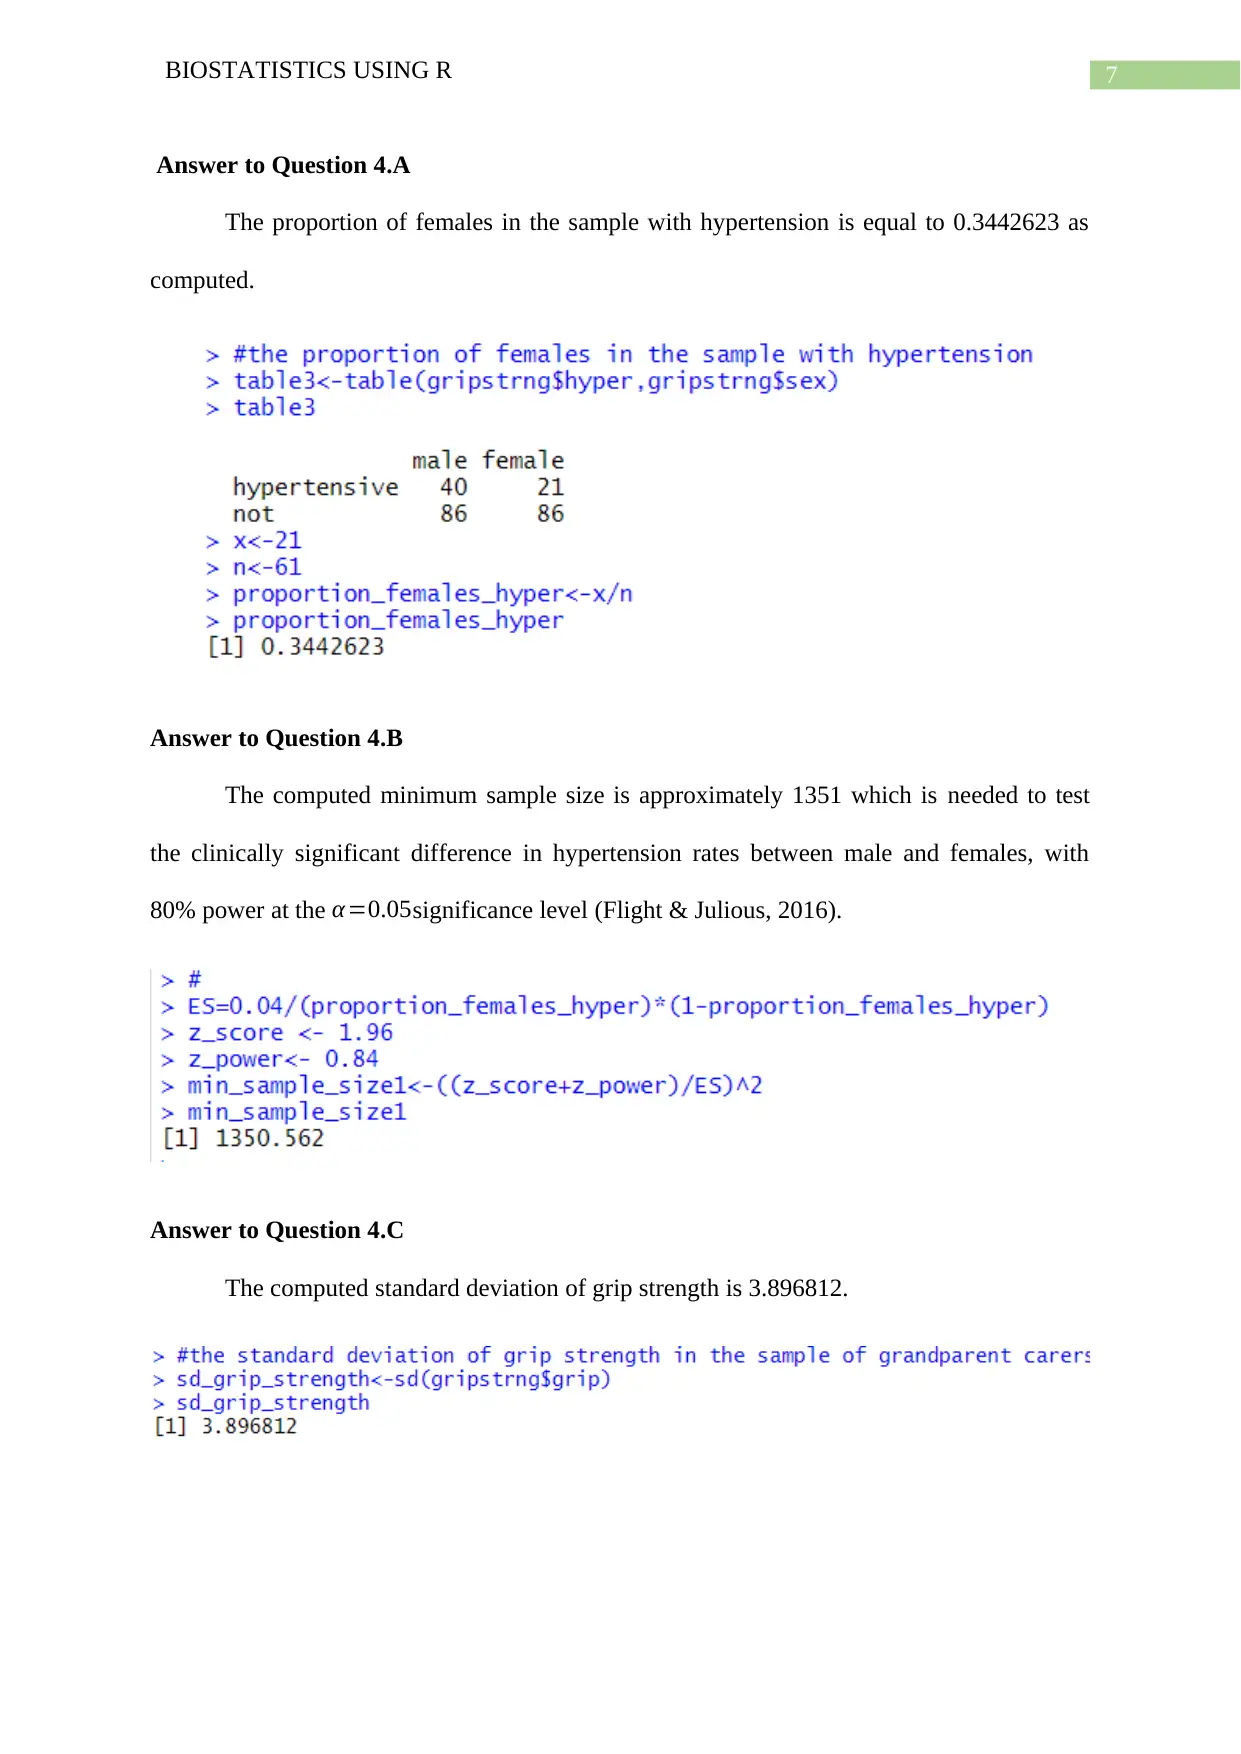
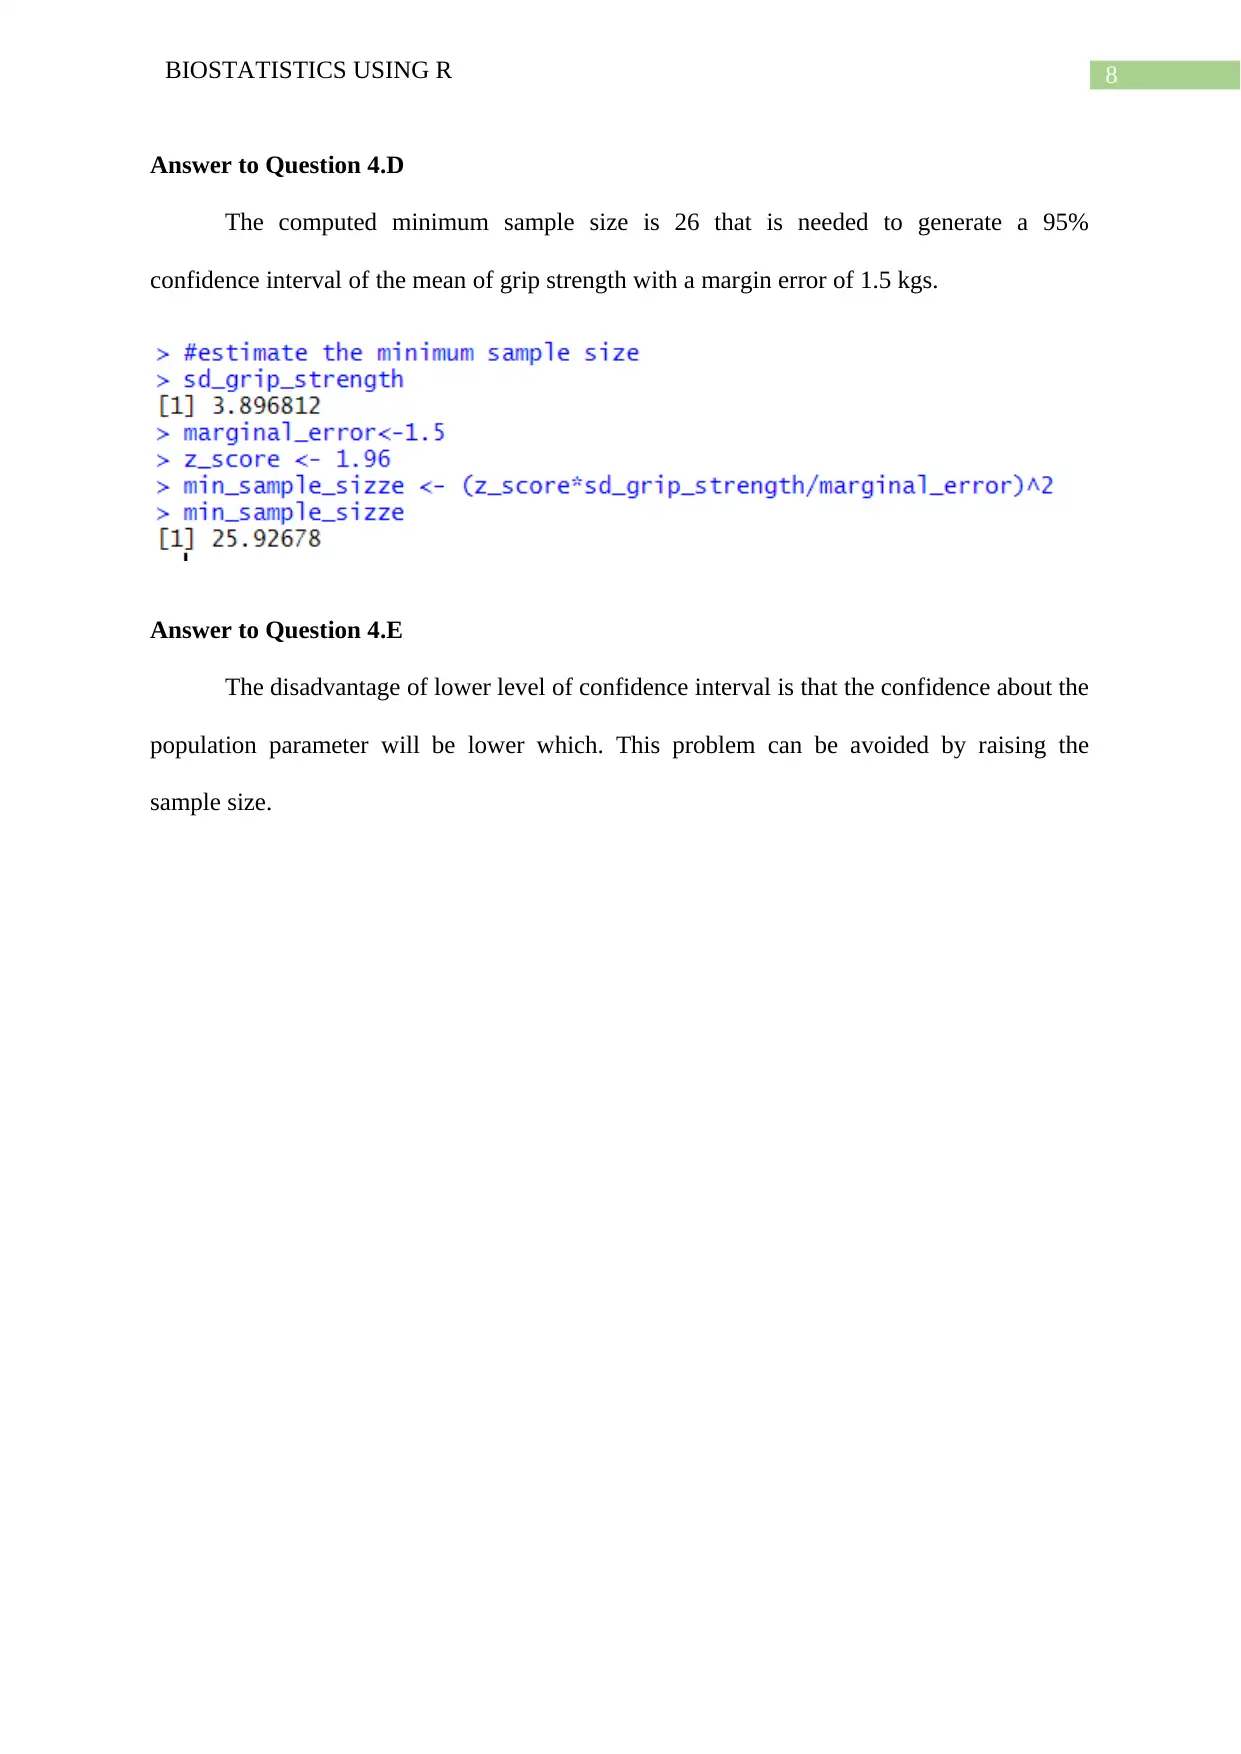
This biostatistics assignment solution presents a detailed analysis of various statistical concepts using R. The solution addresses several questions, including calculating confidence intervals for mean grip strength and interpreting the results. It covers hypothesis testing using both parametric and non-parametric methods, such as Welch's t-test and Wilcoxon signed-rank test, comparing grip strength between genders and assessing the significance of location shifts. The assignment also includes a 1-sample proportions test to evaluate hypertension rates and calculates confidence intervals for the difference in proportions. Furthermore, it demonstrates the application of the Wilcoxon signed-rank test for paired data and explores sample size calculations for different scenarios, including determining the minimum sample size required for testing clinically significant differences in hypertension rates and generating confidence intervals. The solution also discusses the disadvantages of lower confidence levels. References and bibliography are provided for additional context.
tabler-icon-diamond-filled.svg

Contribute Materials

Your contribution can guide someone’s learning journey. Share your documents today.
Document Page
Running head: BIOSTATISTICS USING R
Biostatistics Using R
Name of the Student:
Name of the University:
Author Note:
tabler-icon-diamond-filled.svg

Secure Best Marks with AI Grader

Need help grading? Try our AI Grader for instant feedback on your assignments.
Document Page
1BIOSTATISTICS USING R
Table of Contents
Answer to Question 1.A.............................................................................................................2
Answer to Question 1.B.............................................................................................................2
Answer to Question 1.C.............................................................................................................2
Answer to Question 1.D.............................................................................................................3
Answer to Question 2.A.............................................................................................................4
Answer to Question 2.B.............................................................................................................5
Answer to Question 3.................................................................................................................5
Answer to Question 4.A.............................................................................................................6
Answer to Question 4.B.............................................................................................................7
Answer to Question 4.C.............................................................................................................7
Answer to Question 4.D.............................................................................................................7
Answer to Question 4.E.............................................................................................................7
Reference and bibliography.......................................................................................................9
Document Page
2BIOSTATISTICS USING R
Answer to Question 1.A
The calculated lower and upper 95% confidence interval of mean grip strength is
31.58384 and 32.5898 respectively. From this it can be said that one can be 95% confident
that the true mean of grip strength will lie between 31.58384 and 32.5898. A confidence
interval provides the range of possible values for a population parameter (Kaps &
Lamberson, 2017).
Answer to Question 1.B
The above mentioned 95% confidence interval for mean grip strength presents that the
grandparent carers’ mean grip strength in Parramatta is significantly different from 33 kgs at
the 0.05 significance level (Le & Eberly,.2016).
The reason behind the insignificant mean grip strength value of 33 kg is that it lies
outside the 95% confidence interval which is (31.58384, 32.5898).
Answer to Question 1.C
The Null Hypothesis (H0): The mean difference of grip strength between male and female is
significantly zero.
Alternative Hypothesis (HA): The mean difference of grip strength between male and
female is not significantly zero.
The Significance Level: In this Welch test, the significance level is set at 0.05 which is
generally used in all statistical tests.
Document Page
3BIOSTATISTICS USING R
The Test Statistic and Corresponding P-Value: The calculated mean grip strength for male
and female is 32.03703 and 32.14546 respectively. Now, the estimated t-stat is -0.21132 and
the critical t-stat at 0.05 for two tailed hypothesis is 0.975. The corresponding p-value is
0.8328 which is larger than the significance level of p-value i.e. 0.05. Both the value of
computed t-stat and the corresponding p-value signifies that there is a lack of evidence to
reject the null hypothesis (Wang, 2018). Hence, the null hypothesis is retained.
Drawing a Conclusion: The above test and the values of t-stat and p-values says that the
mean difference of grip strength between male and female is significantly zero.
Answer to Question 1.D
The Null Hypothesis (H0): The true location shift is equal to zero.
Alternative Hypothesis (HA): The true location shift is not equal to zero.
The Significance Level: In this non-parametric Wilcoxon test, the significance level is set at
0.05.
The Test Statistic and Corresponding P-Value: Now, the estimated test statistic, w-stat is -
6596. The corresponding p-value is 0.7781 which is larger than the significance level of p-
value i.e. 0.05. Both the value of computed w-stat and the corresponding p-value signifies
that there is a lack of evidence to reject the null hypothesis. Hence, the null hypothesis is
retained.
tabler-icon-diamond-filled.svg

Secure Best Marks with AI Grader

Need help grading? Try our AI Grader for instant feedback on your assignments.
Document Page
4BIOSTATISTICS USING R
Drawing a Conclusion: The above test and the values of w-stat and p-values says that the
true location shift is significantly equal to zero.
Answer to Question 2.A
The Null Hypothesis (H0): The proportion of grandparent carers in Parramatta with
hypertension is significantly equal to 0.25.
Alternative Hypothesis (HA): The proportion of grandparent carers in Parramatta with
hypertension is significantly greater than 0.25.
The Significance Level: In this 1-sample proportions test, the significance level is set at 0.05
which is generally used in all statistical tests.
The Test Statistic and Corresponding P-Value: The calculated proportion of grandparent
carers in Parramatta with hypertension is 0.2618026. Now, the estimated test statistic, χ2 stat
is 0.11588 with 1 df. The corresponding p-value is 0.3668 which is larger than the
significance level of p-value i.e. 0.05. Both the value of computed χ2 stat and the
corresponding p-value signifies that there is a lack of evidence to reject the null hypothesis
(Fagerland, Lydersen & Laake, 2015). Hence, the null hypothesis is retained.
Document Page
5BIOSTATISTICS USING R
Drawing a Conclusion: The above test and the values of χ2 stat and p-values says that the
proportion of grandparent carers in Parramatta with hypertension is significantly equal to
0.25.
Answer to Question 2.B
The calculated 95% confidence interval for the difference between the proportion of
males with hypertension and the proportion of females with hypertension in the population of
grandparent carers in Parramatta is (0.04640473, 0.1166854). From this it can be said that
one can be 95% confident that the true difference between two proportions will lie between
0.04640473 and 0.1166854.
Answer to Question 3.
Table 1: Willcoxon Signed Rank Test
Document Page
6BIOSTATISTICS USING R
Grip strength (kgs)
participant Dominant
hand
Non-
dominant
hand
difference Positive |Diff| Rank Signed
Rank
1 27 13 14 1 14 8 8
2 30 28 2 1 2 3 3
3 36 30 6 1 6 6 6
4 31 30 1 1 1 1 1
5 39 38 1 1 1 1 1
6 33 29 4 1 4 5 5
7 35 32 3 1 3 4 4
8 22 29 -7 -1 7 7 -7
Positive sum 28
Negative sum -7
Test Statistics 7
Critical test stat 6
The Null Hypothesis (H0): The grip strength of non-dominant hands is neither lower nor
greater than the grip strength of dominant hand.
Alternative Hypothesis (HA): The grip strength of non-dominant hands is lower than the
grip strength of dominant hand.
The Significance Level: In this Wilcoxon Signed Rank test, the significance level is set at
0.05.
The Test Statistic: The table 1 presents the Wilcoxon signed rank test procedures. The above
table presents the test statistics of the test which is equal to 7. The critical value of test
statistic for one tailed test is 6 (Pozos-Guillén, Ruiz-Rodríguez & Garrocho-Rangel, 2017).
Drawing a Conclusion: The above test and the value of the test statistic is greater than the
critical value of test statistic. This implies sufficient evidence to reject the null hypothesis.
Simply, the grip strength of non-dominant hands is lower than the grip strength of dominant
hand.
tabler-icon-diamond-filled.svg

Paraphrase This Document

Need a fresh take? Get an instant paraphrase of this document with our AI Paraphraser
Document Page
7BIOSTATISTICS USING R
Answer to Question 4.A
The proportion of females in the sample with hypertension is equal to 0.3442623 as
computed.
Answer to Question 4.B
The computed minimum sample size is approximately 1351 which is needed to test
the clinically significant difference in hypertension rates between male and females, with
80% power at the α=0.05significance level (Flight & Julious, 2016).
Answer to Question 4.C
The computed standard deviation of grip strength is 3.896812.
Document Page
8BIOSTATISTICS USING R
Answer to Question 4.D
The computed minimum sample size is 26 that is needed to generate a 95%
confidence interval of the mean of grip strength with a margin error of 1.5 kgs.
Answer to Question 4.E
The disadvantage of lower level of confidence interval is that the confidence about the
population parameter will be lower which. This problem can be avoided by raising the
sample size.
Document Page
9BIOSTATISTICS USING R
Reference and bibliography
Daniel, W. W., & Cross, C. L. (2018). Biostatistics: a foundation for analysis in the health
sciences. Wiley.
Ekstrom, C. T. (2019). R Primer. Chapman and Hall/CRC.
Fagerland, M. W., Lydersen, S., & Laake, P. (2015). Recommended confidence intervals for
two independent binomial proportions. Statistical methods in medical research, 24(2),
224-254.
Flight, L., & Julious, S. A. (2016). Practical guide to sample size calculations: an
introduction. Pharmaceutical statistics, 15(1), 68-74.
Kaps, M., & Lamberson, W. R. (Eds.). (2017). Biostatistics for animal science. Cabi.
Le, C. T., & Eberly, L. E. (2016). Introductory biostatistics. John Wiley & Sons.
Pozos-Guillén, A., Ruiz-Rodríguez, S., & Garrocho-Rangel, A. (2017). Fundamentals in
Biostatistics for Investigation in Pediatric Dentistry: Part II–Biostatistical Methods.
Journal of Clinical Pediatric Dentistry, 41(3), 173-178.
Wang, J., Zhou, Y., Fei, X., Chen, X., & Chen, Y. (2018). Biostatistics mining associated
method identifies AKR1B10 enhancing hepatocellular carcinoma cell growth and
degenerated by miR-383-5p. Scientific reports, 8.
chevron_up_icon
1 out of 10
circle_padding
hide_on_mobile
zoom_out_icon
logo.png

Your All-in-One AI-Powered Toolkit for Academic Success.

Available 24*7 on WhatsApp / Email

[object Object]