Biostatistics Report: Analyzing Transport in New Zealand - Autumn
VerifiedAdded on 2023/06/03
|10
|1376
|68
Report
AI Summary
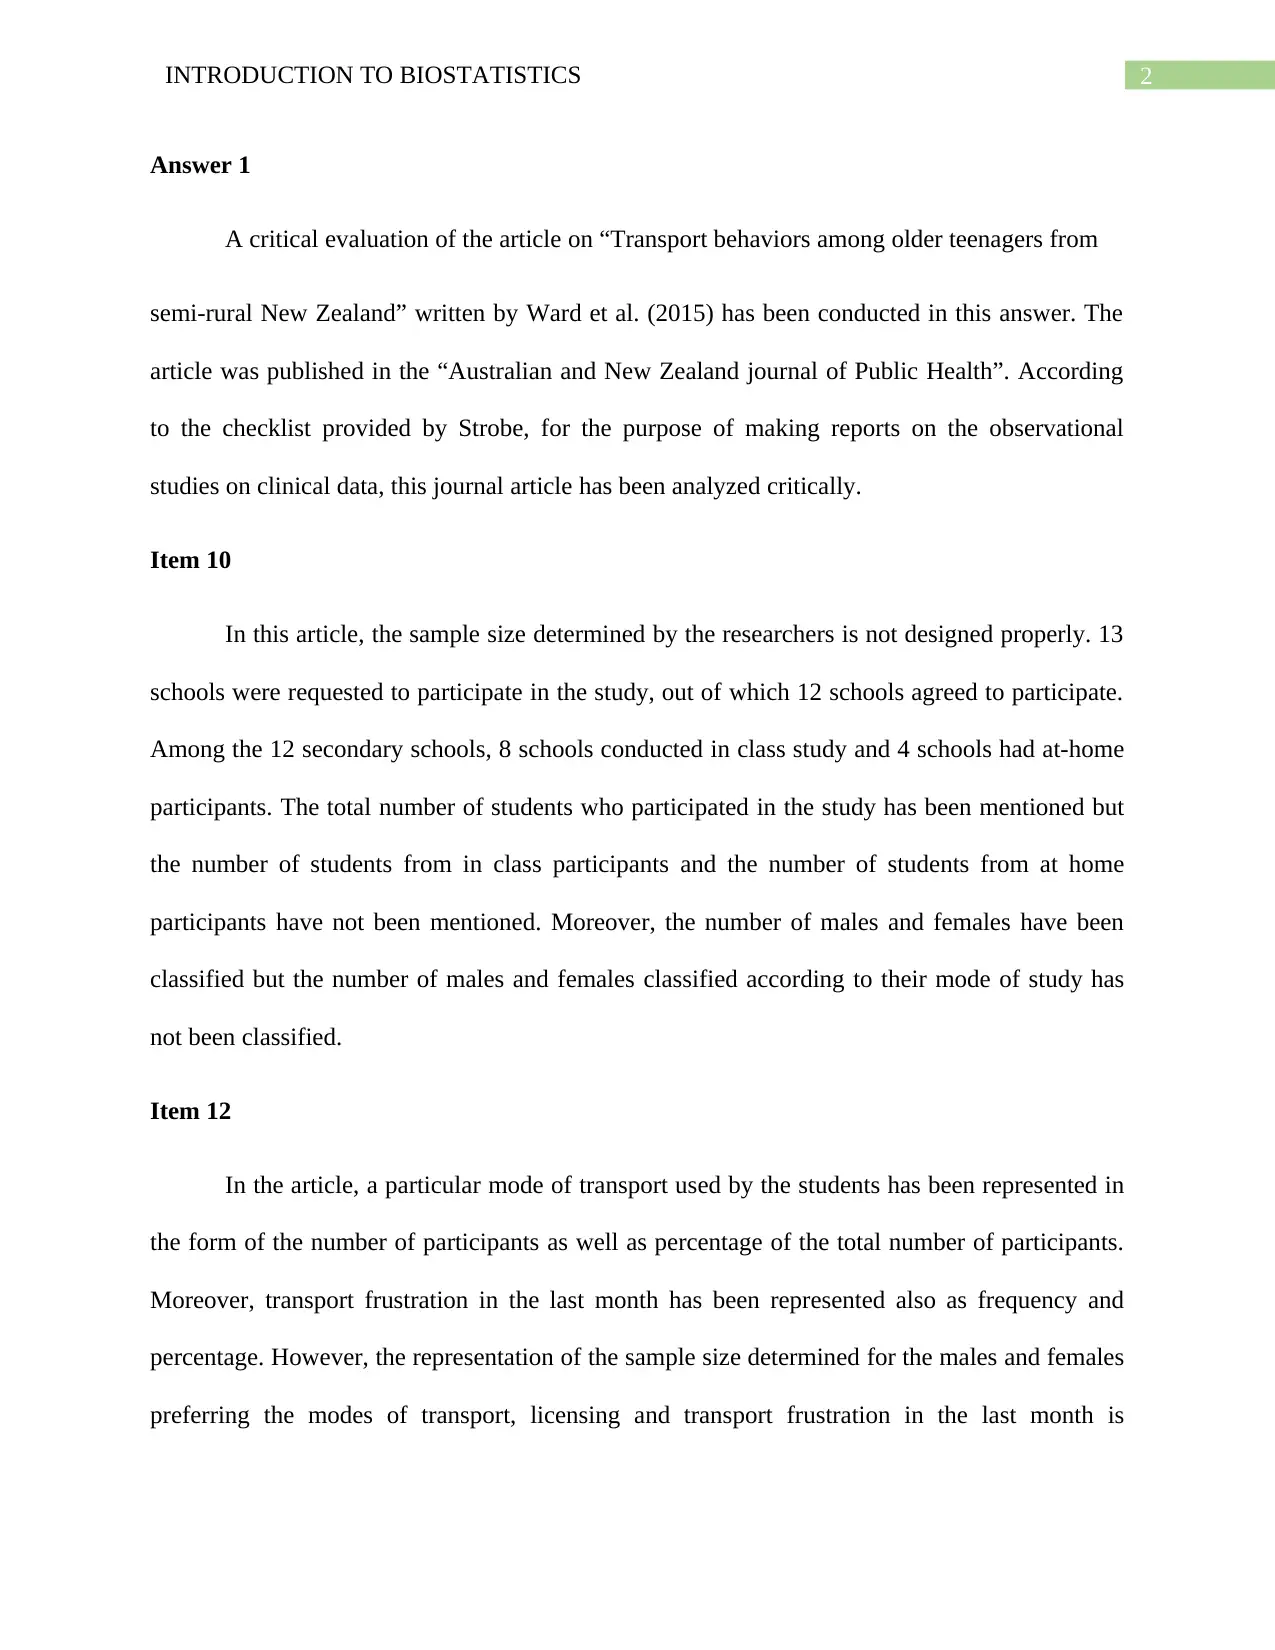
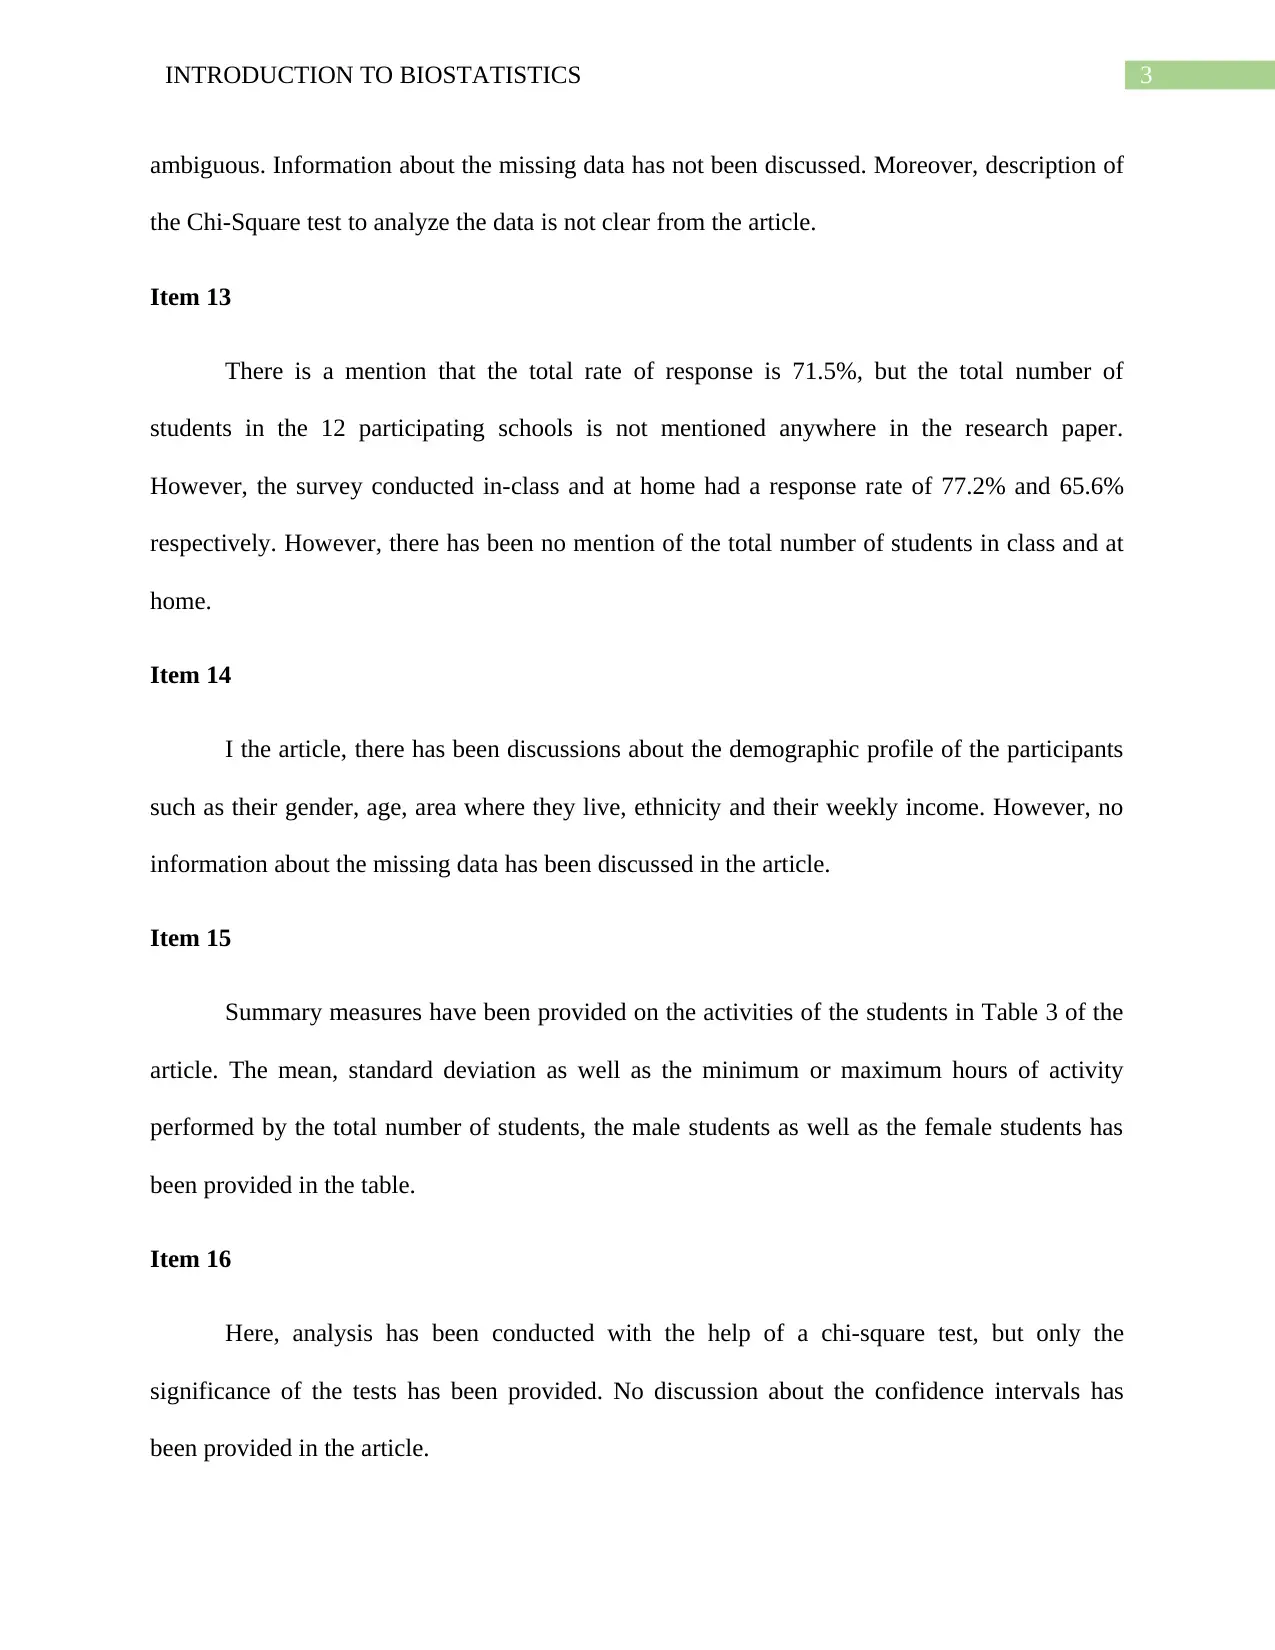
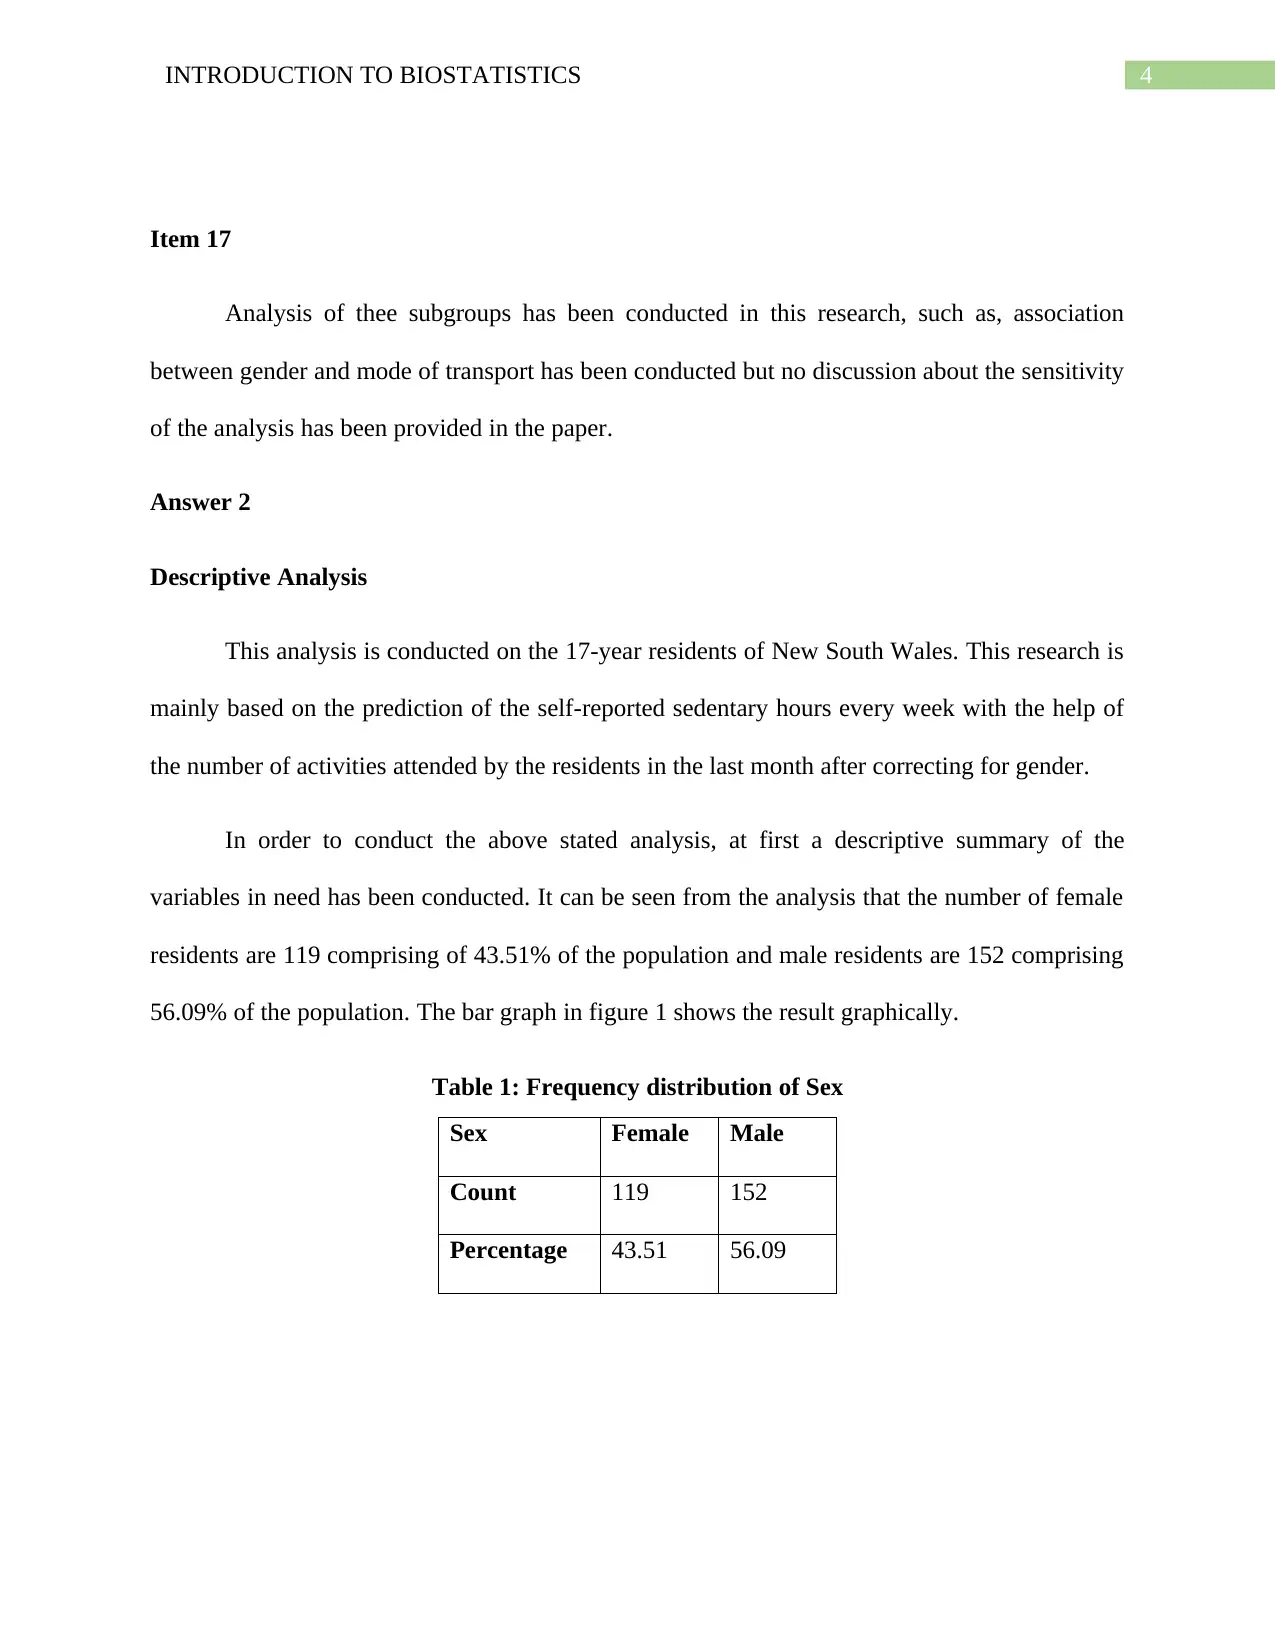
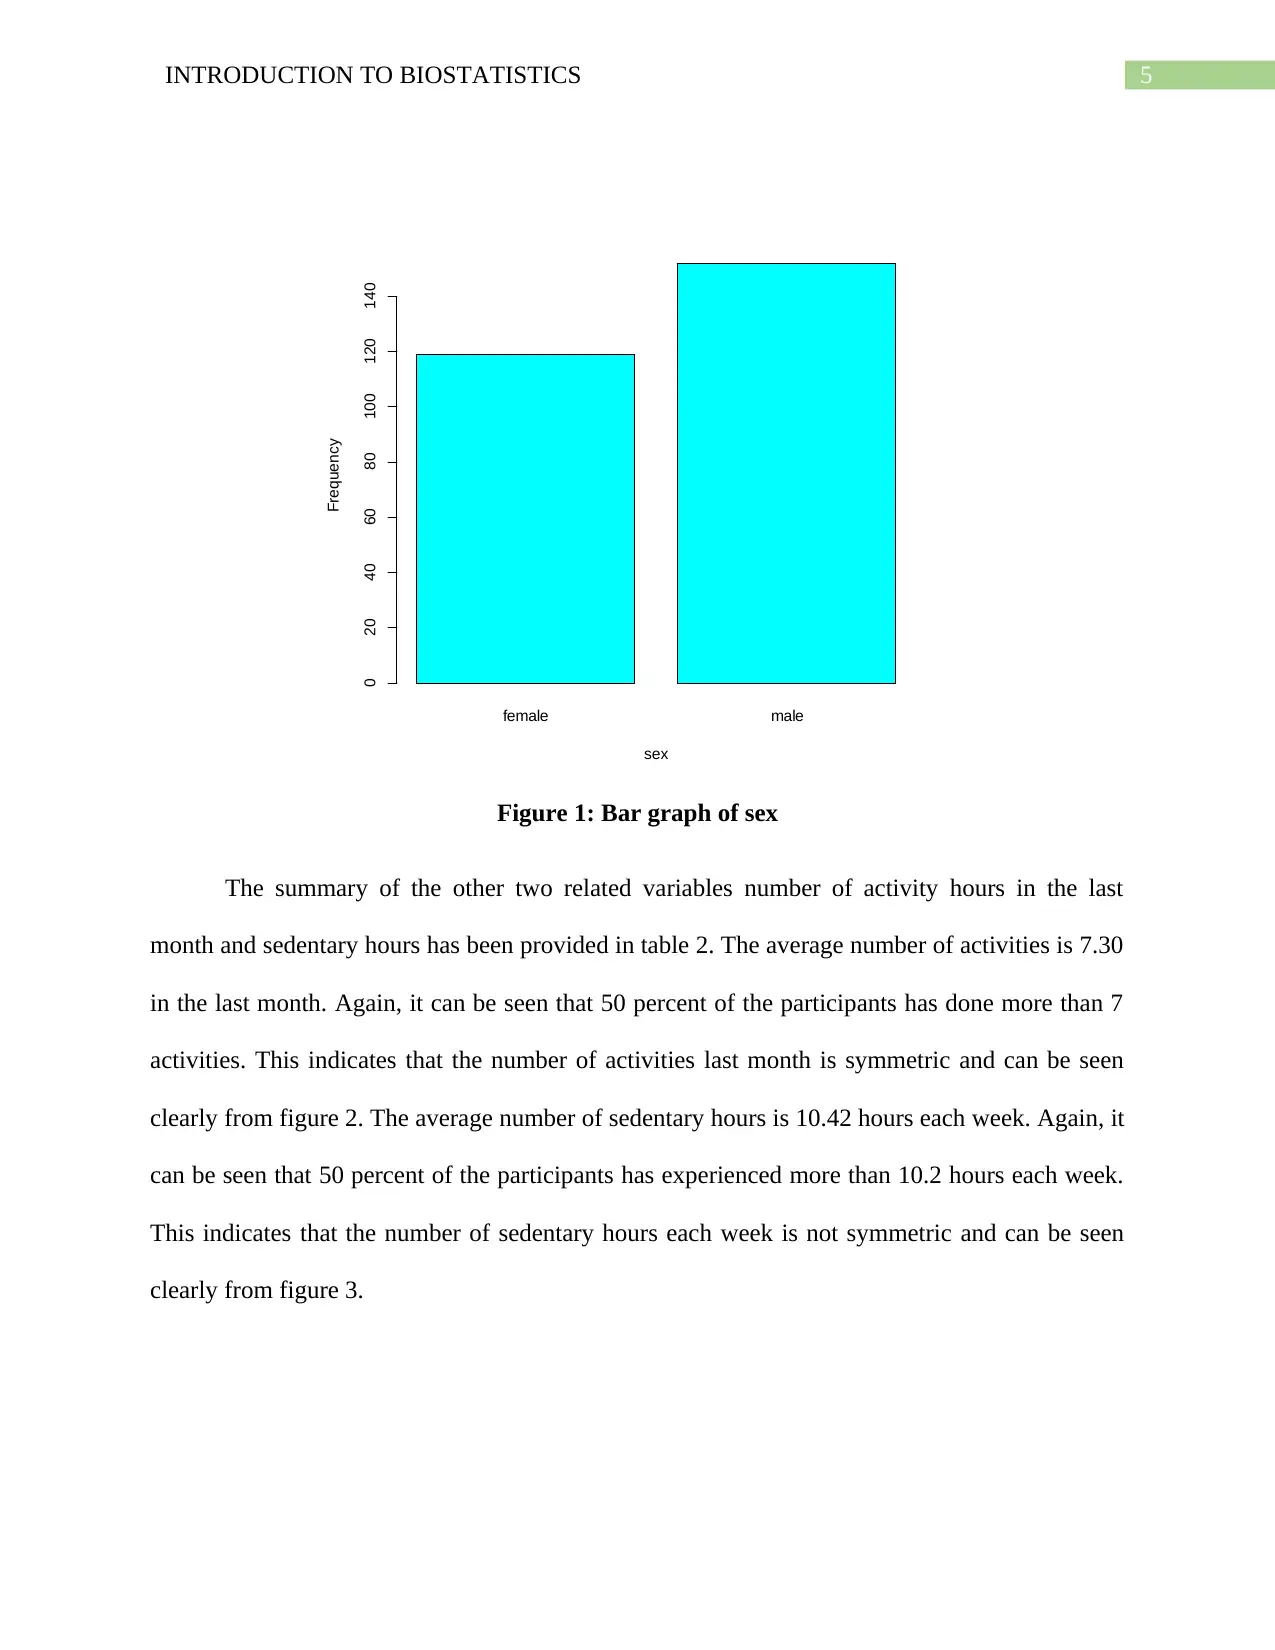
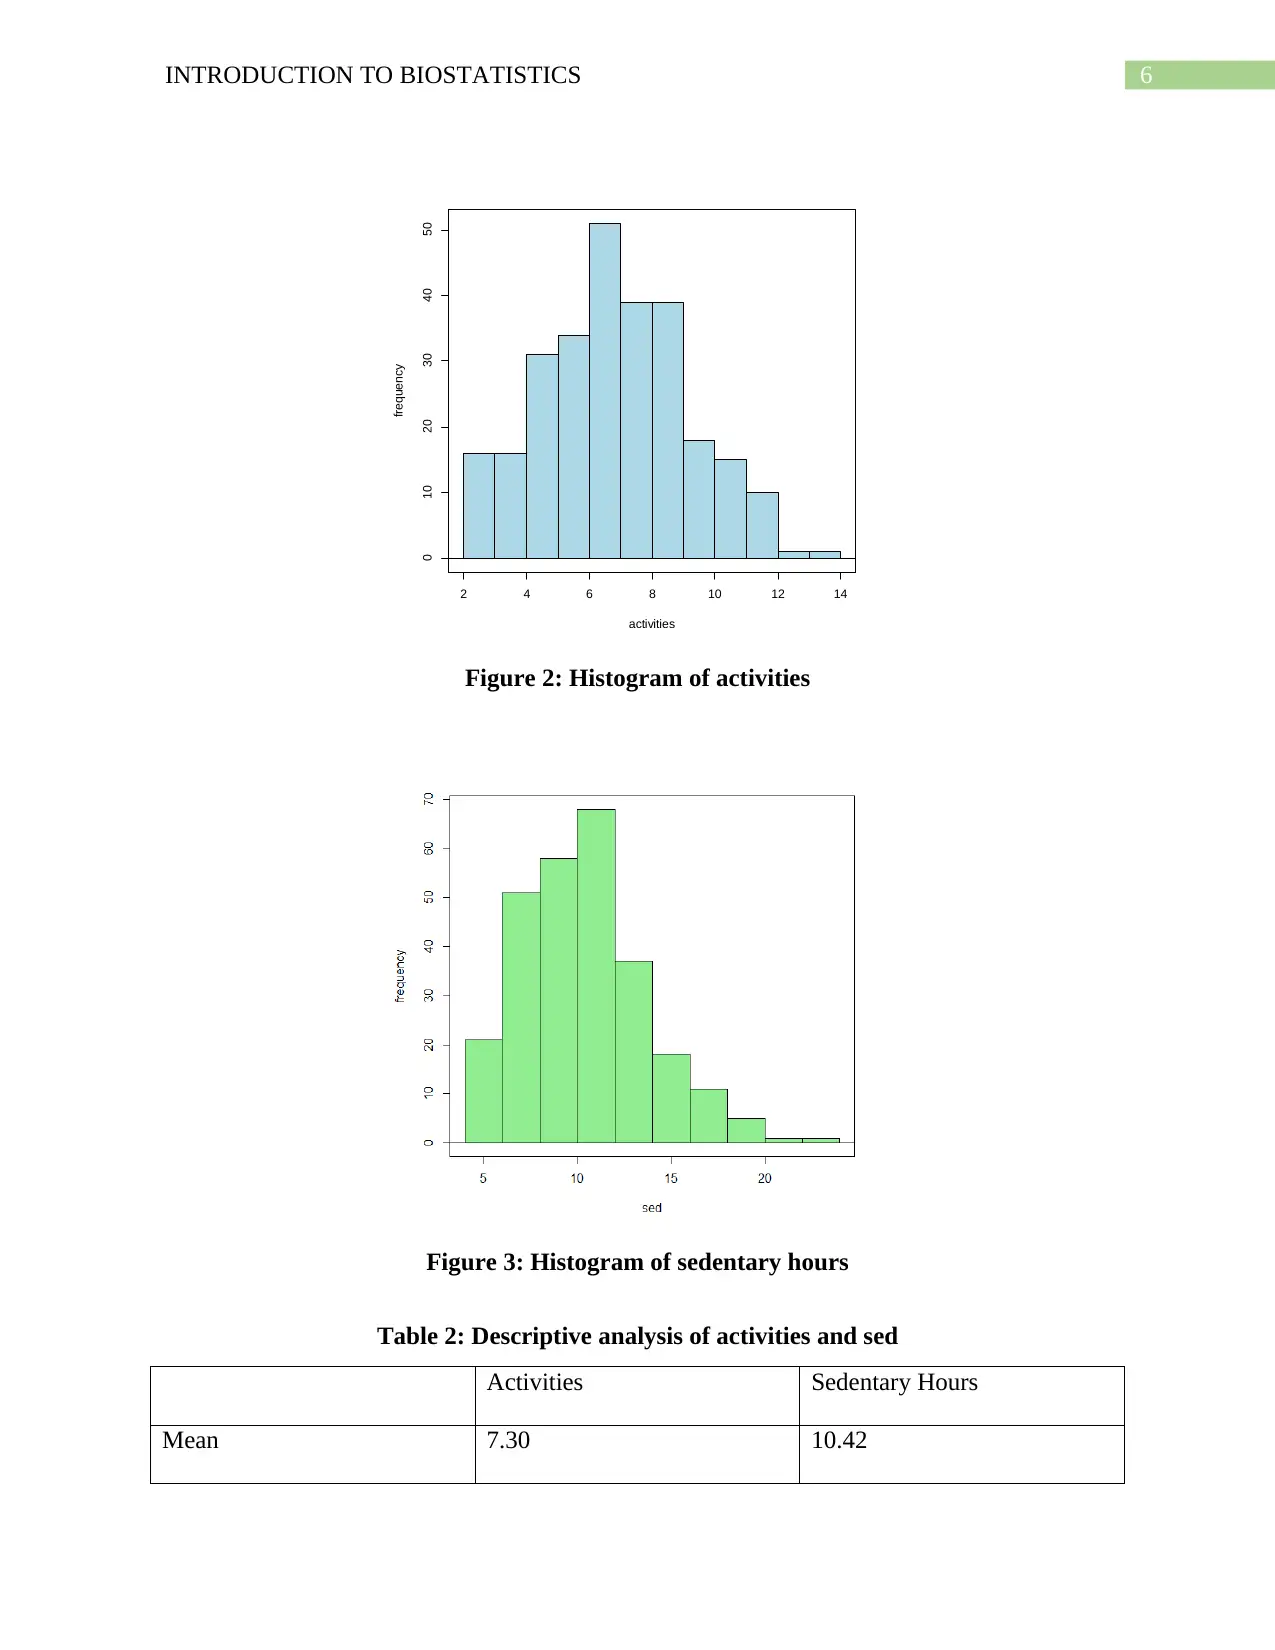
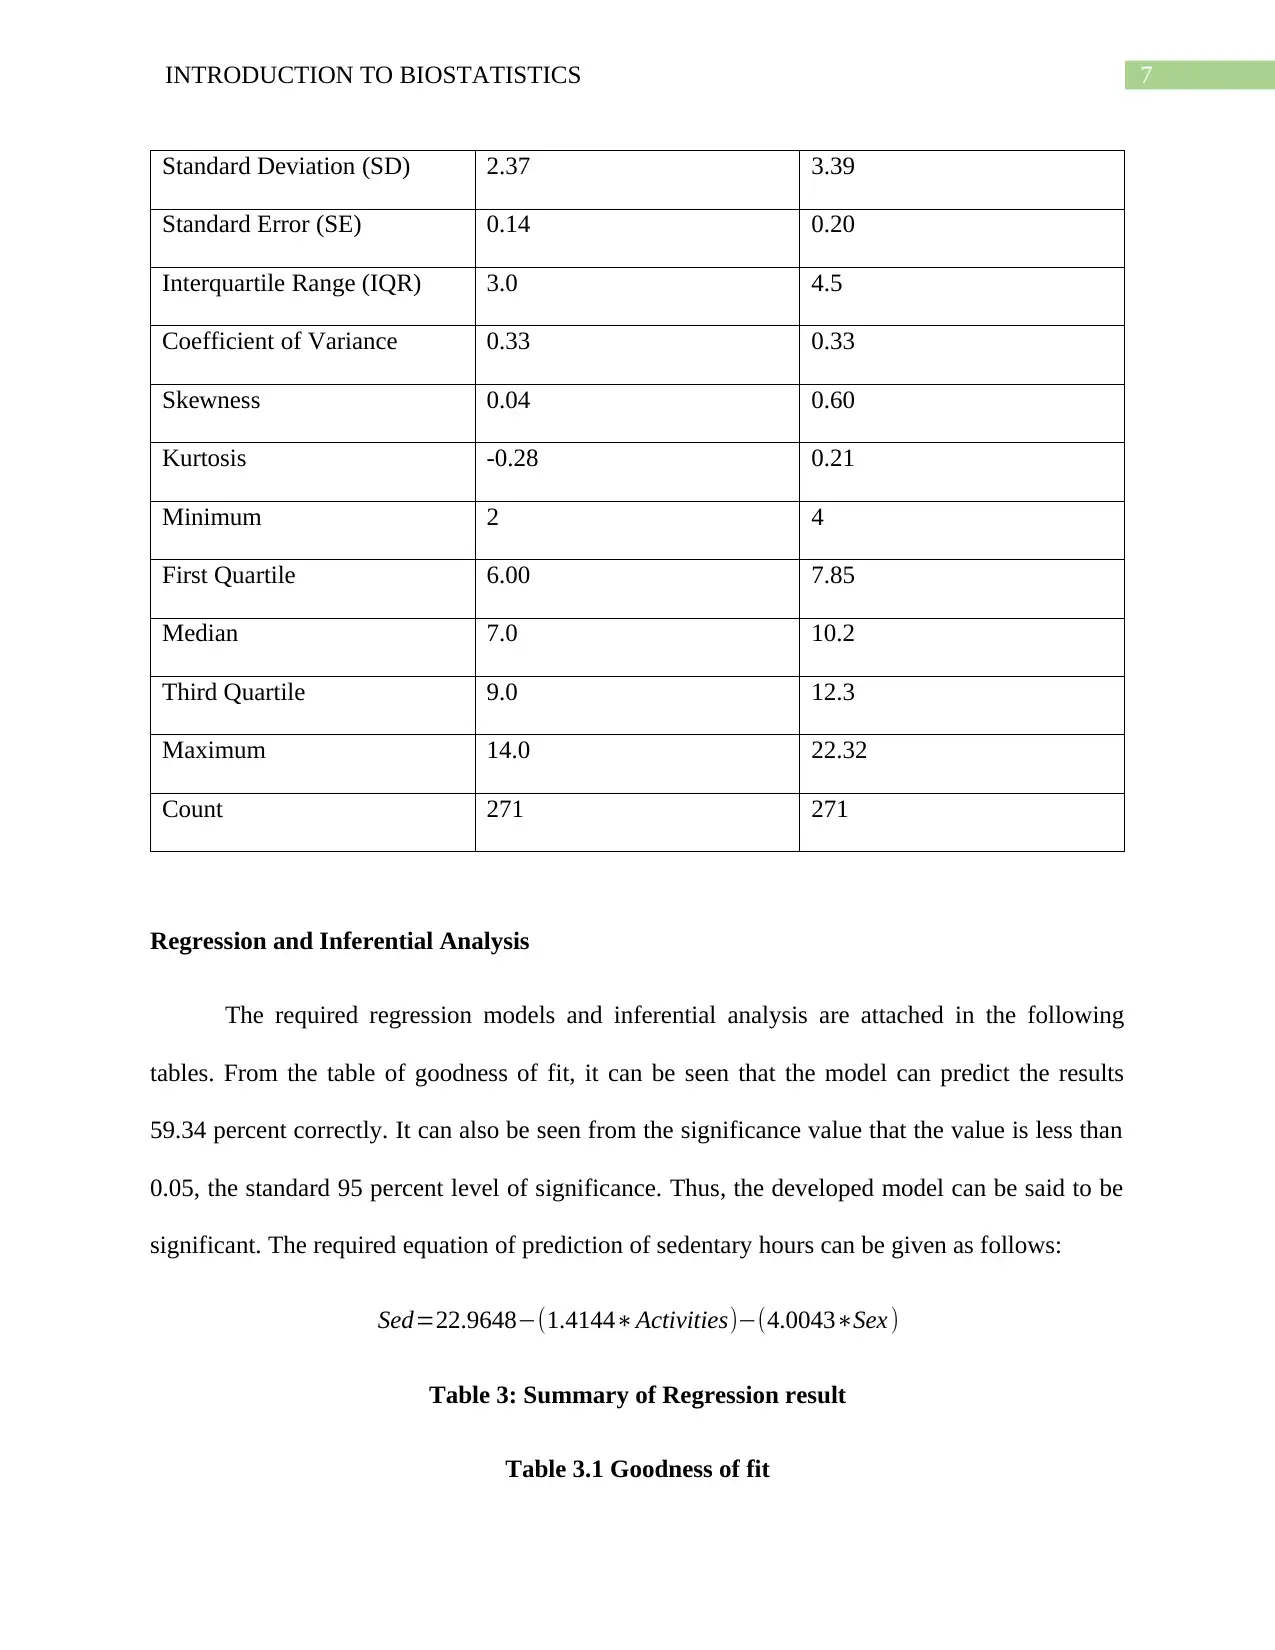
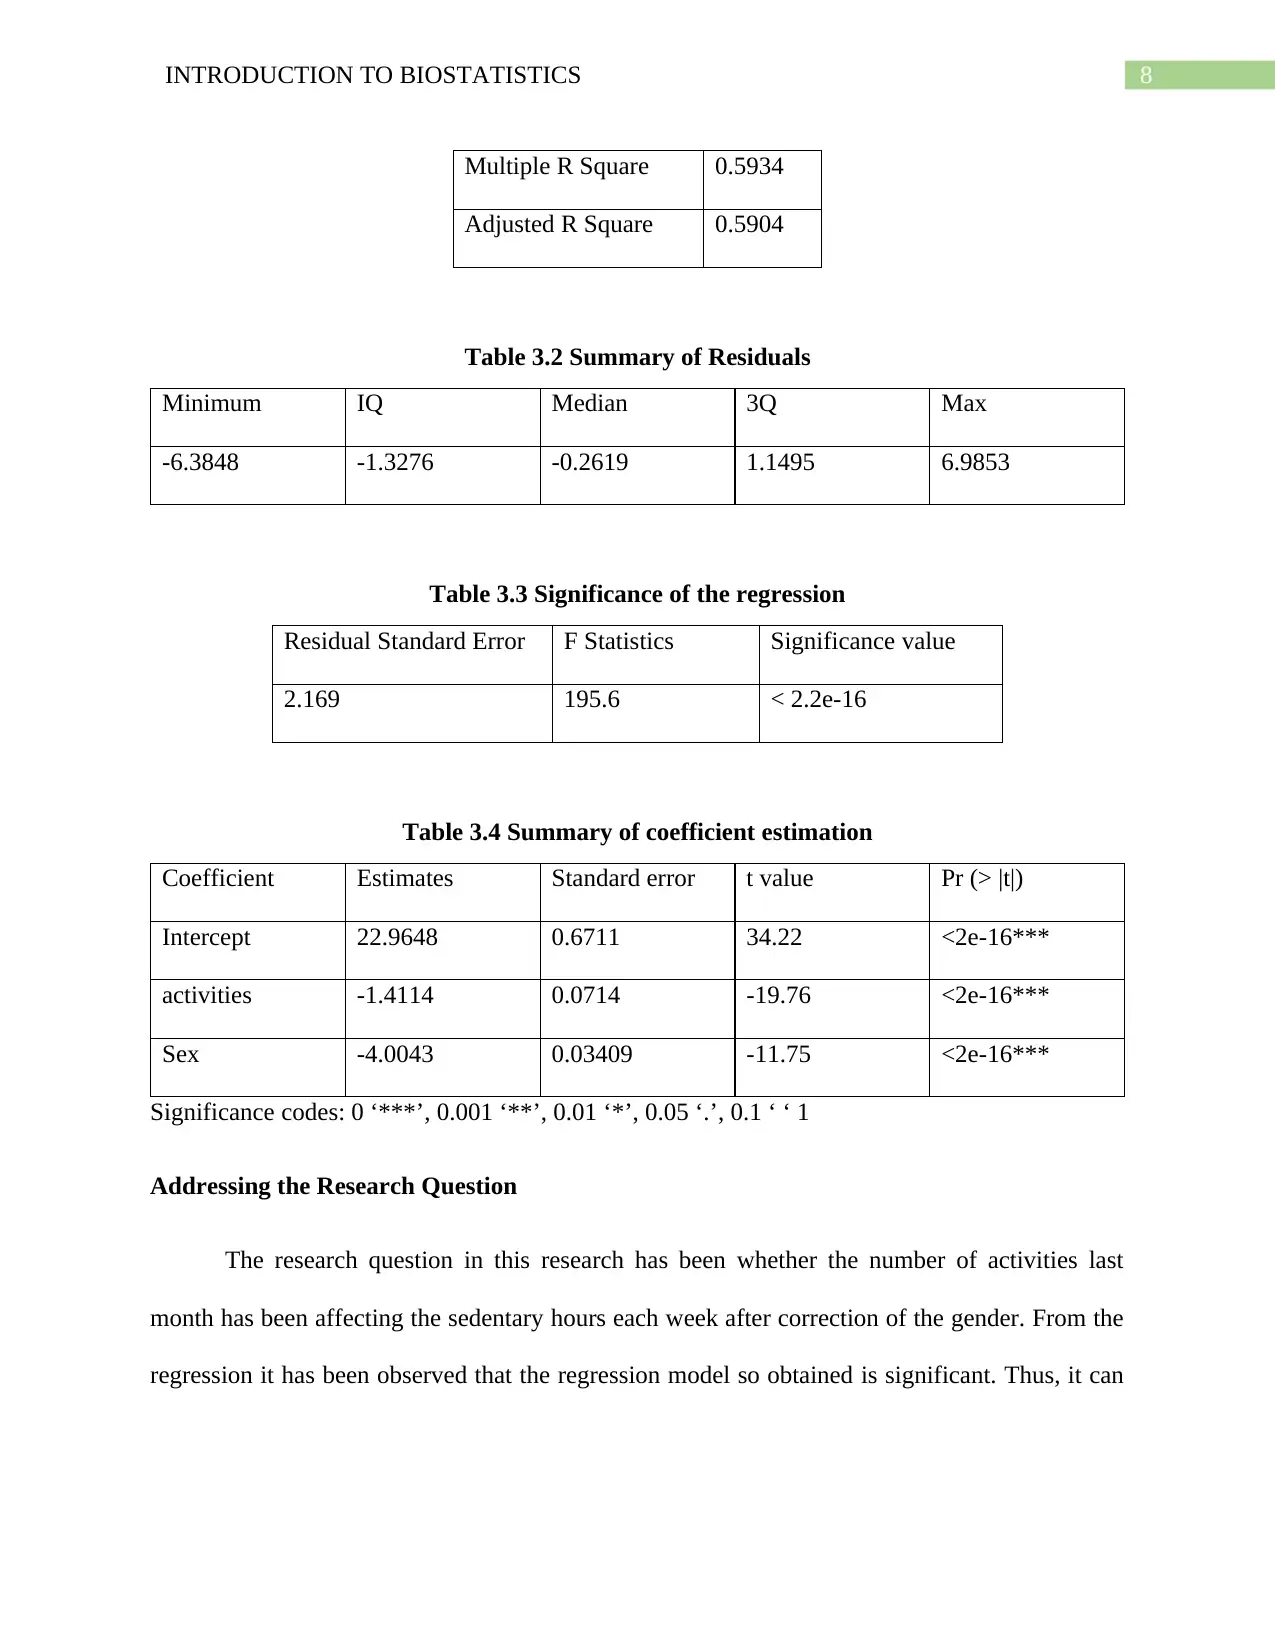
This assignment consists of two primary analyses. The first is a critical appraisal of a research article on transport behaviors among older teenagers from semi-rural New Zealand, using the STROBE checklist to evaluate the statistical methods and reporting. The critique focuses on sample size determination, data representation, response rates, demographic data, summary measures, and the use of confidence intervals. The second analysis involves descriptive and inferential statistics applied to a dataset of 17-year-old residents of New South Wales, examining the relationship between weekly sedentary hours and participation in activities, while controlling for gender using regression analysis. The report includes descriptive summaries of variables like gender, activity levels, and sedentary hours, along with a regression model to predict sedentary hours based on activity participation and gender, concluding with an assessment of whether activity levels affect sedentary hours after gender correction.

Running Head: INTRODUCTION TO BIOSTATISTICS
Introduction to Biostatistics
Name of the Student
Name of the University
Student ID
Introduction to Biostatistics
Name of the Student
Name of the University
Student ID
Paraphrase This Document
Need a fresh take? Get an instant paraphrase of this document with our AI Paraphraser

1INTRODUCTION TO BIOSTATISTICS
Table of Contents
Answer 1..........................................................................................................................................2
Item 10.........................................................................................................................................2
Item 12.........................................................................................................................................2
Item 13.........................................................................................................................................3
Item 14.........................................................................................................................................3
Item 15.........................................................................................................................................3
Item 16.........................................................................................................................................3
Item 17.........................................................................................................................................4
Answer 2..........................................................................................................................................4
Descriptive Analysis....................................................................................................................4
Regression and Inferential Analysis............................................................................................7
Addressing the Research Question..............................................................................................8

2INTRODUCTION TO BIOSTATISTICS
Answer 1
A critical evaluation of the article on “Transport behaviors among older teenagers from
semi-rural New Zealand” written by Ward et al. (2015) has been conducted in this answer. The
article was published in the “Australian and New Zealand journal of Public Health”. According
to the checklist provided by Strobe, for the purpose of making reports on the observational
studies on clinical data, this journal article has been analyzed critically.
Item 10
In this article, the sample size determined by the researchers is not designed properly. 13
schools were requested to participate in the study, out of which 12 schools agreed to participate.
Among the 12 secondary schools, 8 schools conducted in class study and 4 schools had at-home
participants. The total number of students who participated in the study has been mentioned but
the number of students from in class participants and the number of students from at home
participants have not been mentioned. Moreover, the number of males and females have been
classified but the number of males and females classified according to their mode of study has
not been classified.
Item 12
In the article, a particular mode of transport used by the students has been represented in
the form of the number of participants as well as percentage of the total number of participants.
Moreover, transport frustration in the last month has been represented also as frequency and
percentage. However, the representation of the sample size determined for the males and females
preferring the modes of transport, licensing and transport frustration in the last month is
⊘ This is a preview!⊘
Do you want full access?
Subscribe today to unlock all pages.

Trusted by 1+ million students worldwide

3INTRODUCTION TO BIOSTATISTICS
ambiguous. Information about the missing data has not been discussed. Moreover, description of
the Chi-Square test to analyze the data is not clear from the article.
Item 13
There is a mention that the total rate of response is 71.5%, but the total number of
students in the 12 participating schools is not mentioned anywhere in the research paper.
However, the survey conducted in-class and at home had a response rate of 77.2% and 65.6%
respectively. However, there has been no mention of the total number of students in class and at
home.
Item 14
I the article, there has been discussions about the demographic profile of the participants
such as their gender, age, area where they live, ethnicity and their weekly income. However, no
information about the missing data has been discussed in the article.
Item 15
Summary measures have been provided on the activities of the students in Table 3 of the
article. The mean, standard deviation as well as the minimum or maximum hours of activity
performed by the total number of students, the male students as well as the female students has
been provided in the table.
Item 16
Here, analysis has been conducted with the help of a chi-square test, but only the
significance of the tests has been provided. No discussion about the confidence intervals has
been provided in the article.
Paraphrase This Document
Need a fresh take? Get an instant paraphrase of this document with our AI Paraphraser

4INTRODUCTION TO BIOSTATISTICS
Item 17
Analysis of thee subgroups has been conducted in this research, such as, association
between gender and mode of transport has been conducted but no discussion about the sensitivity
of the analysis has been provided in the paper.
Answer 2
Descriptive Analysis
This analysis is conducted on the 17-year residents of New South Wales. This research is
mainly based on the prediction of the self-reported sedentary hours every week with the help of
the number of activities attended by the residents in the last month after correcting for gender.
In order to conduct the above stated analysis, at first a descriptive summary of the
variables in need has been conducted. It can be seen from the analysis that the number of female
residents are 119 comprising of 43.51% of the population and male residents are 152 comprising
56.09% of the population. The bar graph in figure 1 shows the result graphically.
Table 1: Frequency distribution of Sex
Sex Female Male
Count 119 152
Percentage 43.51 56.09

5INTRODUCTION TO BIOSTATISTICS
female male
sex
Frequency
0 20 40 60 80 100 120 140
Figure 1: Bar graph of sex
The summary of the other two related variables number of activity hours in the last
month and sedentary hours has been provided in table 2. The average number of activities is 7.30
in the last month. Again, it can be seen that 50 percent of the participants has done more than 7
activities. This indicates that the number of activities last month is symmetric and can be seen
clearly from figure 2. The average number of sedentary hours is 10.42 hours each week. Again, it
can be seen that 50 percent of the participants has experienced more than 10.2 hours each week.
This indicates that the number of sedentary hours each week is not symmetric and can be seen
clearly from figure 3.
⊘ This is a preview!⊘
Do you want full access?
Subscribe today to unlock all pages.

Trusted by 1+ million students worldwide

6INTRODUCTION TO BIOSTATISTICS
activities
frequency
2 4 6 8 10 12 14
0 10 20 30 40 50
Figure 2: Histogram of activities
Figure 3: Histogram of sedentary hours
Table 2: Descriptive analysis of activities and sed
Activities Sedentary Hours
Mean 7.30 10.42
activities
frequency
2 4 6 8 10 12 14
0 10 20 30 40 50
Figure 2: Histogram of activities
Figure 3: Histogram of sedentary hours
Table 2: Descriptive analysis of activities and sed
Activities Sedentary Hours
Mean 7.30 10.42
Paraphrase This Document
Need a fresh take? Get an instant paraphrase of this document with our AI Paraphraser

7INTRODUCTION TO BIOSTATISTICS
Standard Deviation (SD) 2.37 3.39
Standard Error (SE) 0.14 0.20
Interquartile Range (IQR) 3.0 4.5
Coefficient of Variance 0.33 0.33
Skewness 0.04 0.60
Kurtosis -0.28 0.21
Minimum 2 4
First Quartile 6.00 7.85
Median 7.0 10.2
Third Quartile 9.0 12.3
Maximum 14.0 22.32
Count 271 271
Regression and Inferential Analysis
The required regression models and inferential analysis are attached in the following
tables. From the table of goodness of fit, it can be seen that the model can predict the results
59.34 percent correctly. It can also be seen from the significance value that the value is less than
0.05, the standard 95 percent level of significance. Thus, the developed model can be said to be
significant. The required equation of prediction of sedentary hours can be given as follows:
Sed=22.9648−(1.4144∗Activities)−(4.0043∗Sex )
Table 3: Summary of Regression result
Table 3.1 Goodness of fit

8INTRODUCTION TO BIOSTATISTICS
Multiple R Square 0.5934
Adjusted R Square 0.5904
Table 3.2 Summary of Residuals
Minimum IQ Median 3Q Max
-6.3848 -1.3276 -0.2619 1.1495 6.9853
Table 3.3 Significance of the regression
Residual Standard Error F Statistics Significance value
2.169 195.6 < 2.2e-16
Table 3.4 Summary of coefficient estimation
Coefficient Estimates Standard error t value Pr (> |t|)
Intercept 22.9648 0.6711 34.22 <2e-16***
activities -1.4114 0.0714 -19.76 <2e-16***
Sex -4.0043 0.03409 -11.75 <2e-16***
Significance codes: 0 ‘***’, 0.001 ‘**’, 0.01 ‘*’, 0.05 ‘.’, 0.1 ‘ ‘ 1
Addressing the Research Question
The research question in this research has been whether the number of activities last
month has been affecting the sedentary hours each week after correction of the gender. From the
regression it has been observed that the regression model so obtained is significant. Thus, it can
⊘ This is a preview!⊘
Do you want full access?
Subscribe today to unlock all pages.

Trusted by 1+ million students worldwide

9INTRODUCTION TO BIOSTATISTICS
be said that after correction of gender, the sedentary hours are affected by the number of
activities.
be said that after correction of gender, the sedentary hours are affected by the number of
activities.
1 out of 10
Related Documents
Your All-in-One AI-Powered Toolkit for Academic Success.
+13062052269
info@desklib.com
Available 24*7 on WhatsApp / Email
Unlock your academic potential
Copyright © 2020–2025 A2Z Services. All Rights Reserved. Developed and managed by ZUCOL.


