Biostatistics Assignment: Study Review & Regression Analysis 2018

Verified

Added on  2023/06/04

|11
|1860
|199
Report
AI Summary
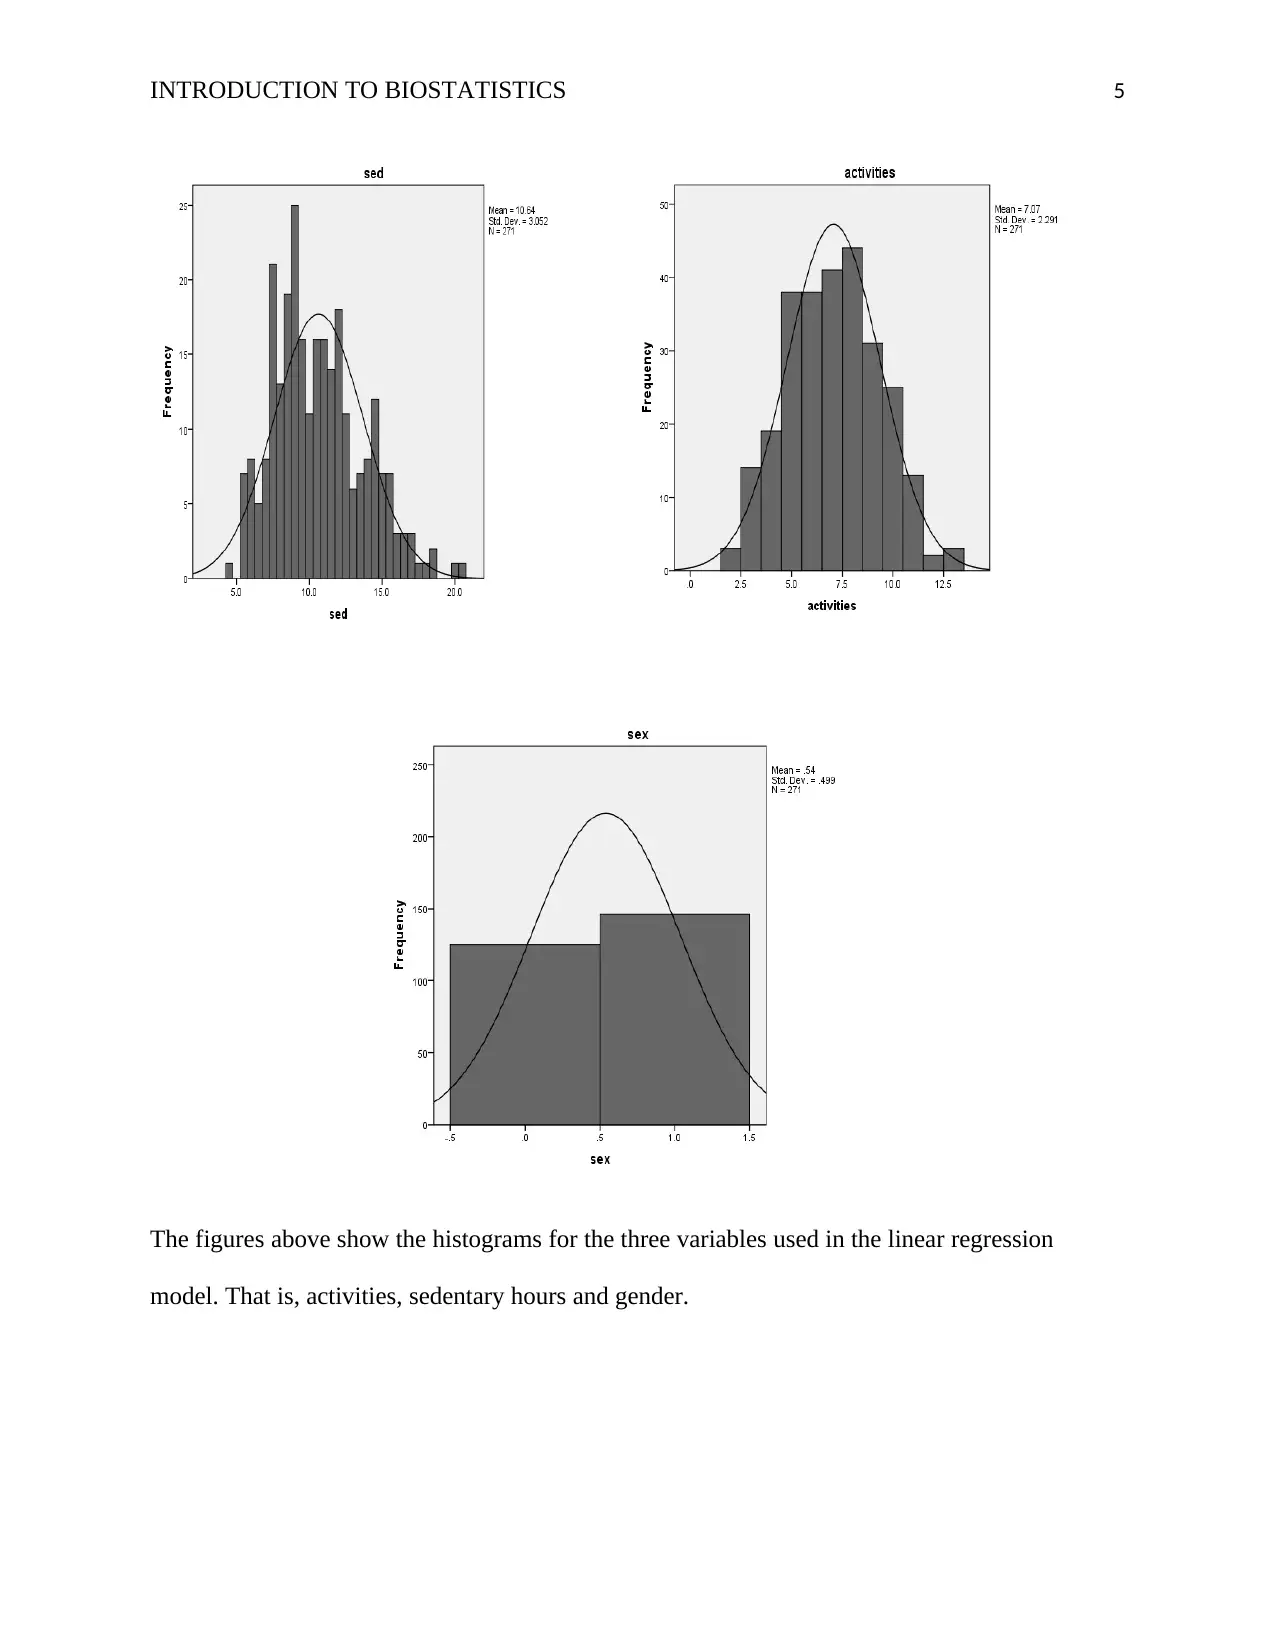
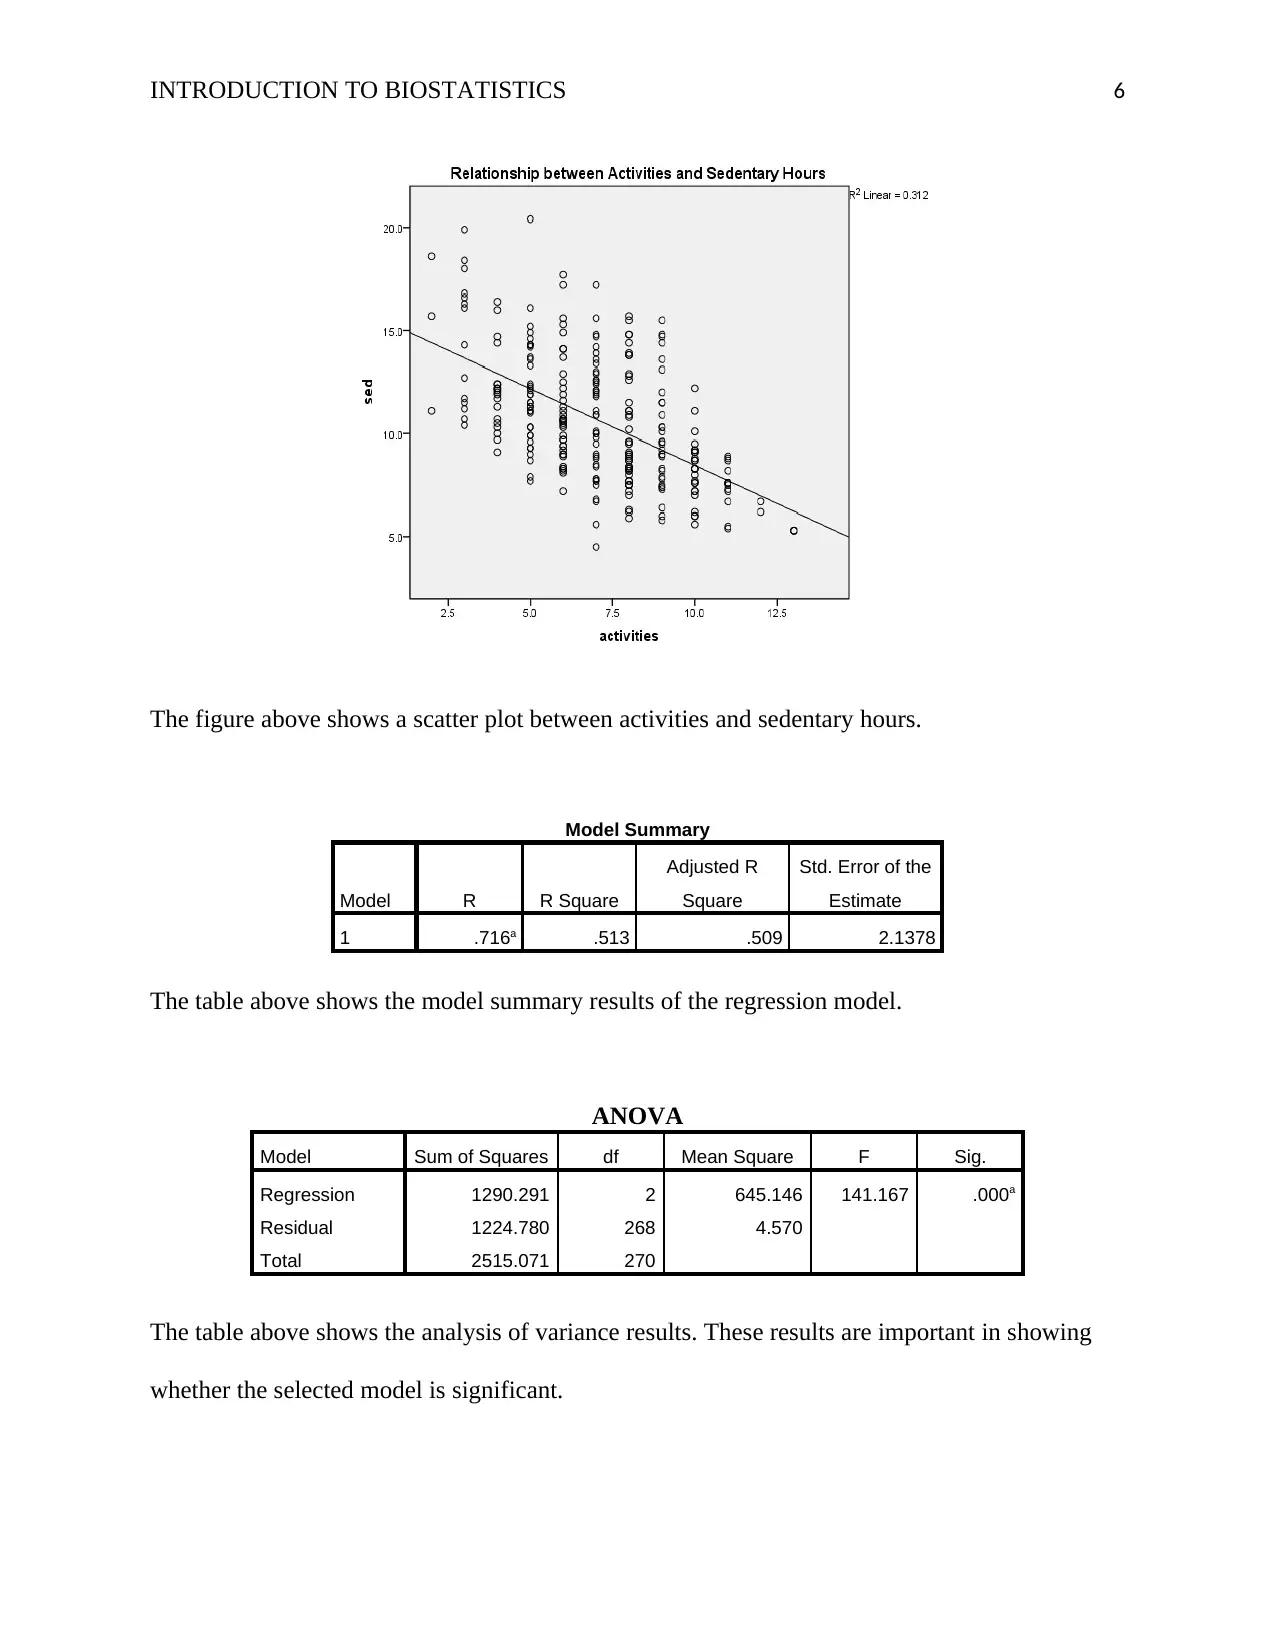
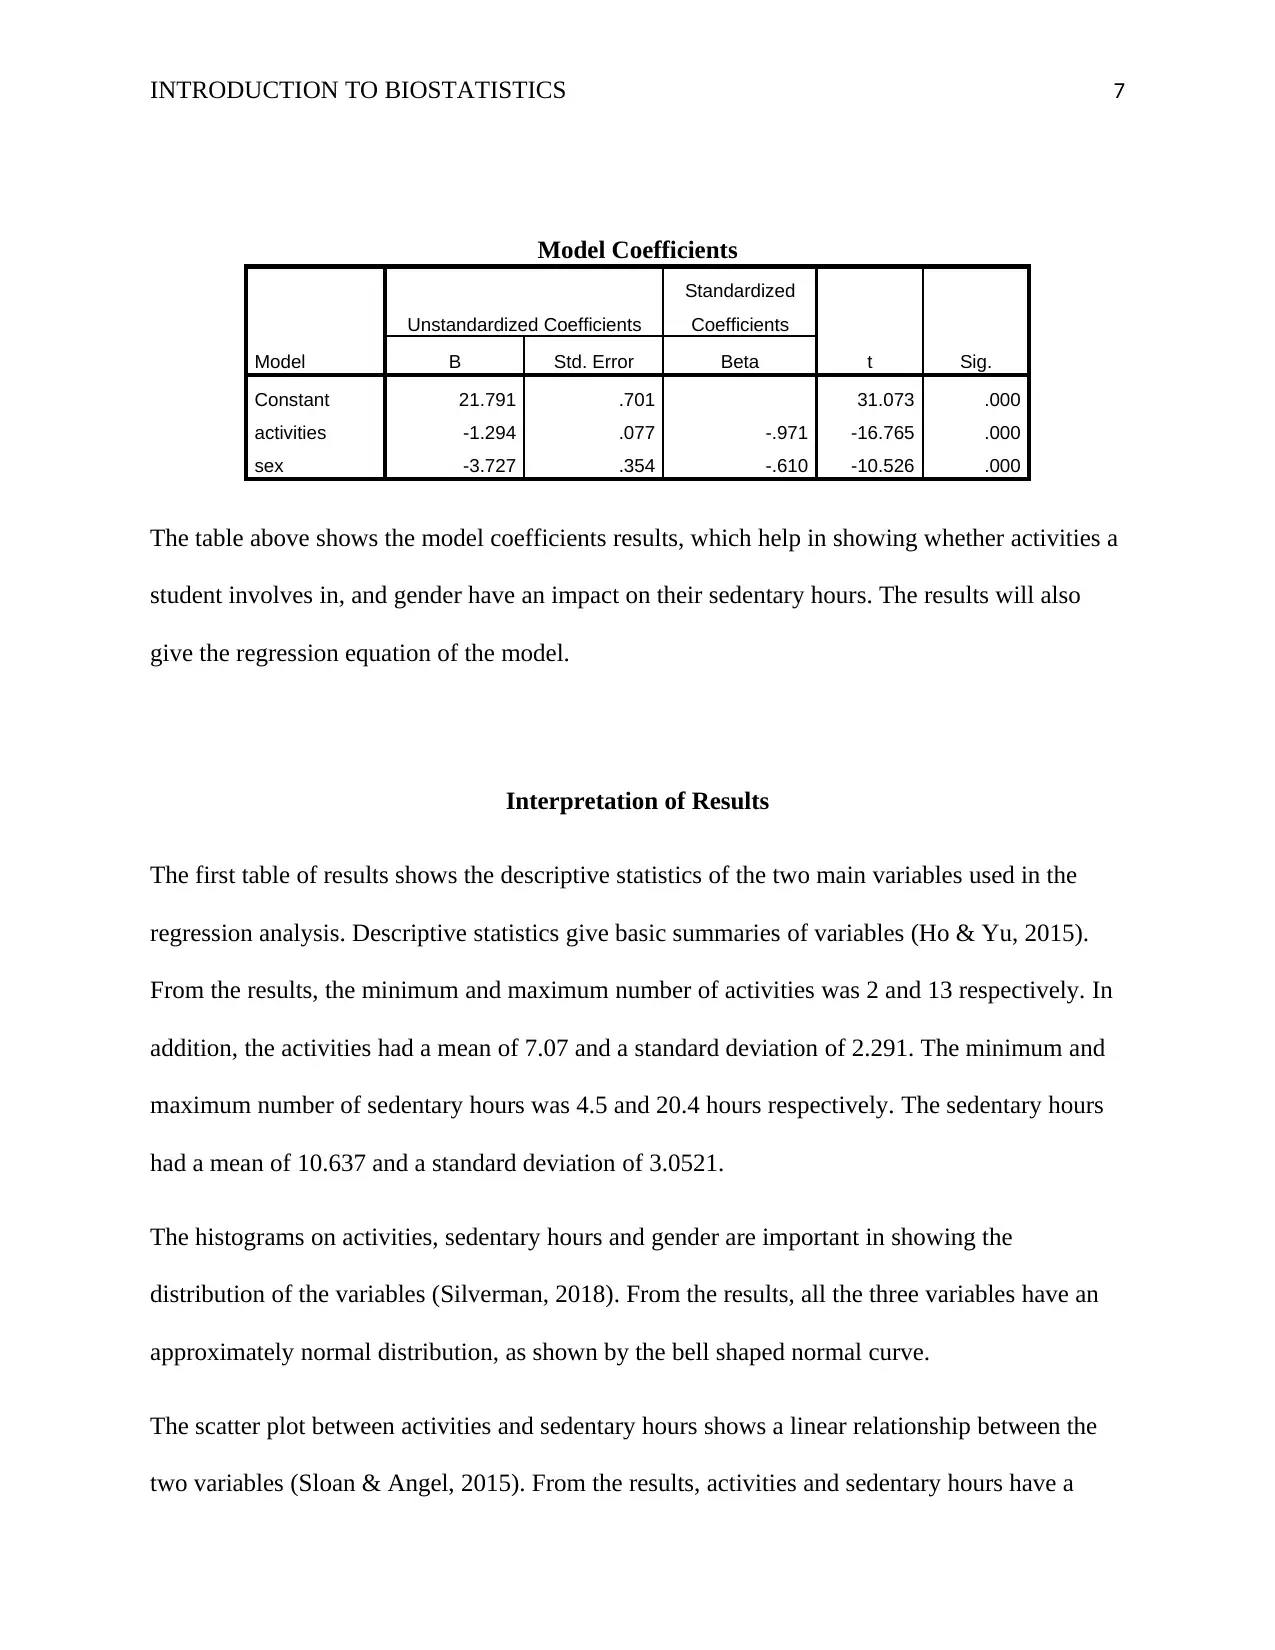
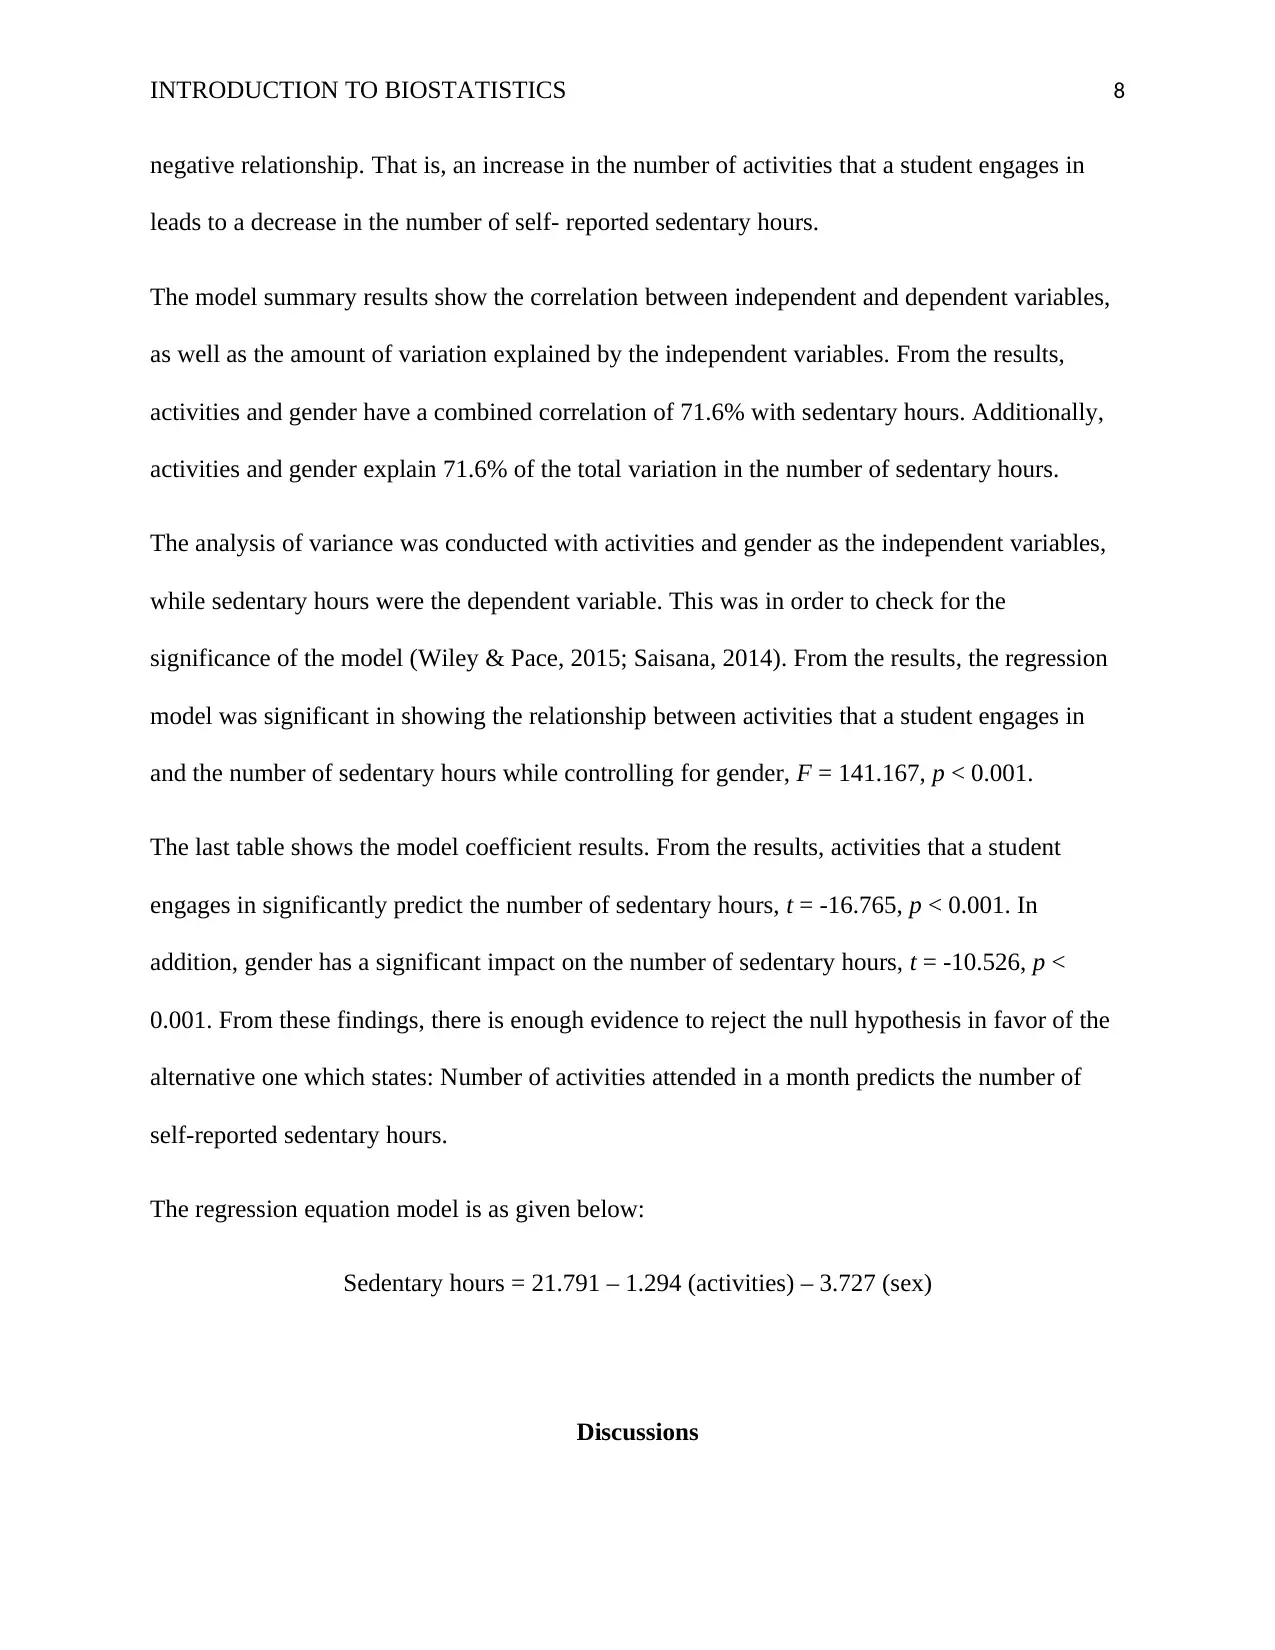
This assignment provides a comprehensive analysis of biostatistics, starting with a critical review of a research study on transport activities among youths in New Zealand using the STROBE checklist, focusing on the statistical methods and reporting. The review assesses the study's sample size, data analysis techniques (descriptive and inferential), handling of missing values, and response rates. The assignment further includes a regression analysis using R software to investigate the relationship between activities attended and sedentary hours, controlling for gender. The analysis includes descriptive statistics, histograms, scatter plots, ANOVA, and model coefficients, interpreting the results to determine the significance of the model and the impact of activities and gender on sedentary hours. The findings support the hypothesis that the number of activities attended predicts sedentary hours, leading to the rejection of the null hypothesis. Desklib offers a wealth of similar solved assignments and past papers for students.
tabler-icon-diamond-filled.svg

Contribute Materials

Your contribution can guide someone’s learning journey. Share your documents today.
Document Page
Running head: INTRODUCTION TO BIOSTATISTICS 1
Introduction to Biostatistics
Name:
Institution:
tabler-icon-diamond-filled.svg

Secure Best Marks with AI Grader

Need help grading? Try our AI Grader for instant feedback on your assignments.
Document Page
INTRODUCTION TO BIOSTATISTICS 2
Question 1: Study Review
This paper seeks to critically analyze a research study on transport activities connected with
youths in New Zealand (Ward, McGee, Freeman, Gendall, & Cameron, 2018).
Review against Items 10, 12-17 of the STROBE Checklist
In order to achieve the desired sample size, secondary schools were targeted in order to access
respondents with the age of interest in this case. 775 respondents participated in the study.
Data analysis involved descriptive analysis and inferential analysis. On descriptive analysis,
means, minimum, maximum and standard deviations were calculated and reported. On
inferential statistics, independent (unpaired) sample t-tests and chi- square tests were conducted.
The missing values in the captured data were included from the analysis. 82 percent of the study
participants provided complete responses to the survey questions, while the remaining 16 percent
had incomplete responses.
A pilot study was conducted on the same number of schools as those considered in the main
study. This study was not conducted in stages. The pilot study was key in improving the data
collection instruments. The response rate for the actual study was 71.5 percent (the 775
participants). Teenagers who participated in the class survey had a response rate of 77.2%, while
those who took the survey at home had a response rate of 65.6%. This response rate is high
enough, thus the results obtained were reliable. From the report, the number of females with
missing data was twice the number of males. This was because the male respondents chose to
participate in the survey in class, rather than answer the questions at home. Survey in class had a
higher response rate, since it was more convenient for the students. Answering the survey
questions a home was ineffective due to fatigue.
Document Page
INTRODUCTION TO BIOSTATISTICS 3
From the study, 49 percent were male, while 51% were female. 7.9% were 15 years old, 49.2%
were 16 years, 40.7% were 17 years, and 2.2% were 18 years, while 0.1% of them were 19 years
old. In addition, 71.2% of the respondents were from urban areas and 28.8% from rural areas.
Moreover, 85.1% of the participants were European nationals, while the remaining 14.9% came
from other nations. In addition, 59.7% of the teenagers earned less than 50 dollars per month,
11.8% had an income of between 51 and 99 dollars, while .5% of them earned over 100 dollars
per month.
The chi- square tests conducted showed significant associations between gender and some of the
modes of transport. From the results, it was evident that more male than female students
preferred using bicycles, using skateboards or riding motorcycles. Additionally, more female
than male students preferred taking public or school buses or being passengers in cars. Further
analysis revealed that more male students had driving licenses as compared to their female
colleagues. In addition, t-test results revealed that more male students participated in sporting
activities, while the females were more active in social and cultural events.
Question 2: Regression Analysis using R
Introduction
This section involves linear regression analysis using the R software. The research question in
this case will be: Does the number of activities a student has attended in the past month predict
self-reported sedentary hours per week after correcting for gender? The independent variables in
this case will be will be activities attended and gender. The dependent variable will be sedentary
hours. The research hypothesis is as give below:
Document Page
INTRODUCTION TO BIOSTATISTICS 4
H0: Number of activities attended in a month does not predict the number of self-reported
sedentary hours.
H1: Number of activities attended in a month predicts the number of self-reported sedentary
hours.
The obtained data has a total of 271 respondents. The effect of activities undertaken on sedentary
hours will be checked after controlling for gender.
The codes used in R software are given on the appendix.
Results
Descriptive Statistics
N Minimum Maximum Mean Std. Deviation
activities 271 2 13 7.07 2.291
sed 271 4.5 20.4 10.637 3.0521
The table above shows descriptive statistics for the two main variables of the study (activities
and sedentary hours).
tabler-icon-diamond-filled.svg

Secure Best Marks with AI Grader

Need help grading? Try our AI Grader for instant feedback on your assignments.
Document Page
INTRODUCTION TO BIOSTATISTICS 5
The figures above show the histograms for the three variables used in the linear regression
model. That is, activities, sedentary hours and gender.
Document Page
INTRODUCTION TO BIOSTATISTICS 6
The figure above shows a scatter plot between activities and sedentary hours.
Model Summary
Model R R Square
Adjusted R
Square
Std. Error of the
Estimate
1 .716a .513 .509 2.1378
The table above shows the model summary results of the regression model.
ANOVA
Model Sum of Squares df Mean Square F Sig.
Regression 1290.291 2 645.146 141.167 .000a
Residual 1224.780 268 4.570
Total 2515.071 270
The table above shows the analysis of variance results. These results are important in showing
whether the selected model is significant.
Document Page
INTRODUCTION TO BIOSTATISTICS 7
Model Coefficients
Model
Unstandardized Coefficients
Standardized
Coefficients
t Sig.B Std. Error Beta
Constant 21.791 .701 31.073 .000
activities -1.294 .077 -.971 -16.765 .000
sex -3.727 .354 -.610 -10.526 .000
The table above shows the model coefficients results, which help in showing whether activities a
student involves in, and gender have an impact on their sedentary hours. The results will also
give the regression equation of the model.
Interpretation of Results
The first table of results shows the descriptive statistics of the two main variables used in the
regression analysis. Descriptive statistics give basic summaries of variables (Ho & Yu, 2015).
From the results, the minimum and maximum number of activities was 2 and 13 respectively. In
addition, the activities had a mean of 7.07 and a standard deviation of 2.291. The minimum and
maximum number of sedentary hours was 4.5 and 20.4 hours respectively. The sedentary hours
had a mean of 10.637 and a standard deviation of 3.0521.
The histograms on activities, sedentary hours and gender are important in showing the
distribution of the variables (Silverman, 2018). From the results, all the three variables have an
approximately normal distribution, as shown by the bell shaped normal curve.
The scatter plot between activities and sedentary hours shows a linear relationship between the
two variables (Sloan & Angel, 2015). From the results, activities and sedentary hours have a
tabler-icon-diamond-filled.svg

Paraphrase This Document

Need a fresh take? Get an instant paraphrase of this document with our AI Paraphraser
Document Page
INTRODUCTION TO BIOSTATISTICS 8
negative relationship. That is, an increase in the number of activities that a student engages in
leads to a decrease in the number of self- reported sedentary hours.
The model summary results show the correlation between independent and dependent variables,
as well as the amount of variation explained by the independent variables. From the results,
activities and gender have a combined correlation of 71.6% with sedentary hours. Additionally,
activities and gender explain 71.6% of the total variation in the number of sedentary hours.
The analysis of variance was conducted with activities and gender as the independent variables,
while sedentary hours were the dependent variable. This was in order to check for the
significance of the model (Wiley & Pace, 2015; Saisana, 2014). From the results, the regression
model was significant in showing the relationship between activities that a student engages in
and the number of sedentary hours while controlling for gender, F = 141.167, p < 0.001.
The last table shows the model coefficient results. From the results, activities that a student
engages in significantly predict the number of sedentary hours, t = -16.765, p < 0.001. In
addition, gender has a significant impact on the number of sedentary hours, t = -10.526, p <
0.001. From these findings, there is enough evidence to reject the null hypothesis in favor of the
alternative one which states: Number of activities attended in a month predicts the number of
self-reported sedentary hours.
The regression equation model is as given below:
Sedentary hours = 21.791 – 1.294 (activities) – 3.727 (sex)
Discussions
Document Page
INTRODUCTION TO BIOSTATISTICS 9
Data analysis involved descriptive and inferential analysis, whose results were reported in tables
and figures. From the results, it was evident that the number of activities that a student engaged
in the prior month predicted the number of self- reported sedentary hours after controlling for
gender.
References
Document Page
INTRODUCTION TO BIOSTATISTICS 10
Ho, A. D., & Yu, C. C. (2015). Descriptive statistics for modern test score distributions:
Skewness, kurtosis, discreteness, and ceiling effects. Educational and Psychological
Measurement, 75(3), 365-388.
Ward, A. L., McGee, R., Freeman, C., Gendall, P. J., & Cameron, C. (2018). Transport
behaviours among older teenagers from semi‐rural New Zealand. Australian and New
Zealand journal of public health, 42(4), 340-346.
Wiley, J. F., & Pace, L. A. (2015). Analysis of variance. In Beginning R. Apress, Berkeley, CA,
111–120.
Saisana, M. (2014). Analysis of Variance. Encyclopedia of Quality of Life and Well-Being
Research. Canada: Springer. 162-165.
Silverman, B. W. (2018). Density estimation for statistics and data analysis. London: Routledge.
2(1), 175-193.
Sloan, L., & Angell, R. (2015). Two-way scatter plot and the UK Living Cost and Food Survey
(2010): Household income and expenditure. SAGE Publications Ltd, 59-68.
Appendix
tabler-icon-diamond-filled.svg

Secure Best Marks with AI Grader

Need help grading? Try our AI Grader for instant feedback on your assignments.
Document Page
INTRODUCTION TO BIOSTATISTICS 11
R- Codes
setwd("C:/Users/admin/Documents/Assignment/Biostatistics") #setting working directory
data<-read.table("datafor18867653.Rdata") #reading data
data
names (data) #getting variable names
model<-lm(formula=sed~activities+sex, data=data) #regression model
model
summary(model) #model summary statistics
hist(sed)
hist(activities)
hist(sex)
plot(activities, sed, main = "Relationship between Activities andSedentary Hours",
xlab = "activities", ylab = "sed")
chevron_up_icon
1 out of 11
circle_padding
hide_on_mobile
zoom_out_icon
logo.png

Your All-in-One AI-Powered Toolkit for Academic Success.

Available 24*7 on WhatsApp / Email

[object Object]