Understanding Sample Size and Statistical Concepts in Biostatistics
VerifiedAdded on 2022/11/28
|11
|681
|355
Homework Assignment
AI Summary
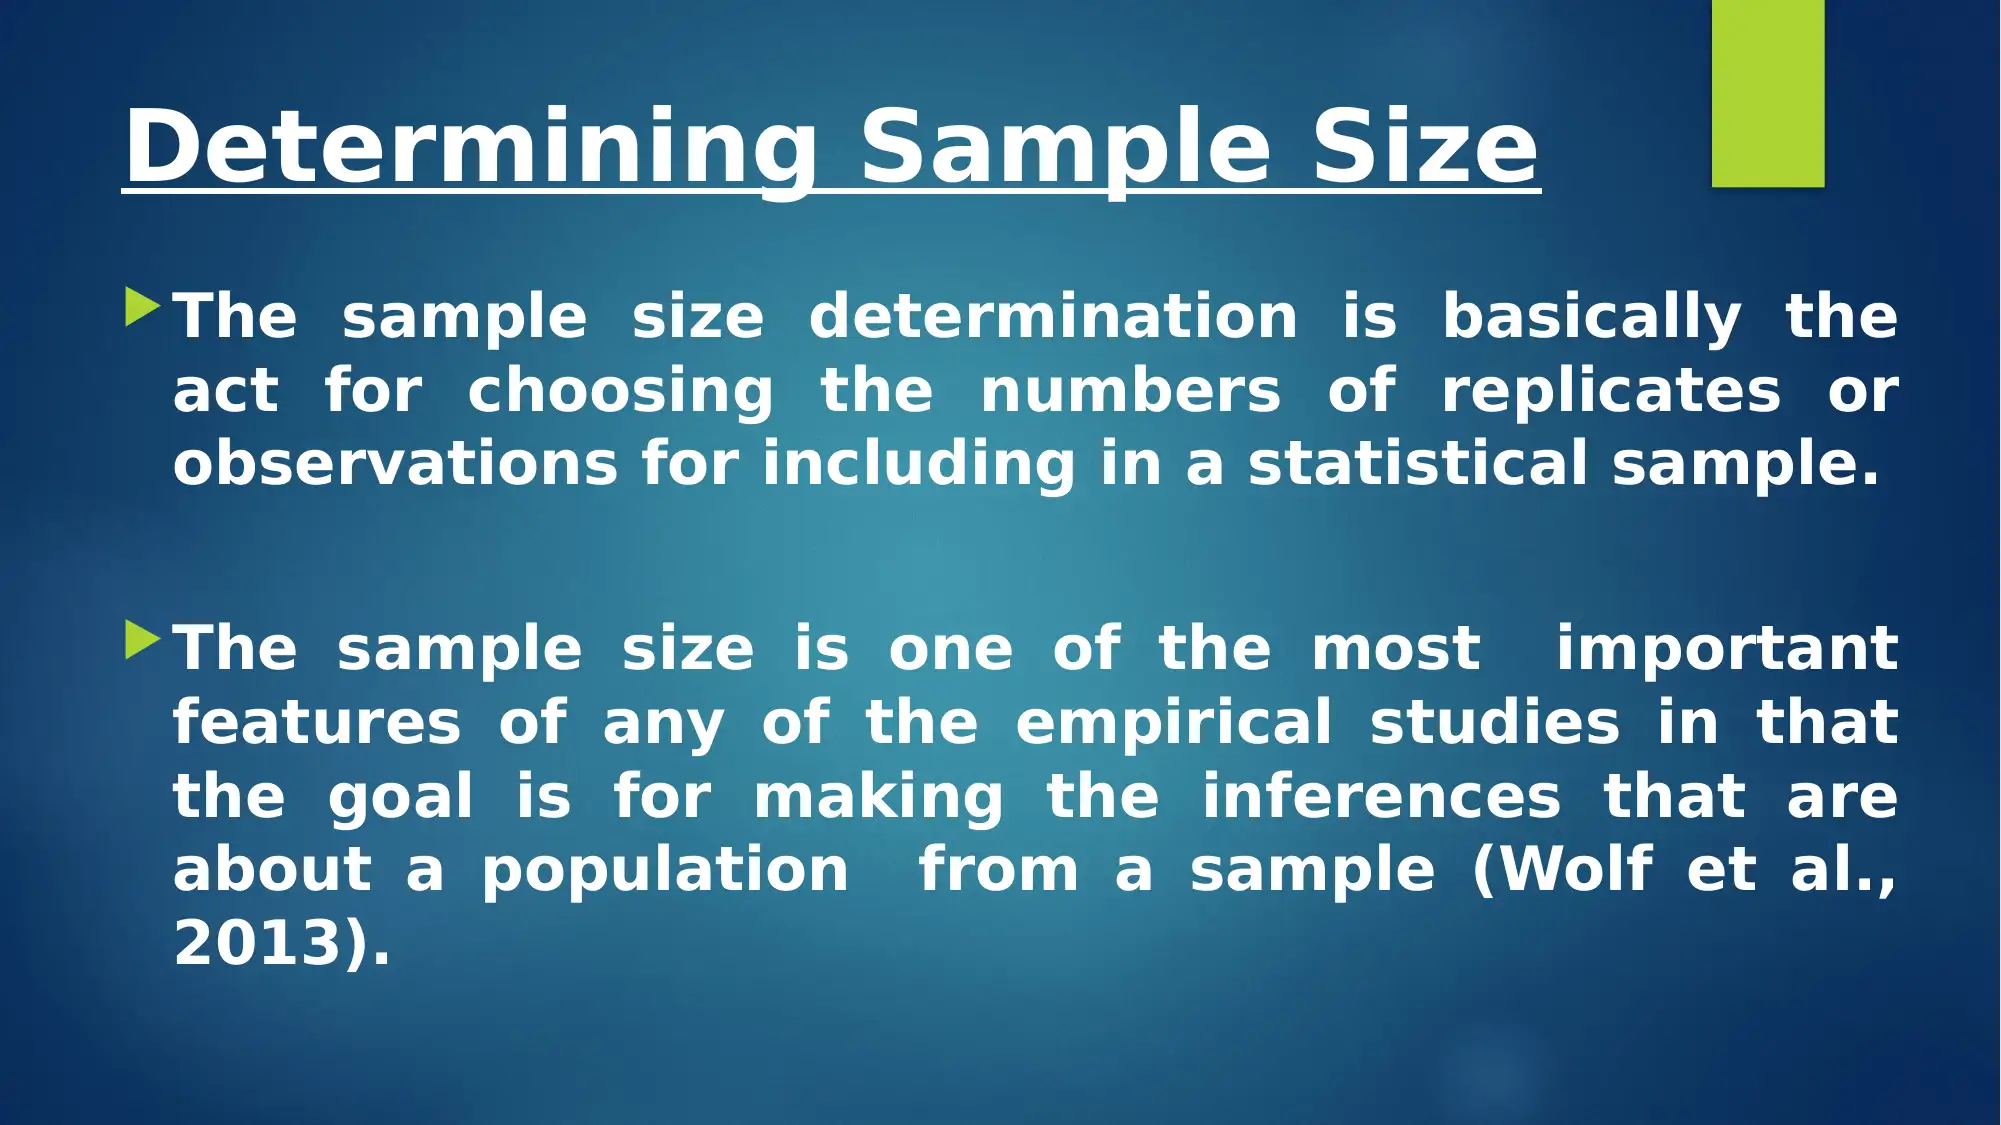
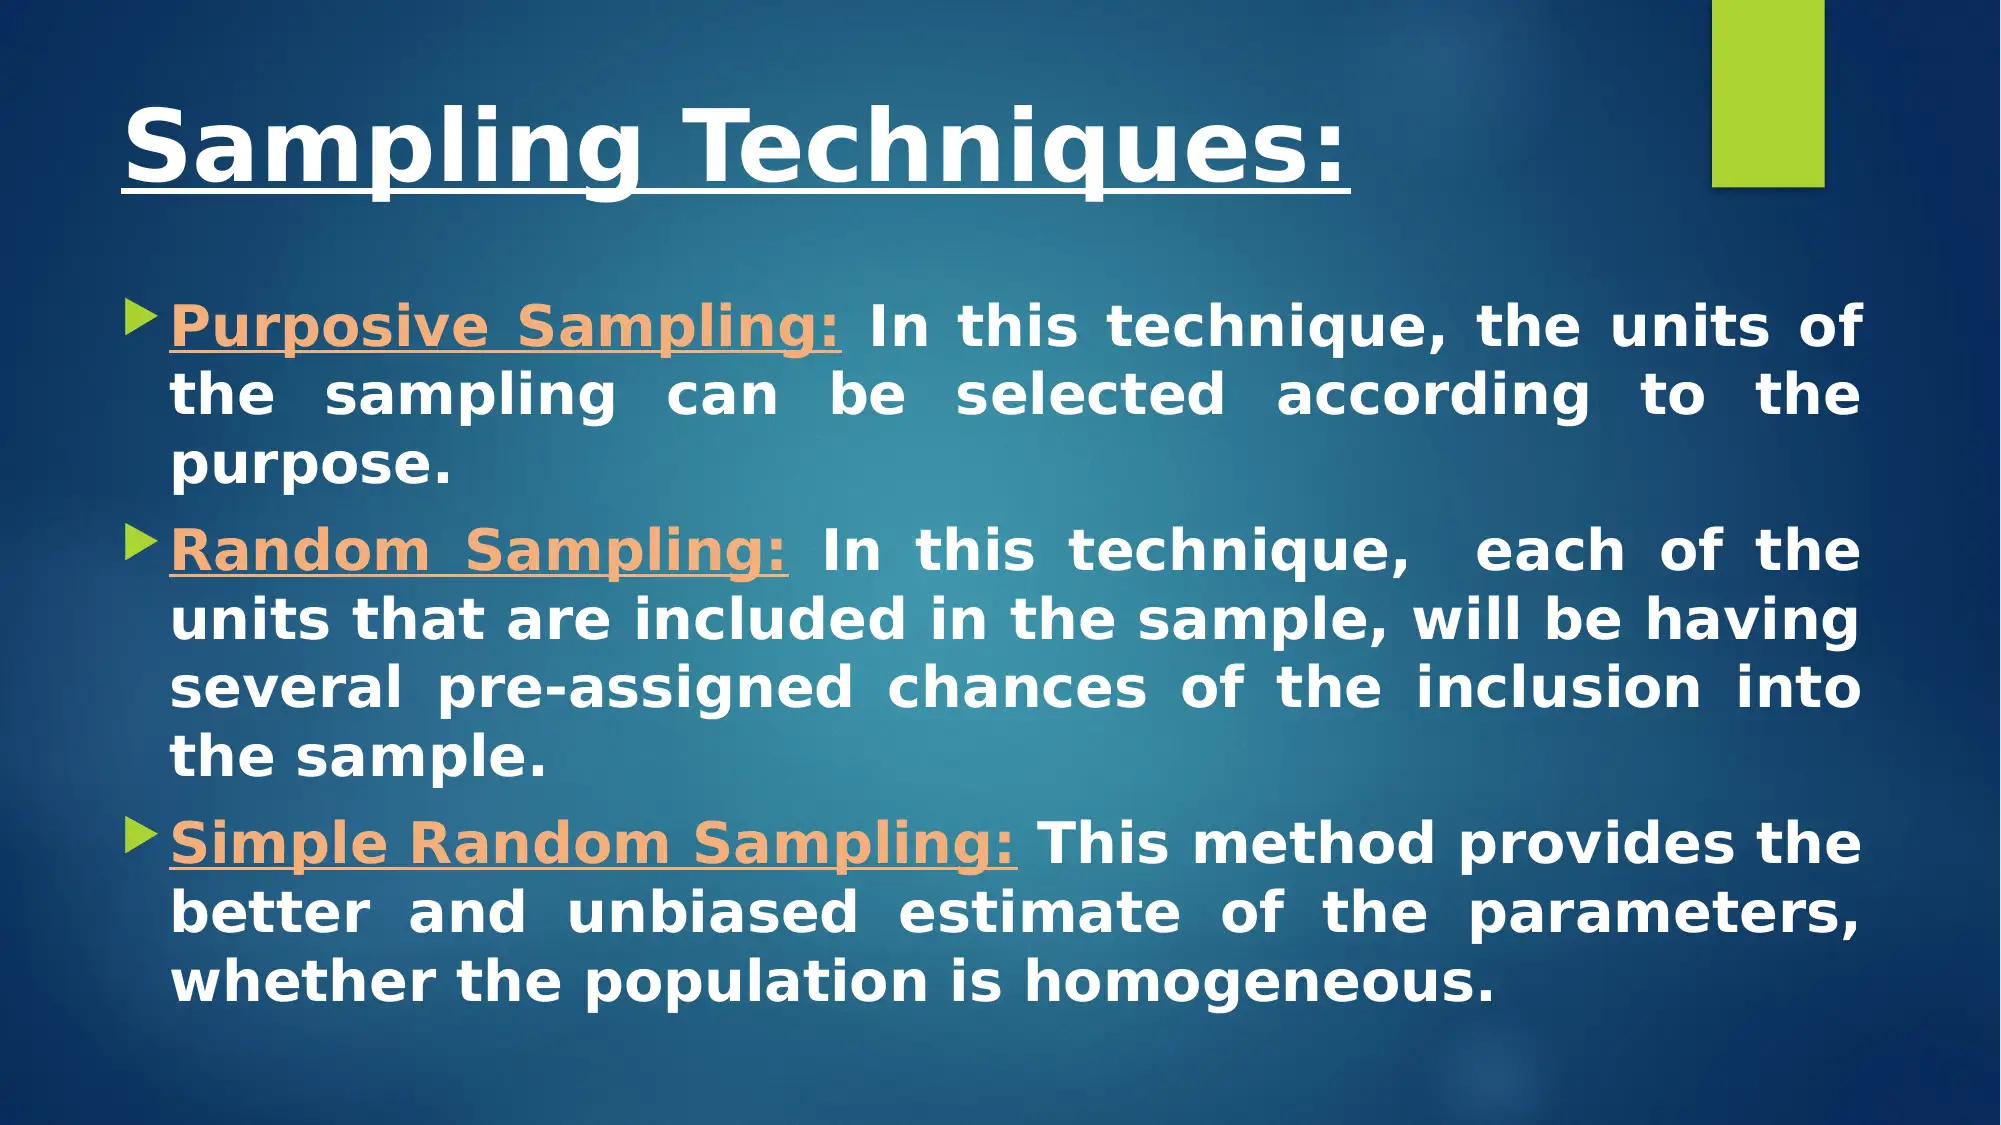
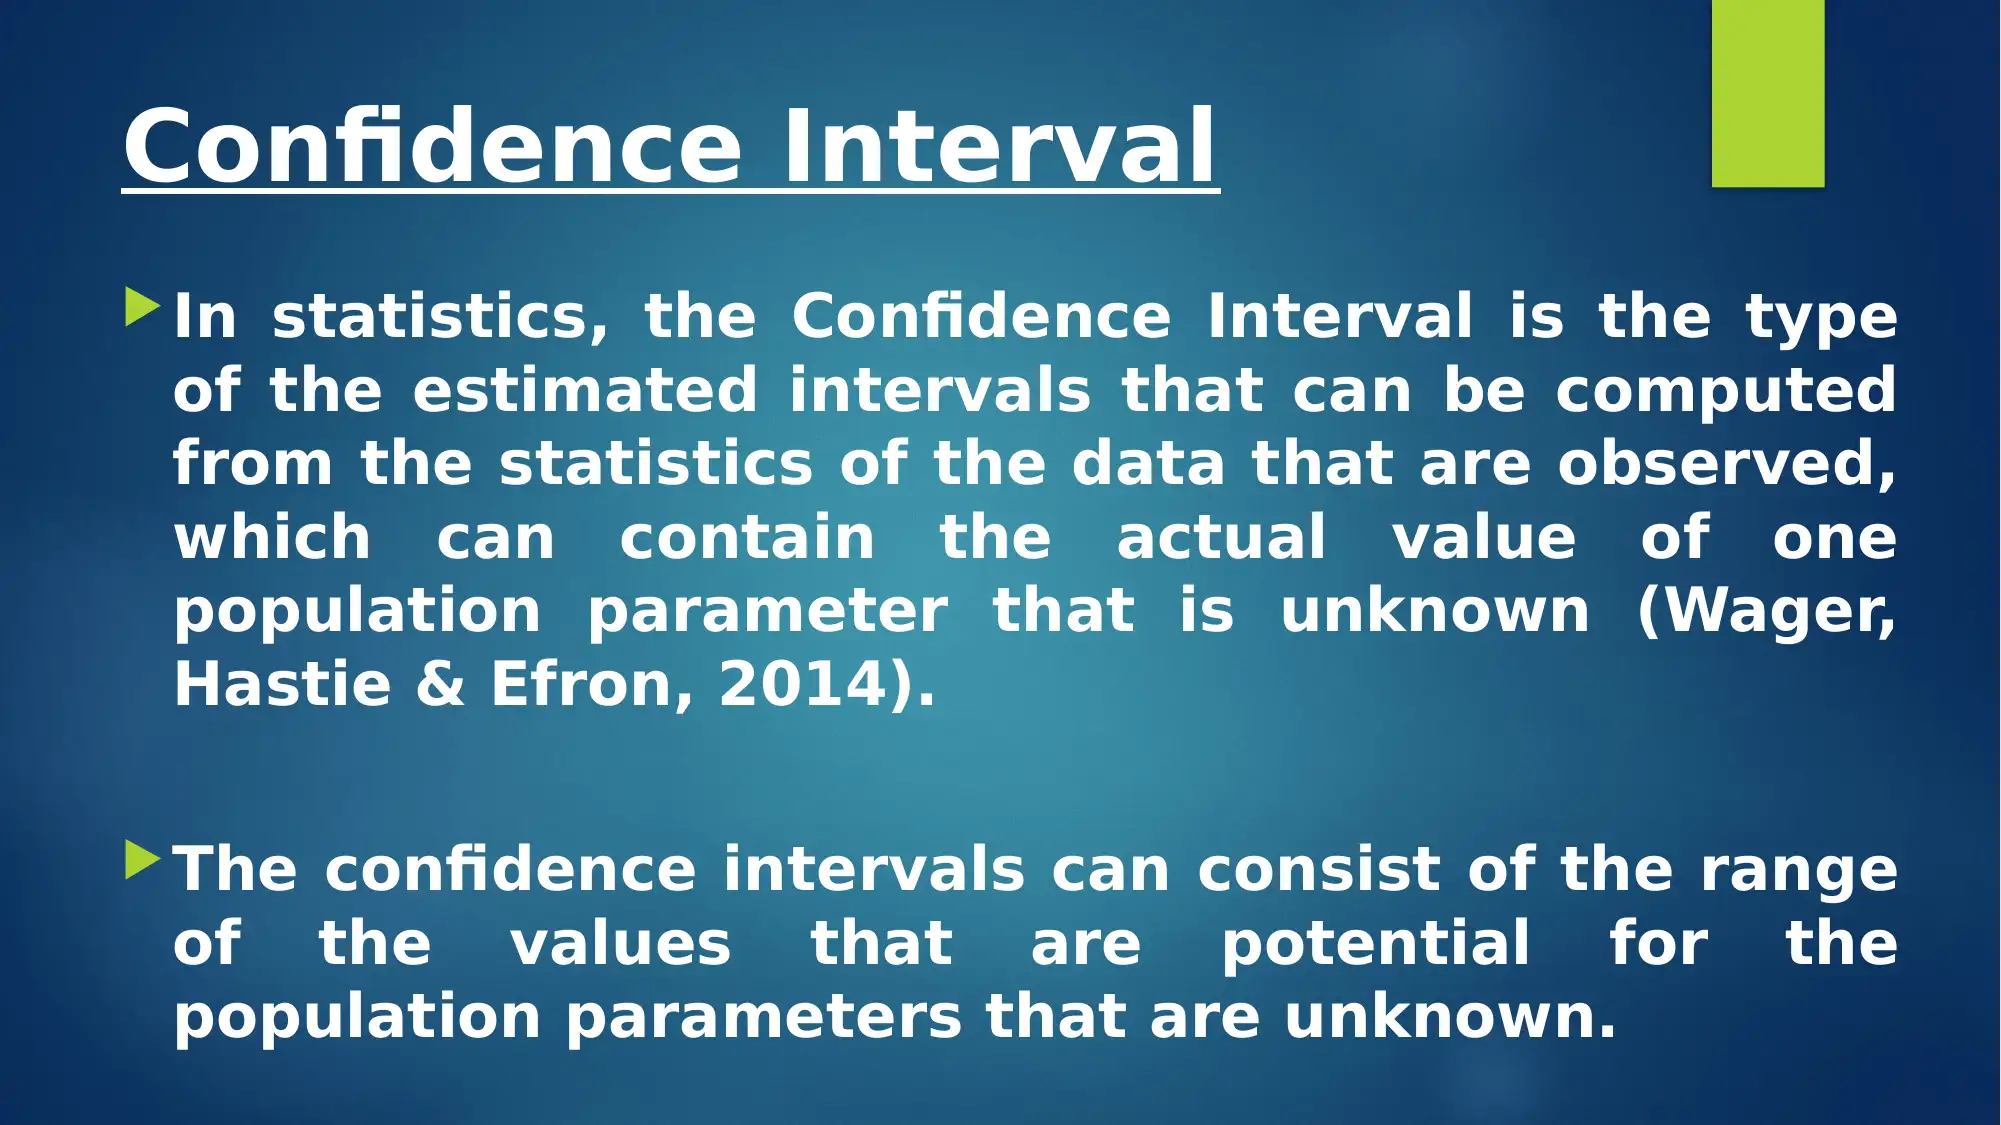
This assignment delves into the core concepts of biostatistics, focusing on sample size determination and its importance in drawing inferences from a sample to a population. It explores various sampling techniques, including purposive and random sampling, and explains the significance of confidence intervals in estimating population parameters. The assignment also covers point estimates, standard error, and confidence levels, providing a comprehensive understanding of statistical analysis. Furthermore, it addresses the concept of the margin of error, crucial for interpreting survey results and observational errors. The assignment includes references to relevant research papers, offering a solid foundation in applied biostatistics.

APPLIED
BIOSTATISTICS
NAME OF THE STUDENT
NAME OF THE UNIVERSITY
BIOSTATISTICS
NAME OF THE STUDENT
NAME OF THE UNIVERSITY
Paraphrase This Document
Need a fresh take? Get an instant paraphrase of this document with our AI Paraphraser

Determining Sample Size
The sample size determination is basically the
act for choosing the numbers of replicates or
observations for including in a statistical sample.
The sample size is one of the most important
features of any of the empirical studies in that
the goal is for making the inferences that are
about a population from a sample (Wolf et al.,
2013).

Sampling Techniques:
Purposive Sampling: In this technique, the units of
the sampling can be selected according to the
purpose.
Random Sampling: In this technique, each of the
units that are included in the sample, will be having
several pre-assigned chances of the inclusion into
the sample.
Simple Random Sampling: This method provides the
better and unbiased estimate of the parameters,
whether the population is homogeneous.
⊘ This is a preview!⊘
Do you want full access?
Subscribe today to unlock all pages.

Trusted by 1+ million students worldwide

Example
Paraphrase This Document
Need a fresh take? Get an instant paraphrase of this document with our AI Paraphraser

Confidence Interval
In statistics, the Confidence Interval is the type
of the estimated intervals that can be computed
from the statistics of the data that are observed,
which can contain the actual value of one
population parameter that is unknown (Wager,
Hastie & Efron, 2014).
The confidence intervals can consist of the range
of the values that are potential for the
population parameters that are unknown.

Point estimate
In statistics, the point estimation can involve the
utilization of the sample data for calculating a
single value that is for serving as s ‘best
estimate’ or ‘best guess’ of a population
parameter that is unknown.
The point estimation is able to be contrasted
with the interval estimation. The interval
estimates are credible interval or the confidence
intervals.
⊘ This is a preview!⊘
Do you want full access?
Subscribe today to unlock all pages.

Trusted by 1+ million students worldwide

Standard error
In statistics, the standard error is the deviation
that is standard for the sampling distribution of
it or an estimation of the deviation that is
standard.
The relation between the standard deviation and
standard error is, for a sample size that is given,
the standard deviation is equaled by the
standard error through dividing by the square
root of the sample size (Bressan et al., 2016).
Paraphrase This Document
Need a fresh take? Get an instant paraphrase of this document with our AI Paraphraser

Confidence level
In the survey sampling, the various samples
can be selected randomly from the similar
population as well as each of the samples
might often produce the confidence interval.
A confidence level can be refer to the
percentage of all of the sample that are
possible which can be expected for including
the actual population parameter.

Margin of error
In statistics, the margin of error is one of the
statistic expression of the amount of the
sampling error in the results of the survey
that can be random.
This term margin of error is used often in the
non survey contexts for indicating the
observational errors to report the quantities
that are measured.
⊘ This is a preview!⊘
Do you want full access?
Subscribe today to unlock all pages.

Trusted by 1+ million students worldwide

References:
Wolf, E. J., Harrington, K. M., Clark, S. L., & Miller, M. W. (2013). Sample size
requirements for structural equation models: An evaluation of power, bias, and
solution propriety. Educational and psychological measurement, 73(6), 913-934.
Wager, S., Hastie, T., & Efron, B. (2014). Confidence intervals for random forests:
The jackknife and the infinitesimal jackknife. The Journal of Machine Learning
Research, 15(1), 1625-1651.
Bressan, M., El Basri, Y., Galeano, A. G., & Alonso, C. (2016). A shadow fault
detection method based on the standard error analysis of IV curves. Renewable
energy, 99, 1181-1190.
Di Maria, F., & Micale, C. (2014). What is the acceptable margin of error for the
oxygen uptake method in evaluating the reactivity of organic waste?. Waste
management, 34(8), 1356-1361.
Paraphrase This Document
Need a fresh take? Get an instant paraphrase of this document with our AI Paraphraser

1 out of 11
Related Documents

Your All-in-One AI-Powered Toolkit for Academic Success.
+13062052269
info@desklib.com
Available 24*7 on WhatsApp / Email
Unlock your academic potential
Copyright © 2020–2025 A2Z Services. All Rights Reserved. Developed and managed by ZUCOL.