Biostatistics HW8: Statistical Analysis of a Smoking Cessation Trial

Verified

Added on  2023/05/29

|5
|895
|309
Homework Assignment
AI Summary
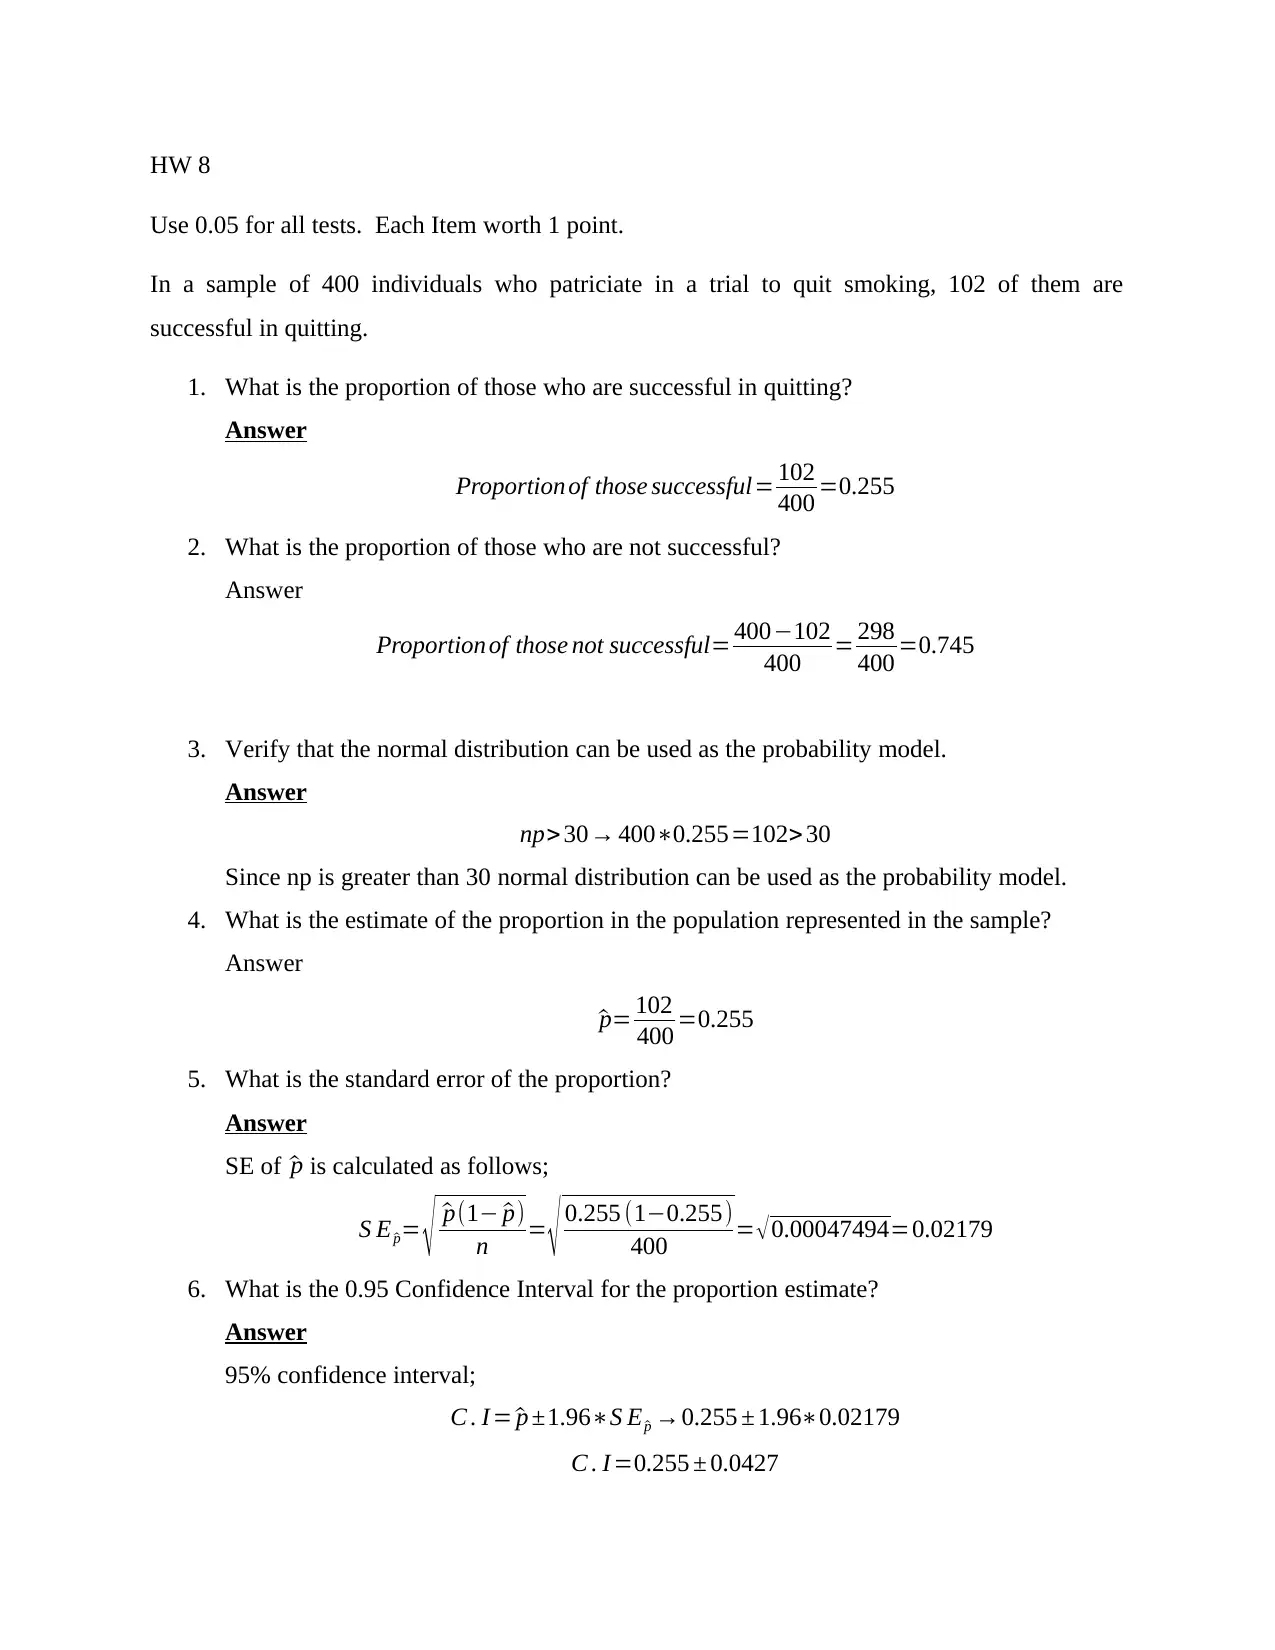
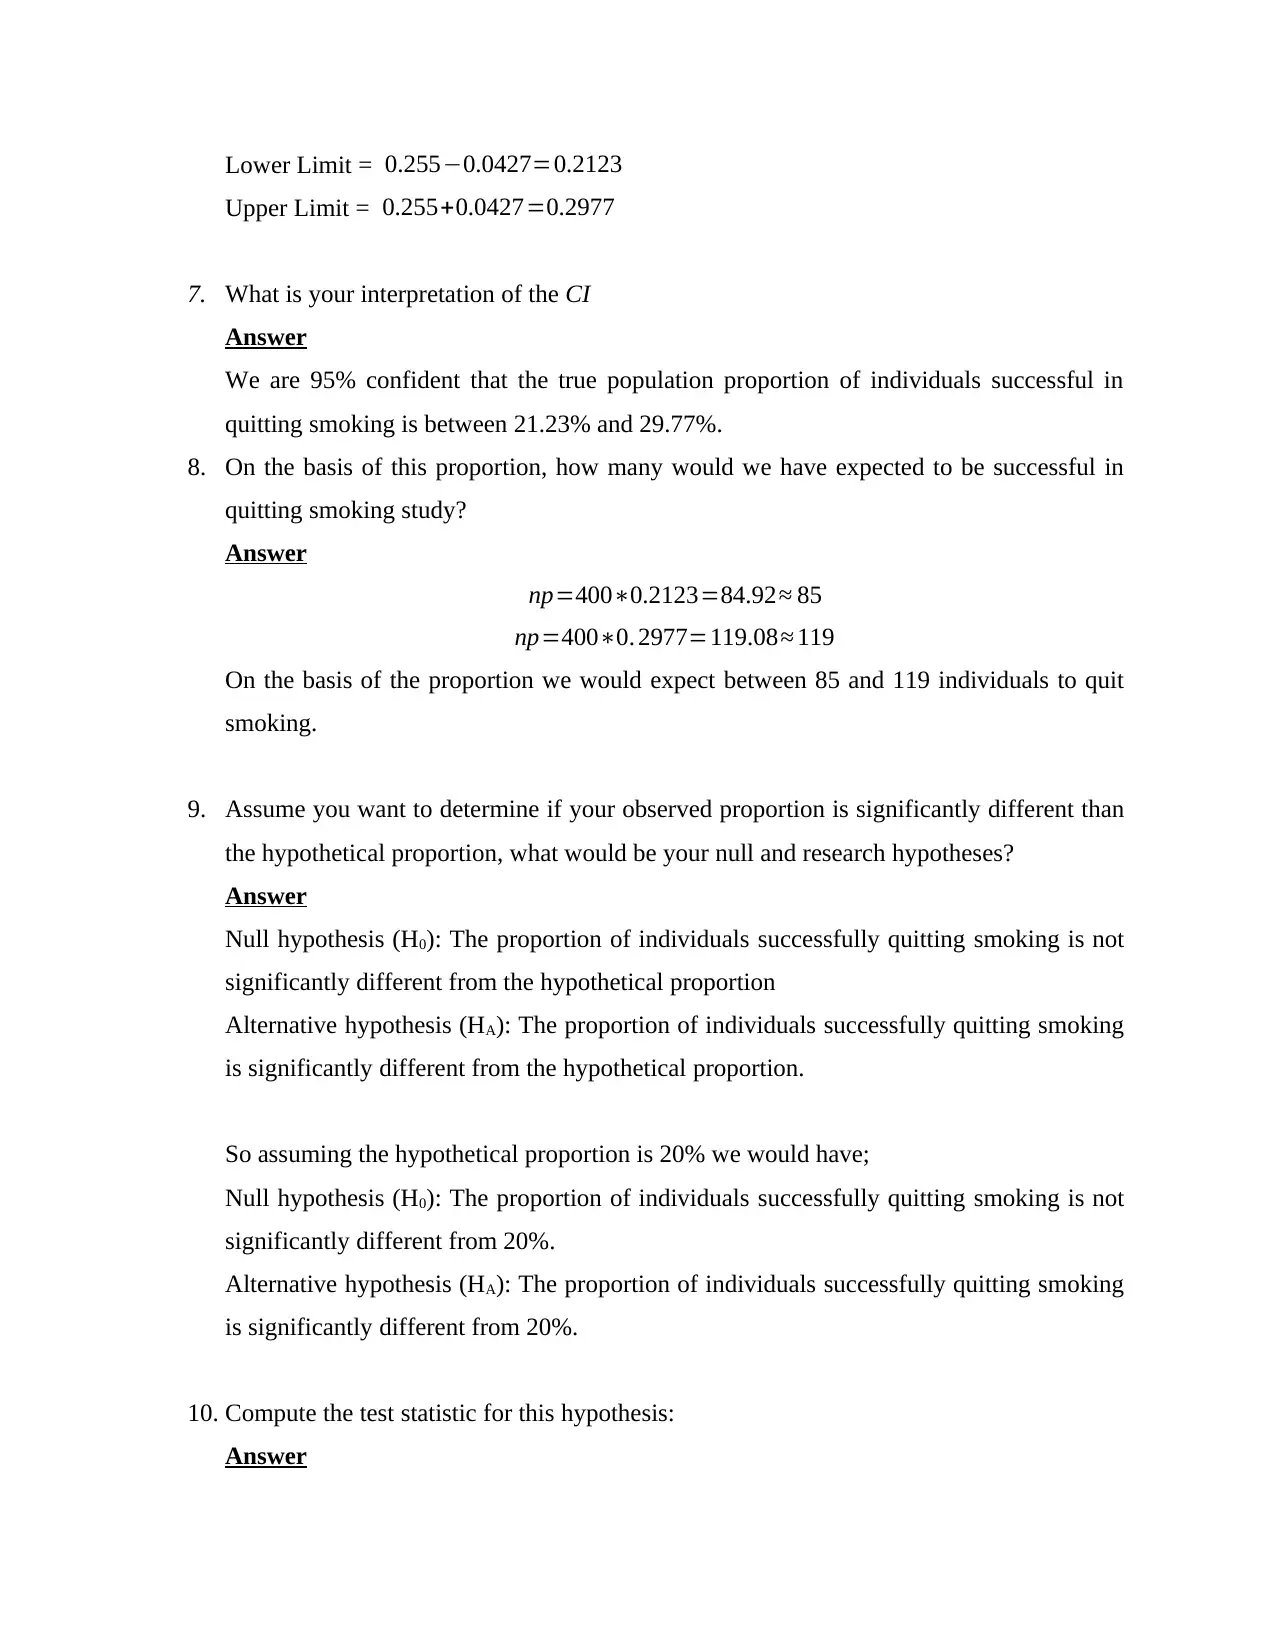
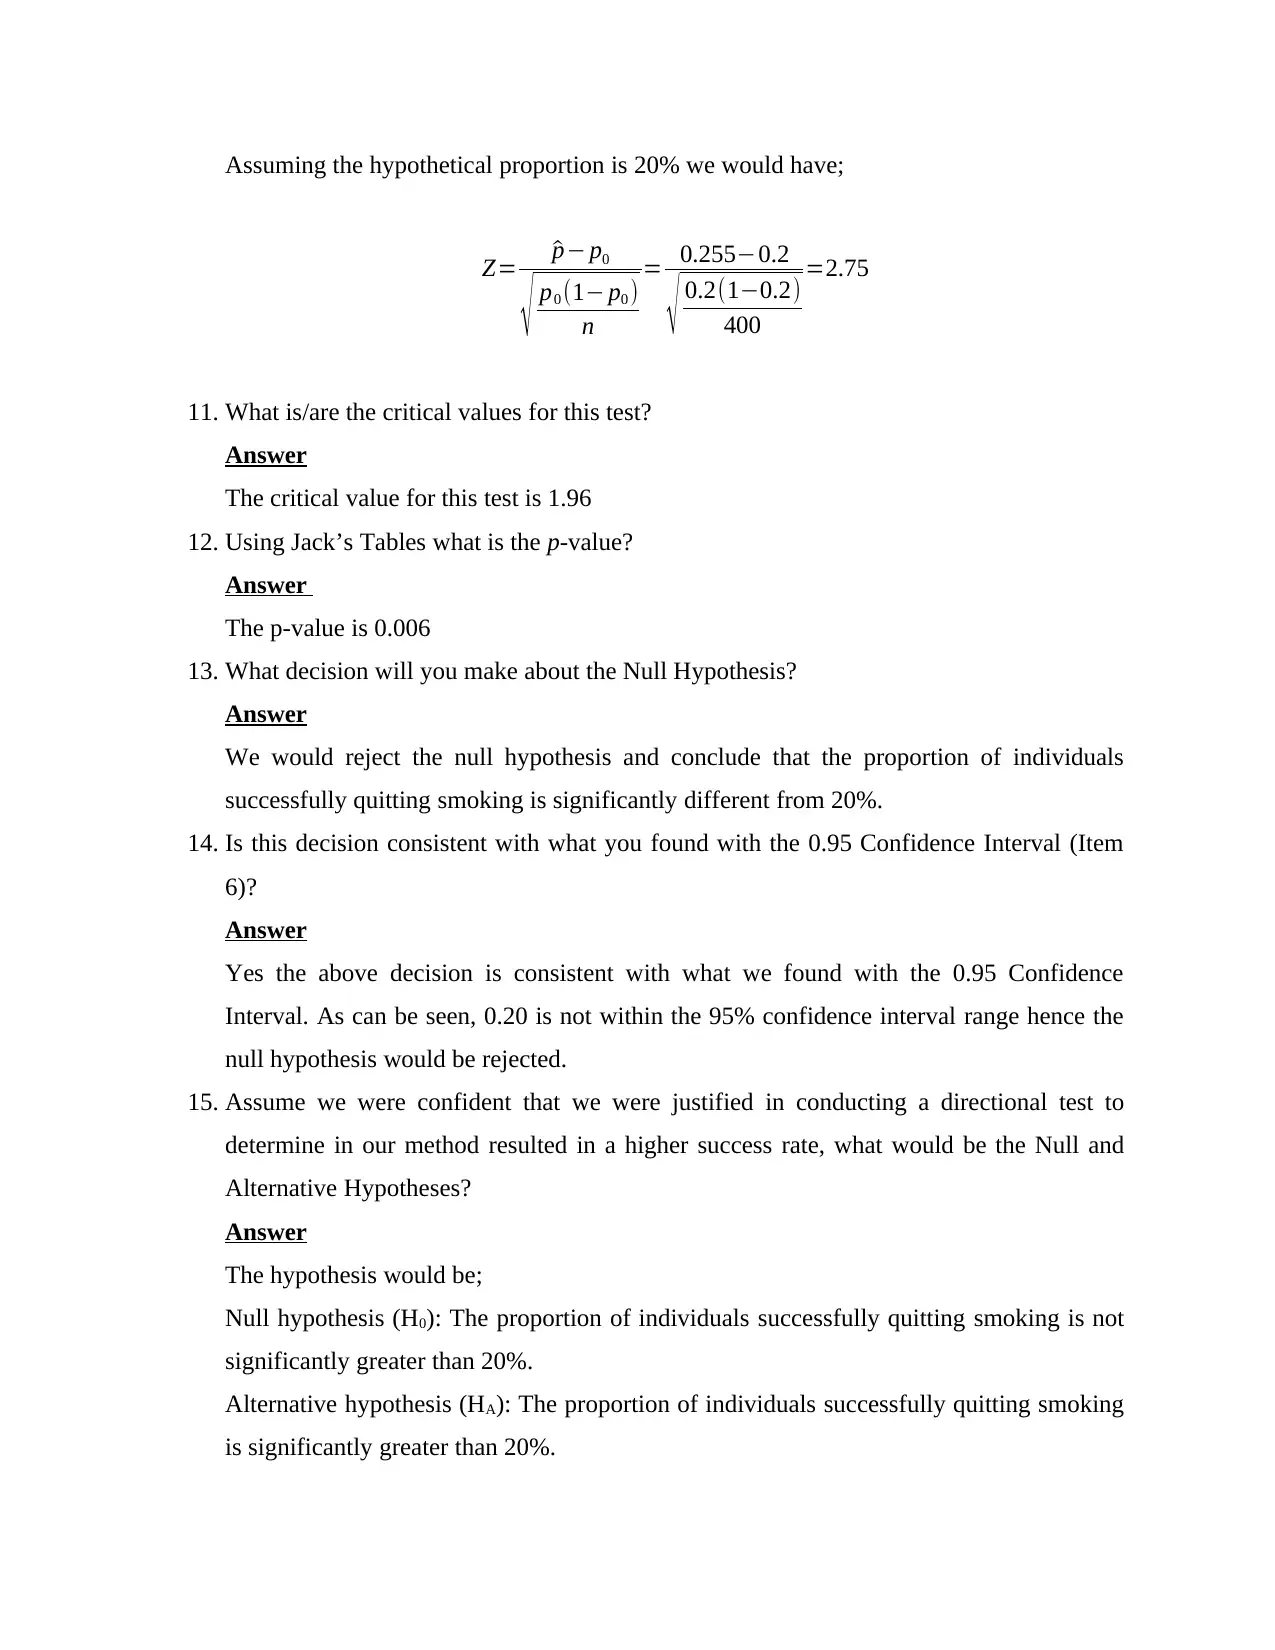
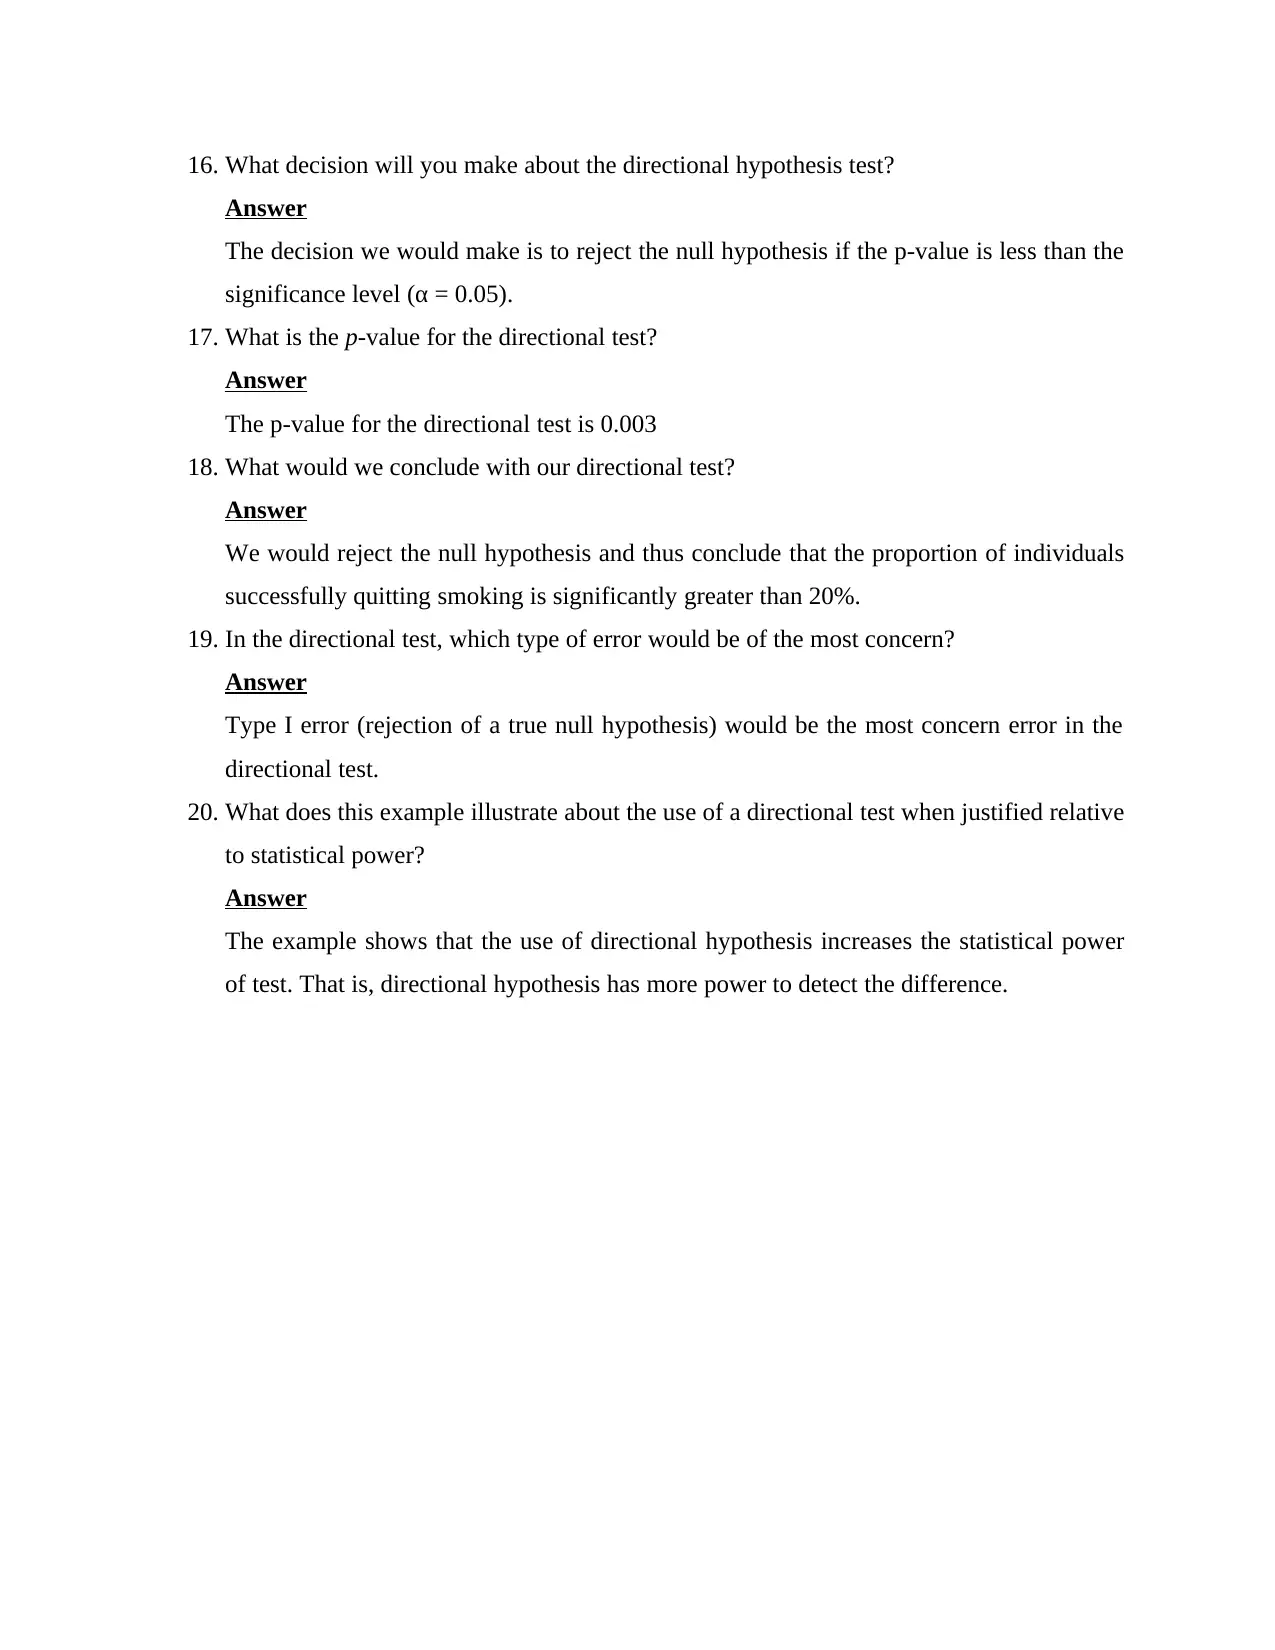
This homework assignment analyzes data from a smoking cessation trial involving 400 individuals. The solution calculates key statistical measures, including the proportion of successful quitters, the proportion of unsuccessful quitters, and verifies the applicability of the normal distribution. It estimates the population proportion, calculates the standard error and constructs a 95% confidence interval for the proportion estimate. The solution also provides an interpretation of the confidence interval. Furthermore, the assignment explores hypothesis testing, including null and alternative hypotheses, computation of the test statistic, determination of critical values, and calculation of the p-value. Decisions regarding the null hypothesis are made based on the p-value and the confidence interval. The assignment considers both two-tailed and directional hypothesis tests, and discusses the implications of these tests, including Type I errors and statistical power. Finally, the solution concludes by interpreting the results and drawing conclusions based on the statistical analyses performed.
tabler-icon-diamond-filled.svg

Contribute Materials

Your contribution can guide someone’s learning journey. Share your documents today.
Document Page
Biostatistics HW8
Student Name:
Instructor Name:
Course Number:
23rd November 2018
tabler-icon-diamond-filled.svg

Secure Best Marks with AI Grader

Need help grading? Try our AI Grader for instant feedback on your assignments.
Document Page
HW 8
Use 0.05 for all tests. Each Item worth 1 point.
In a sample of 400 individuals who patriciate in a trial to quit smoking, 102 of them are
successful in quitting.
1. What is the proportion of those who are successful in quitting?
Answer
Proportion of those successful= 102
400 =0.255
2. What is the proportion of those who are not successful?
Answer
Proportion of those not successful= 400102
400 = 298
400 =0.745
3. Verify that the normal distribution can be used as the probability model.
Answer
np> 30 4000.255=102> 30
Since np is greater than 30 normal distribution can be used as the probability model.
4. What is the estimate of the proportion in the population represented in the sample?
Answer
^p= 102
400 =0.255
5. What is the standard error of the proportion?
Answer
SE of ^p is calculated as follows;
S E ^p= ^p(1 ^p)
n = 0.255 (10.255)
400 = 0.00047494=0.02179
6. What is the 0.95 Confidence Interval for the proportion estimate?
Answer
95% confidence interval;
C . I= ^p ±1.96S E ^p 0.255 ± 1.960.02179
C . I=0.255 ± 0.0427
Document Page
Lower Limit = 0.2550.0427=0.2123
Upper Limit = 0.255+0.0427=0.2977
7. What is your interpretation of the CI
Answer
We are 95% confident that the true population proportion of individuals successful in
quitting smoking is between 21.23% and 29.77%.
8. On the basis of this proportion, how many would we have expected to be successful in
quitting smoking study?
Answer
np=4000.2123=84.92 85
np=4000. 2977=119.08 119
On the basis of the proportion we would expect between 85 and 119 individuals to quit
smoking.
9. Assume you want to determine if your observed proportion is significantly different than
the hypothetical proportion, what would be your null and research hypotheses?
Answer
Null hypothesis (H0): The proportion of individuals successfully quitting smoking is not
significantly different from the hypothetical proportion
Alternative hypothesis (HA): The proportion of individuals successfully quitting smoking
is significantly different from the hypothetical proportion.
So assuming the hypothetical proportion is 20% we would have;
Null hypothesis (H0): The proportion of individuals successfully quitting smoking is not
significantly different from 20%.
Alternative hypothesis (HA): The proportion of individuals successfully quitting smoking
is significantly different from 20%.
10. Compute the test statistic for this hypothesis:
Answer
Document Page
Assuming the hypothetical proportion is 20% we would have;
Z= ^p p0
p0 (1 p0 )
n
= 0.2550.2
0.2(10.2)
400
=2.75
11. What is/are the critical values for this test?
Answer
The critical value for this test is 1.96
12. Using Jack’s Tables what is the p-value?
Answer
The p-value is 0.006
13. What decision will you make about the Null Hypothesis?
Answer
We would reject the null hypothesis and conclude that the proportion of individuals
successfully quitting smoking is significantly different from 20%.
14. Is this decision consistent with what you found with the 0.95 Confidence Interval (Item
6)?
Answer
Yes the above decision is consistent with what we found with the 0.95 Confidence
Interval. As can be seen, 0.20 is not within the 95% confidence interval range hence the
null hypothesis would be rejected.
15. Assume we were confident that we were justified in conducting a directional test to
determine in our method resulted in a higher success rate, what would be the Null and
Alternative Hypotheses?
Answer
The hypothesis would be;
Null hypothesis (H0): The proportion of individuals successfully quitting smoking is not
significantly greater than 20%.
Alternative hypothesis (HA): The proportion of individuals successfully quitting smoking
is significantly greater than 20%.
tabler-icon-diamond-filled.svg

Secure Best Marks with AI Grader

Need help grading? Try our AI Grader for instant feedback on your assignments.
Document Page
16. What decision will you make about the directional hypothesis test?
Answer
The decision we would make is to reject the null hypothesis if the p-value is less than the
significance level (α = 0.05).
17. What is the p-value for the directional test?
Answer
The p-value for the directional test is 0.003
18. What would we conclude with our directional test?
Answer
We would reject the null hypothesis and thus conclude that the proportion of individuals
successfully quitting smoking is significantly greater than 20%.
19. In the directional test, which type of error would be of the most concern?
Answer
Type I error (rejection of a true null hypothesis) would be the most concern error in the
directional test.
20. What does this example illustrate about the use of a directional test when justified relative
to statistical power?
Answer
The example shows that the use of directional hypothesis increases the statistical power
of test. That is, directional hypothesis has more power to detect the difference.
chevron_up_icon
1 out of 5
circle_padding
hide_on_mobile
zoom_out_icon
logo.png

Your All-in-One AI-Powered Toolkit for Academic Success.

Available 24*7 on WhatsApp / Email

[object Object]