BioStatistics Assignment: Confidence Intervals and Hypothesis Testing

Verified

Added on  2023/01/11

|10
|1882
|39
Homework Assignment
AI Summary
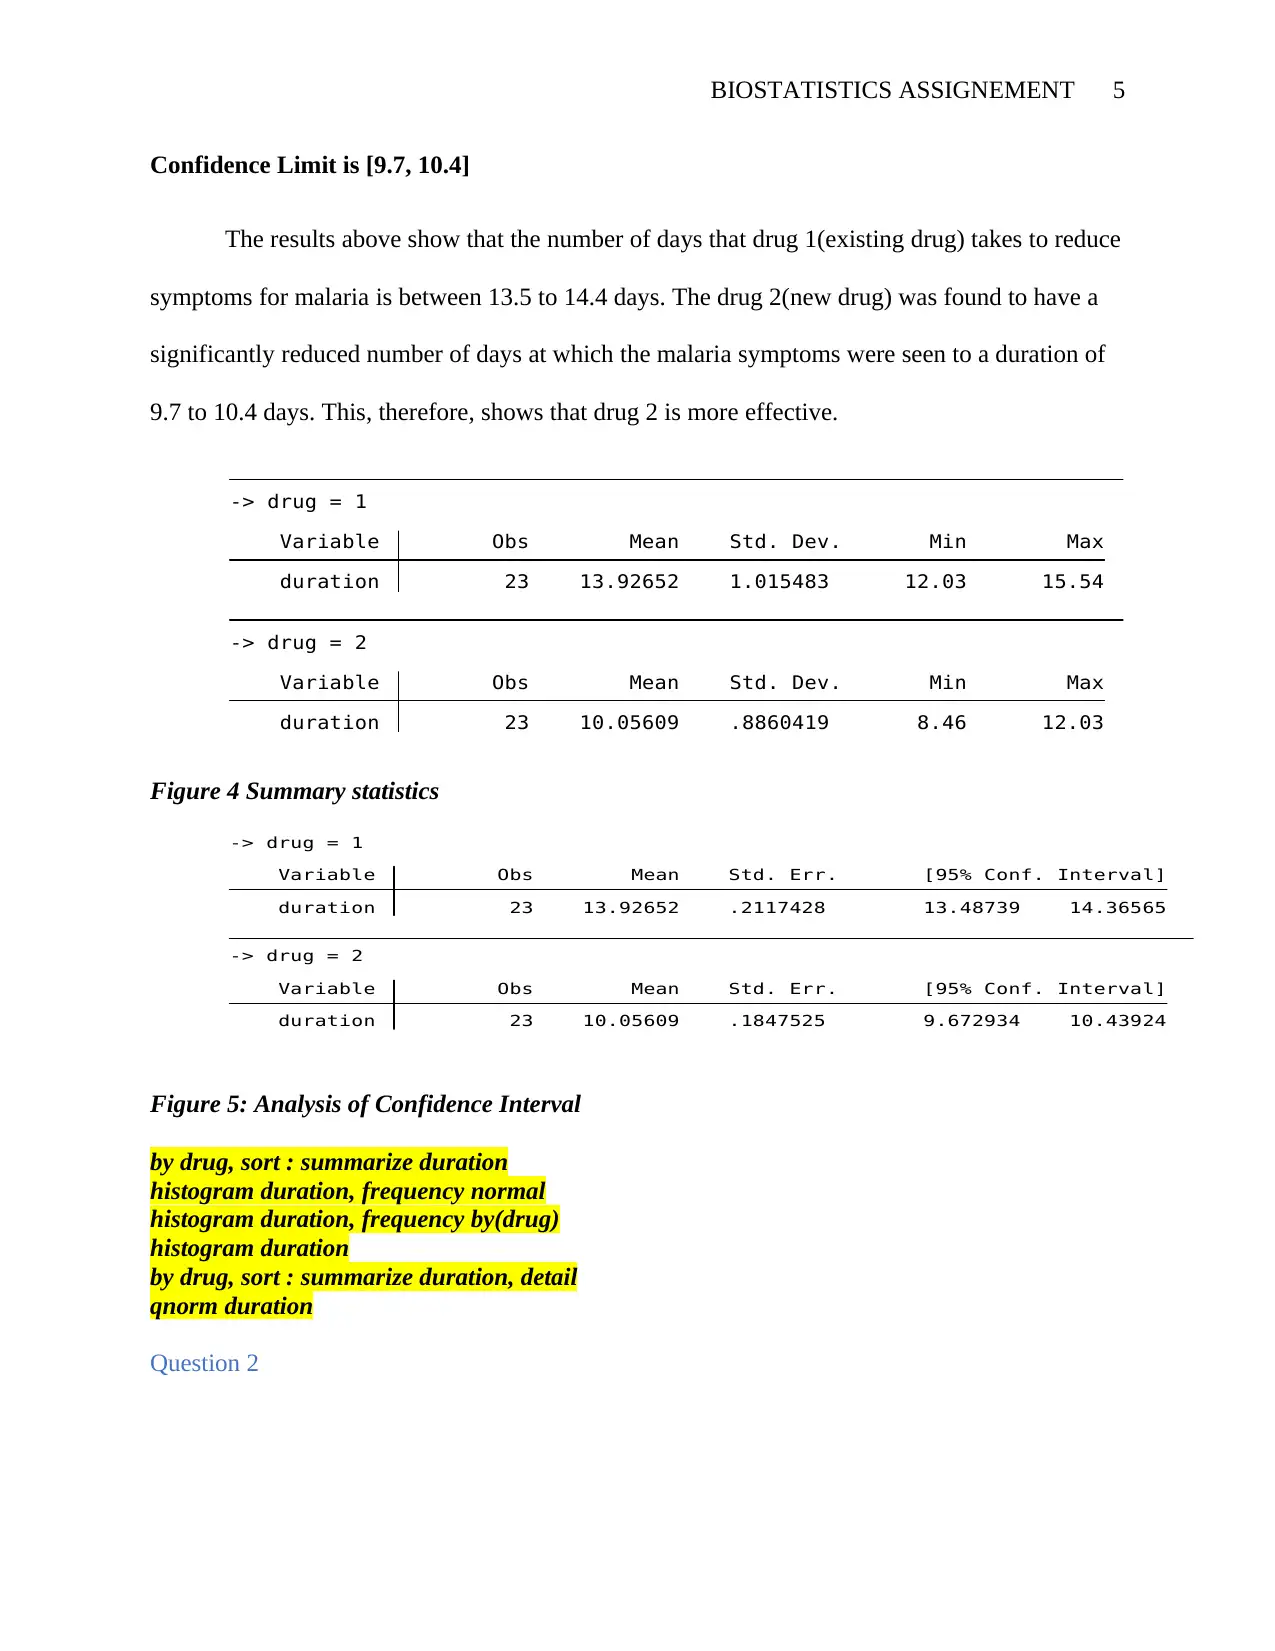
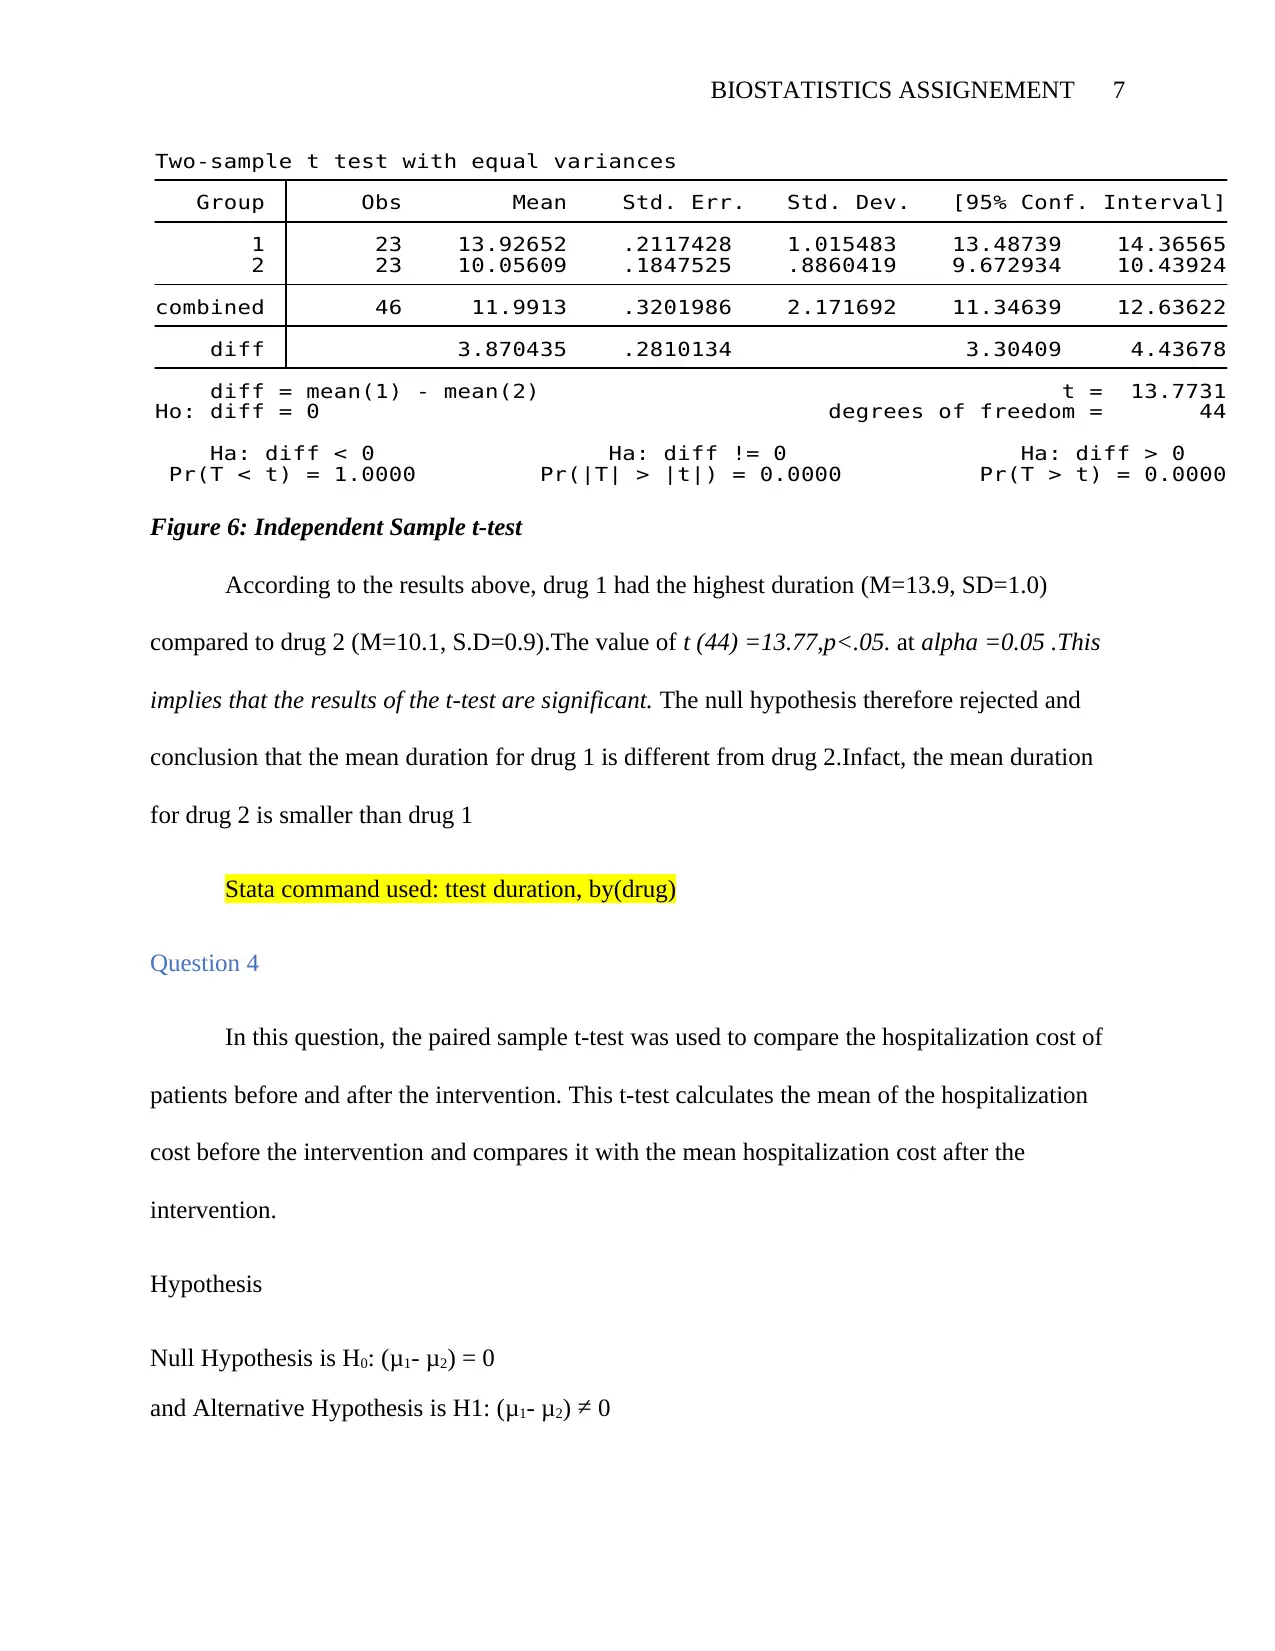
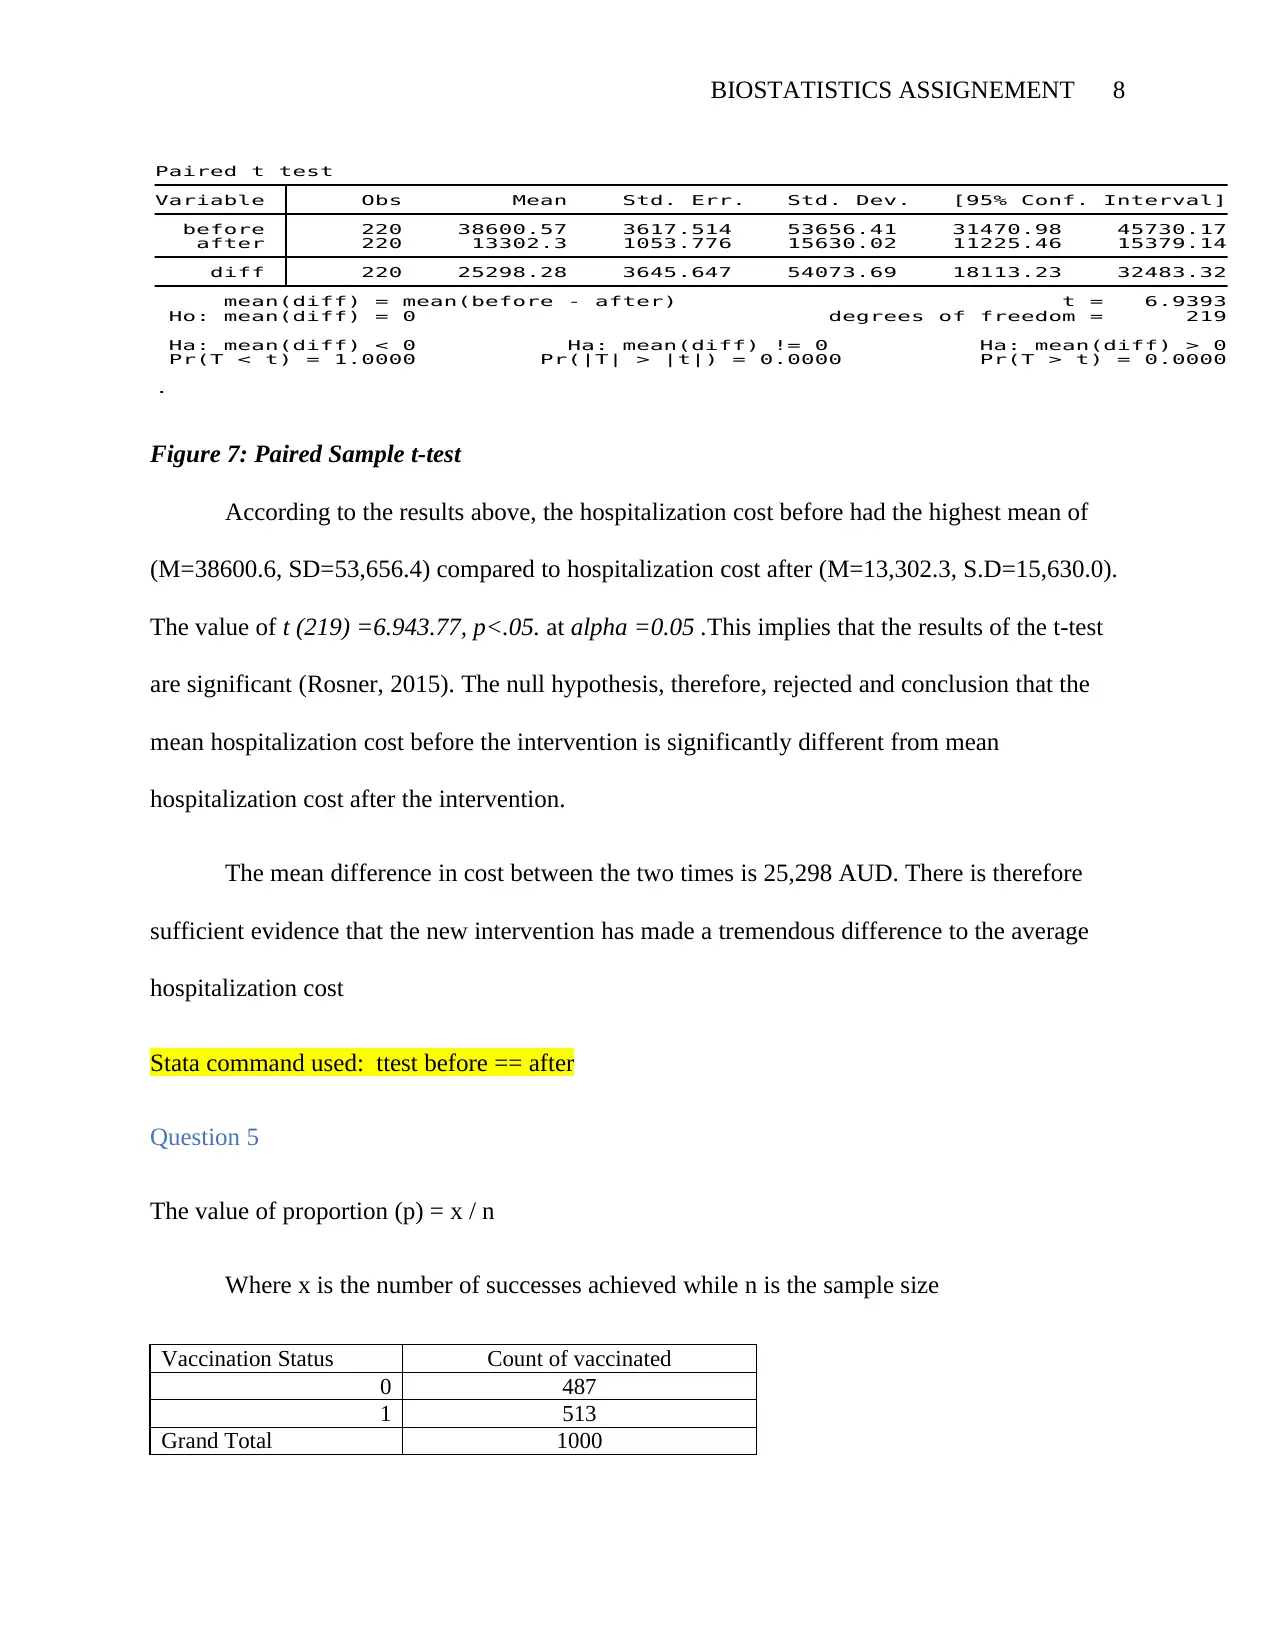
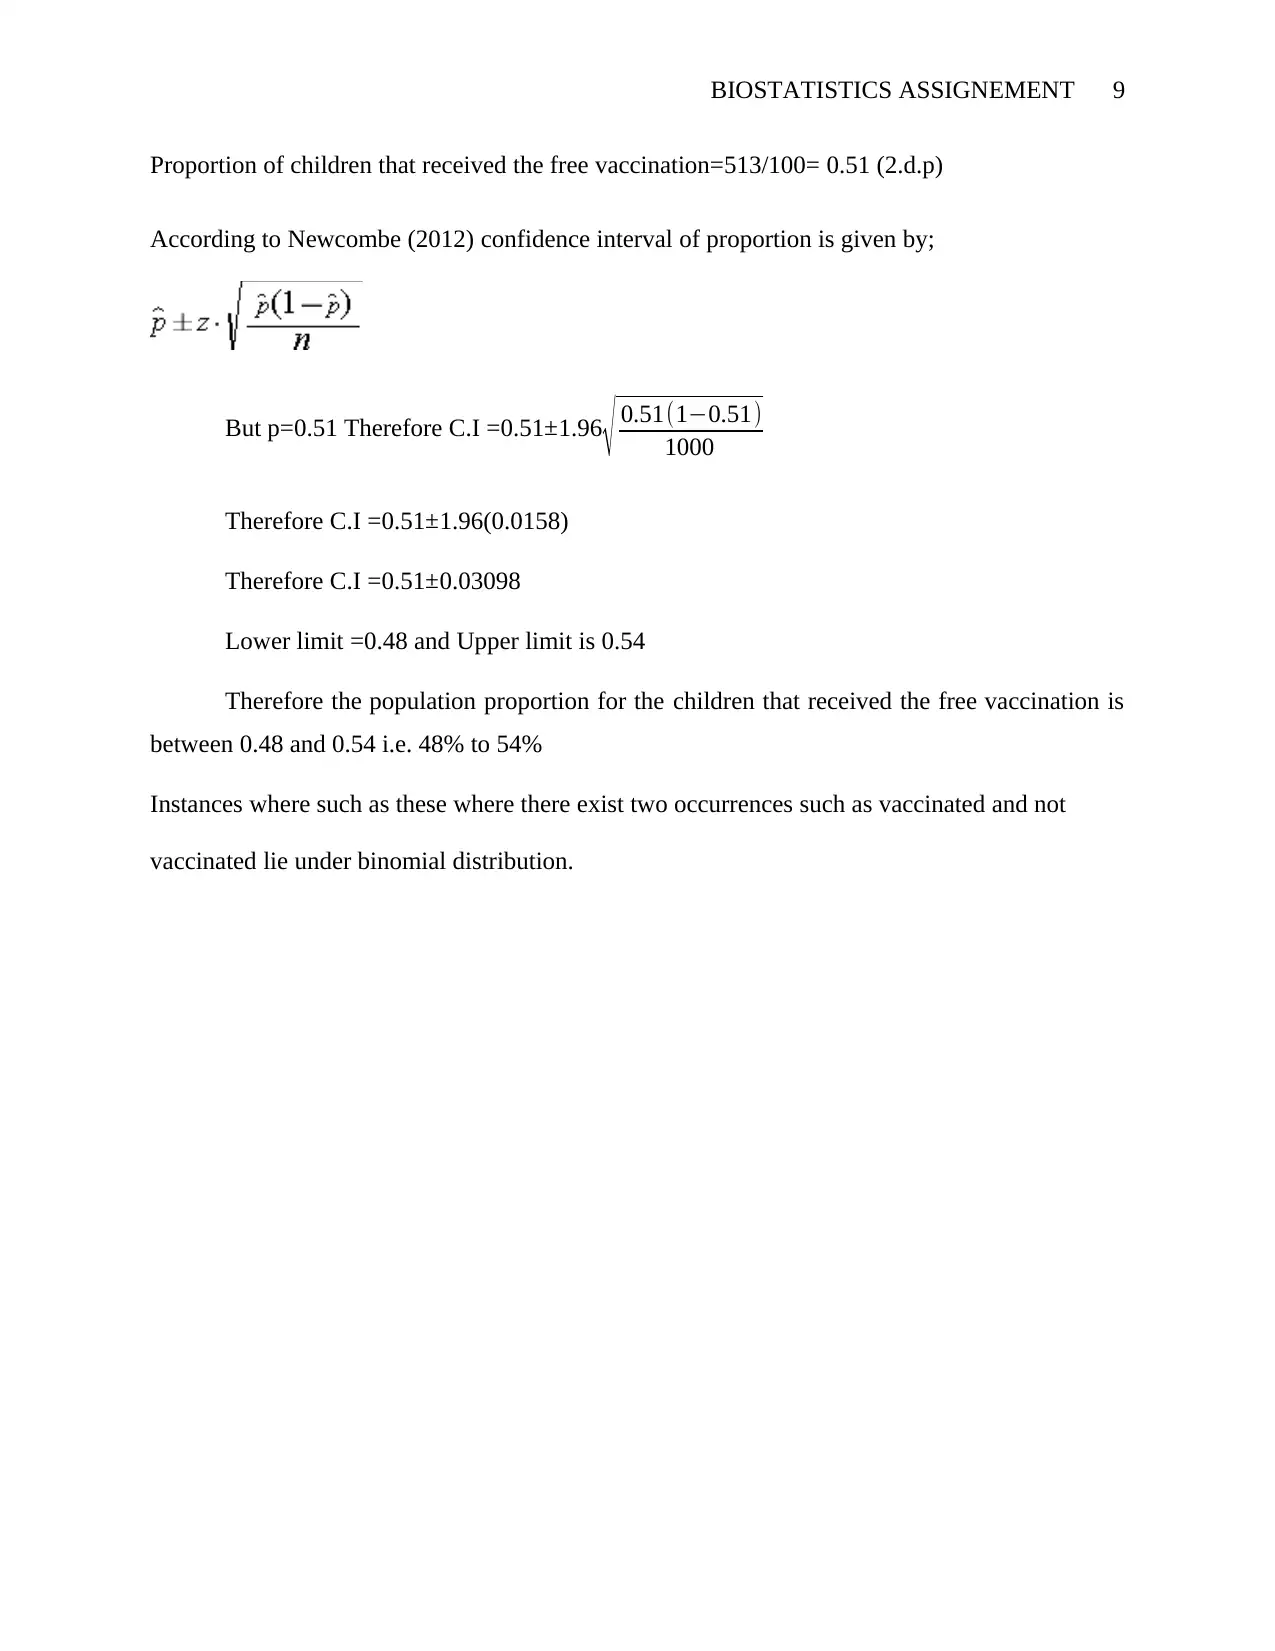
This biostatistics assignment analyzes data related to malaria symptom duration and vaccination status. The assignment calculates 95% confidence intervals for the mean malaria symptom duration for two different drugs, comparing their effectiveness. It also tests the hypothesis that the mean symptom duration for the two drugs is different using t-tests, and interprets the results. Furthermore, the assignment explores the use of a paired sample t-test to compare hospitalization costs before and after an intervention. Finally, it calculates the proportion of children vaccinated and provides a confidence interval for this proportion, discussing the application of binomial distribution. The assignment includes statistical analyses, interpretations, and conclusions based on the provided data, utilizing tools like Stata for computations and visualizations. The solution clearly explains the methods, formulas, and interpretations of the statistical tests performed.
Document Page
BIOSTATISTICS ASSIGNEMENT 1
BIOSTATISTICS ASSIGNMENT
by (Name)
Course
Professor’s Name
University
The City and State
Date
tabler-icon-diamond-filled.svg

Paraphrase This Document

Need a fresh take? Get an instant paraphrase of this document with our AI Paraphraser
Document Page
BIOSTATISTICS ASSIGNEMENT 2
Question 1
Calculation of the 95% confidence interval for the mean malaria symptom duration for drug 1
and drug 2. Cite your answers to 1 decimal place. (8 marks)
Solution
0 . 0 5 . 1 . 1 5 . 2
D e n s it y
8 10 12 14 16
duration
Figure 1: Overall Data Distribution
0 5 1 0
8 10 12 14 16 8 10 12 14 16
1 2
F re q u e n c y
duration
Graphs by drug
Figure 2: Individual Drugs Data Distribution
Document Page
BIOSTATISTICS ASSIGNEMENT 3
8 1 0 1 2 1 4 1 6
d u r a t i o n
8 10 12 14 16
Inverse Normal
Figure 3: Qnormal plot
According to the figures above, the data distribution almost close to a normal distribution. The
data bars are forming a fair bell shape though it is not fully sufficient. In figure 2, drug 1 was
found to be normally distributed. However, drug two is skewed more to the left side. This
implies that drug 2 had more reduced days for the malaria symptoms
A confidence interval is the approximated range of values that the unknown population
parameter is estimated to lie when estimated by a data set from a sample. In a simpler way, it is a
range of values that a researcher is fairly sure that his/her true values in the dataset will lie.
It is given by the formula;
Confidence interval (C.I) z where -population mean, z is the z score and () the
standard error ( σ
n ) (Altman, Machin, and Gardner,2013).
At 95% confidence interval Z score is 1.96
Mean is the overall average of the sum of malaria symptom duration divided by the number of
observation done for each drug (n=23)
Document Page
BIOSTATISTICS ASSIGNEMENT 4
Mean For Drug 1 = X
N =Sum of all the duration of malaria symptom/Sample size=
320.31/23=13.9 (1.d.p)
Mean For Drug 2 = X
N =Sum of all the duration of malaria symptom/Sample size=
231.29/23=10.1 (1.d.p)
According to King'oriah (2004), the Standard deviation is the square root of the sum of squared
deviations from the mean which is divided by sample size minus 1
Standard deviation for drug 1 = ( ( X Xbar )2
N 1 )=22.69/(23-1)= 1.0 (1 d.p)
Standard deviation for drug 2 = ( ( X Xba r ) 2
N 1 )= 17.27/(23-1)= 0.9 (1 d.p)
Thus for drug 1 z= (1.96*1.0/ 23 ¿=0.42
Thus for drug 2 z= (1.96*0.9/ 23 ¿=0.36
Confidence interval for drug 1
Upper Limit is C.I 13.9 (0.42) = 14.4
Lower Limit is C.I 13.9 (0.42) = 13.5
Confidence Limit is [13.5, 14.4]
Confidence interval for drug 2
Upper Limit is C.I 10.1 (0.36) = 10.4
Lower Limit is C.I 10.1 (0.36) = 9.7
tabler-icon-diamond-filled.svg

Paraphrase This Document

Need a fresh take? Get an instant paraphrase of this document with our AI Paraphraser
Document Page
BIOSTATISTICS ASSIGNEMENT 5
Confidence Limit is [9.7, 10.4]
The results above show that the number of days that drug 1(existing drug) takes to reduce
symptoms for malaria is between 13.5 to 14.4 days. The drug 2(new drug) was found to have a
significantly reduced number of days at which the malaria symptoms were seen to a duration of
9.7 to 10.4 days. This, therefore, shows that drug 2 is more effective.
duration 23 10.05609 .8860419 8.46 12.03
Variable Obs Mean Std. Dev. Min Max
-> drug = 2
duration 23 13.92652 1.015483 12.03 15.54
Variable Obs Mean Std. Dev. Min Max
-> drug = 1
Figure 4 Summary statistics
duration 23 10.05609 .1847525 9.672934 10.43924
Variable Obs Mean Std. Err. [95% Conf. Interval]
-> drug = 2
duration 23 13.92652 .2117428 13.48739 14.36565
Variable Obs Mean Std. Err. [95% Conf. Interval]
-> drug = 1
Figure 5: Analysis of Confidence Interval
by drug, sort : summarize duration
histogram duration, frequency normal
histogram duration, frequency by(drug)
histogram duration
by drug, sort : summarize duration, detail
qnorm duration
Question 2
Document Page
BIOSTATISTICS ASSIGNEMENT 6
The confidence intervals imply that drug 1 has a higher mean and the wider interval where the
number of days the malaria symptoms are reduced. Drug 2 has a smaller mean and a narrower
interval that implies that the drug takes lesser time to reduce the malaria symptoms hence a better
drug.
Question 3: Test the hypothesis that the mean symptom duration for drug 1 is different from the
mean symptom duration for drug 2, stating the test statistic to 1 decimal place. As part of your
answer, you should: (6 marks)
Considering that the data is for the two drugs is independent and continuous we can
perform a t-test. This test is able to compare the means of the two drug and provide if the two
variables are significantly different. The main parameter we will check is the mean duration of
drug 1 and drug.Taking the mean duration for drug 1 to be μ1 and mean duration for drug 2 to be
μ2, therefore, we are testing the hypothesis that the difference between the two means (μ1-
μ2)=0
Null Hypothesis is H0: (μ1- μ2) = 0
and Alternative Hypothesis is H1: (μ1- μ2) > 0
The test statistic is:
t=( X1 X2 )( μ1μ2 )
s p
2 (1
n1
+1
n2
)
d . f .=n1+ n22
The pooled variation:
s p
2 =(n11) s1
2+(n21)s2
2
n1 +n22
Using Stata we can compute the results of the independent sample t-test as follows;
Document Page
BIOSTATISTICS ASSIGNEMENT 7
Pr(T < t) = 1.0000 Pr(|T| > |t|) = 0.0000 Pr(T > t) = 0.0000
Ha: diff < 0 Ha: diff != 0 Ha: diff > 0
Ho: diff = 0 degrees of freedom = 44
diff = mean(1) - mean(2) t = 13.7731
diff 3.870435 .2810134 3.30409 4.43678
combined 46 11.9913 .3201986 2.171692 11.34639 12.63622
2 23 10.05609 .1847525 .8860419 9.672934 10.43924
1 23 13.92652 .2117428 1.015483 13.48739 14.36565
Group Obs Mean Std. Err. Std. Dev. [95% Conf. Interval]
Two-sample t test with equal variances
Figure 6: Independent Sample t-test
According to the results above, drug 1 had the highest duration (M=13.9, SD=1.0)
compared to drug 2 (M=10.1, S.D=0.9).The value of t (44) =13.77,p<.05. at alpha =0.05 .This
implies that the results of the t-test are significant. The null hypothesis therefore rejected and
conclusion that the mean duration for drug 1 is different from drug 2.Infact, the mean duration
for drug 2 is smaller than drug 1
Stata command used: ttest duration, by(drug)
Question 4
In this question, the paired sample t-test was used to compare the hospitalization cost of
patients before and after the intervention. This t-test calculates the mean of the hospitalization
cost before the intervention and compares it with the mean hospitalization cost after the
intervention.
Hypothesis
Null Hypothesis is H0: (μ1- μ2) = 0
and Alternative Hypothesis is H1: (μ1- μ2) 0
tabler-icon-diamond-filled.svg

Paraphrase This Document

Need a fresh take? Get an instant paraphrase of this document with our AI Paraphraser
Document Page
BIOSTATISTICS ASSIGNEMENT 8
.
Pr(T < t) = 1.0000 Pr(|T| > |t|) = 0.0000 Pr(T > t) = 0.0000
Ha: mean(diff) < 0 Ha: mean(diff) != 0 Ha: mean(diff) > 0
Ho: mean(diff) = 0 degrees of freedom = 219
mean(diff) = mean(before - after) t = 6.9393
diff 220 25298.28 3645.647 54073.69 18113.23 32483.32
after 220 13302.3 1053.776 15630.02 11225.46 15379.14
before 220 38600.57 3617.514 53656.41 31470.98 45730.17
Variable Obs Mean Std. Err. Std. Dev. [95% Conf. Interval]
Paired t test
Figure 7: Paired Sample t-test
According to the results above, the hospitalization cost before had the highest mean of
(M=38600.6, SD=53,656.4) compared to hospitalization cost after (M=13,302.3, S.D=15,630.0).
The value of t (219) =6.943.77, p<.05. at alpha =0.05 .This implies that the results of the t-test
are significant (Rosner, 2015). The null hypothesis, therefore, rejected and conclusion that the
mean hospitalization cost before the intervention is significantly different from mean
hospitalization cost after the intervention.
The mean difference in cost between the two times is 25,298 AUD. There is therefore
sufficient evidence that the new intervention has made a tremendous difference to the average
hospitalization cost
Stata command used: ttest before == after
Question 5
The value of proportion (p) = x / n
Where x is the number of successes achieved while n is the sample size
Vaccination Status Count of vaccinated
0 487
1 513
Grand Total 1000
Document Page
BIOSTATISTICS ASSIGNEMENT 9
Proportion of children that received the free vaccination=513/100= 0.51 (2.d.p)
According to Newcombe (2012) confidence interval of proportion is given by;
But p=0.51 Therefore C.I =0.51±1.96
0.51(10.51)
1000
Therefore C.I =0.51±1.96(0.0158)
Therefore C.I =0.51±0.03098
Lower limit =0.48 and Upper limit is 0.54
Therefore the population proportion for the children that received the free vaccination is
between 0.48 and 0.54 i.e. 48% to 54%
Instances where such as these where there exist two occurrences such as vaccinated and not
vaccinated lie under binomial distribution.
Document Page
BIOSTATISTICS ASSIGNEMENT 10
References
Altman, D., Machin, D., Bryant, T. and Gardner, M. eds., 2013. Statistics with confidence:
confidence intervals and statistical guidelines. John Wiley & Sons.
King'oriah, G. K., 2004 Fundamentals of applied statistics. Nairobi: The Jomo Kenyatta
Foundation.
Napier, C., & Maisel, J. W., 1980. Principles and Procedures of Statistics: a Biometric Approach.
McGraw Hill Book Company, New York.
Newcombe, R.G., 2012. Confidence intervals for proportions and related measures of effect size.
CRC press.
Rosner, B., 2015. Fundamentals of biostatistics. Nelson Education.
chevron_up_icon
1 out of 10
circle_padding
hide_on_mobile
zoom_out_icon
[object Object]