Data Analysis and Forecasting Report: Wind Speed in Birmingham, UK

Verified

Added on  2023/06/10

|11
|1559
|58
Report
AI Summary
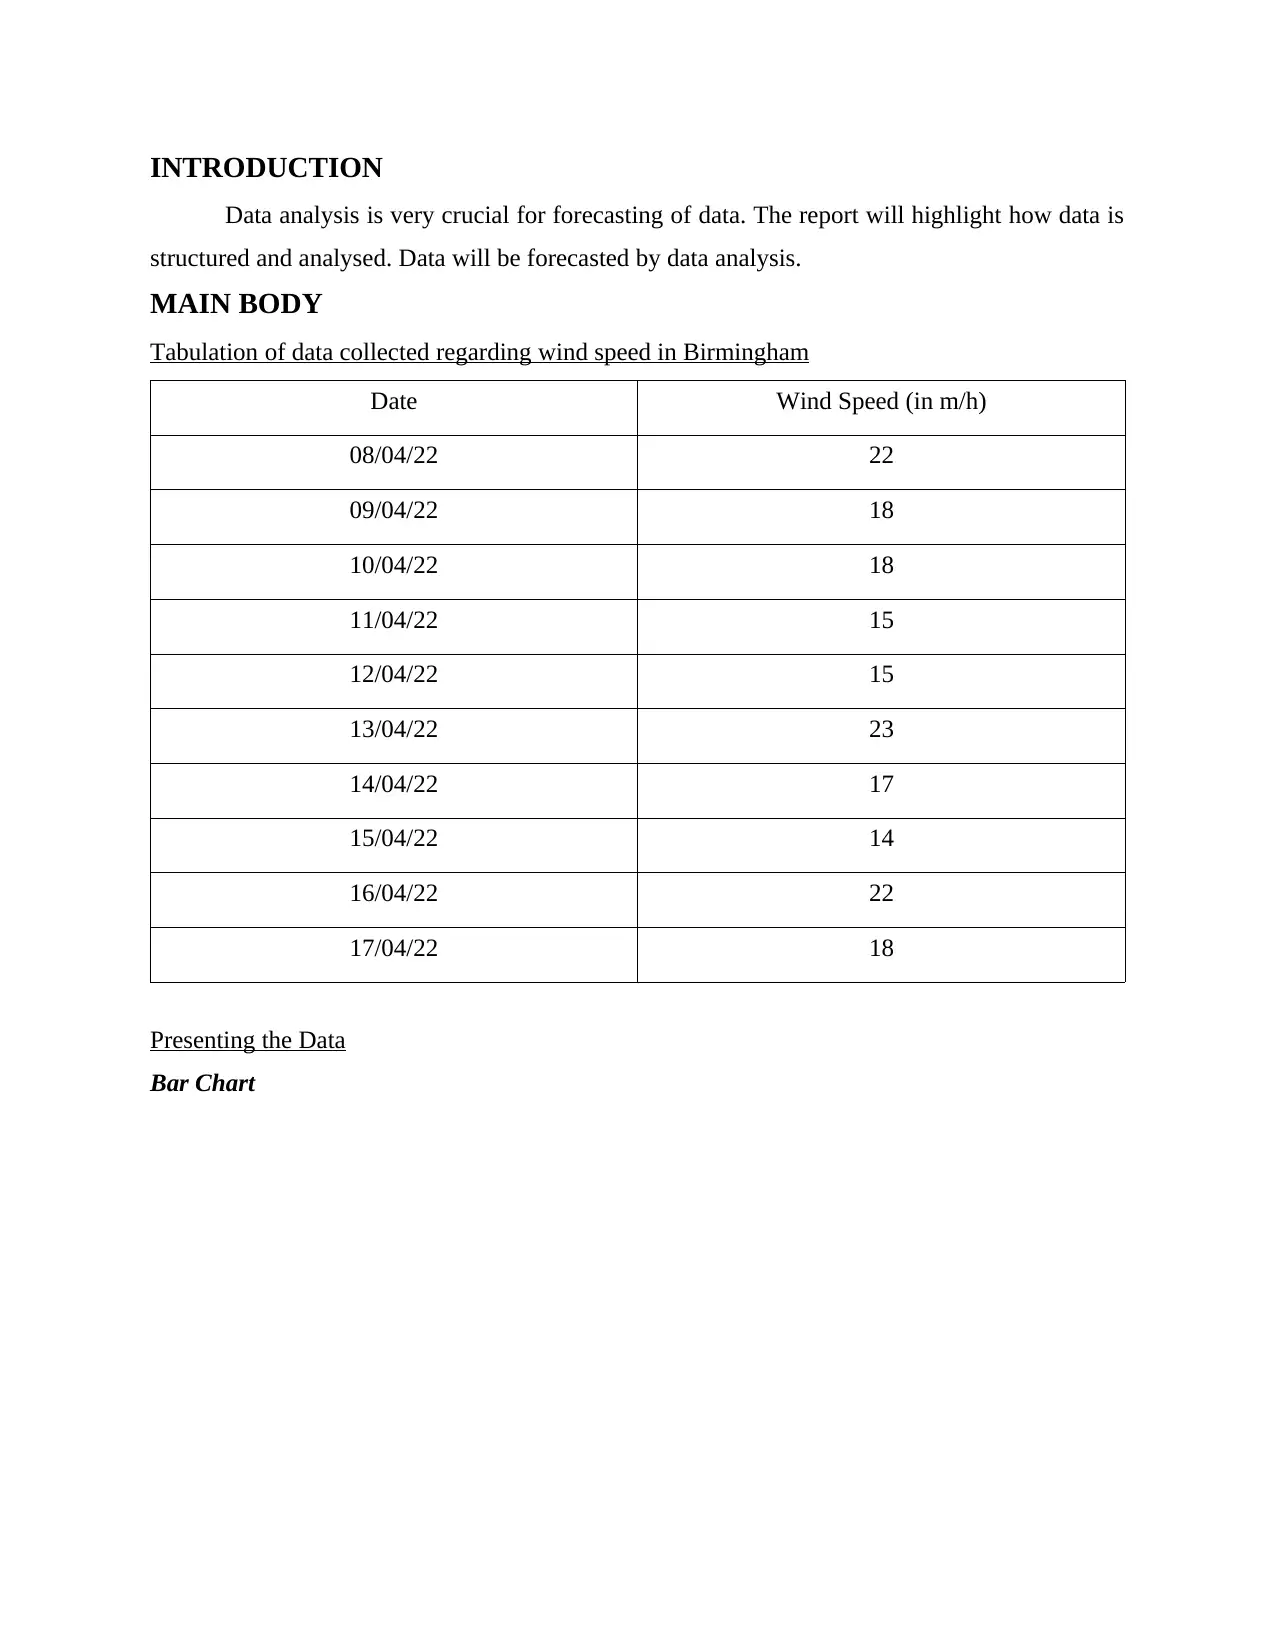
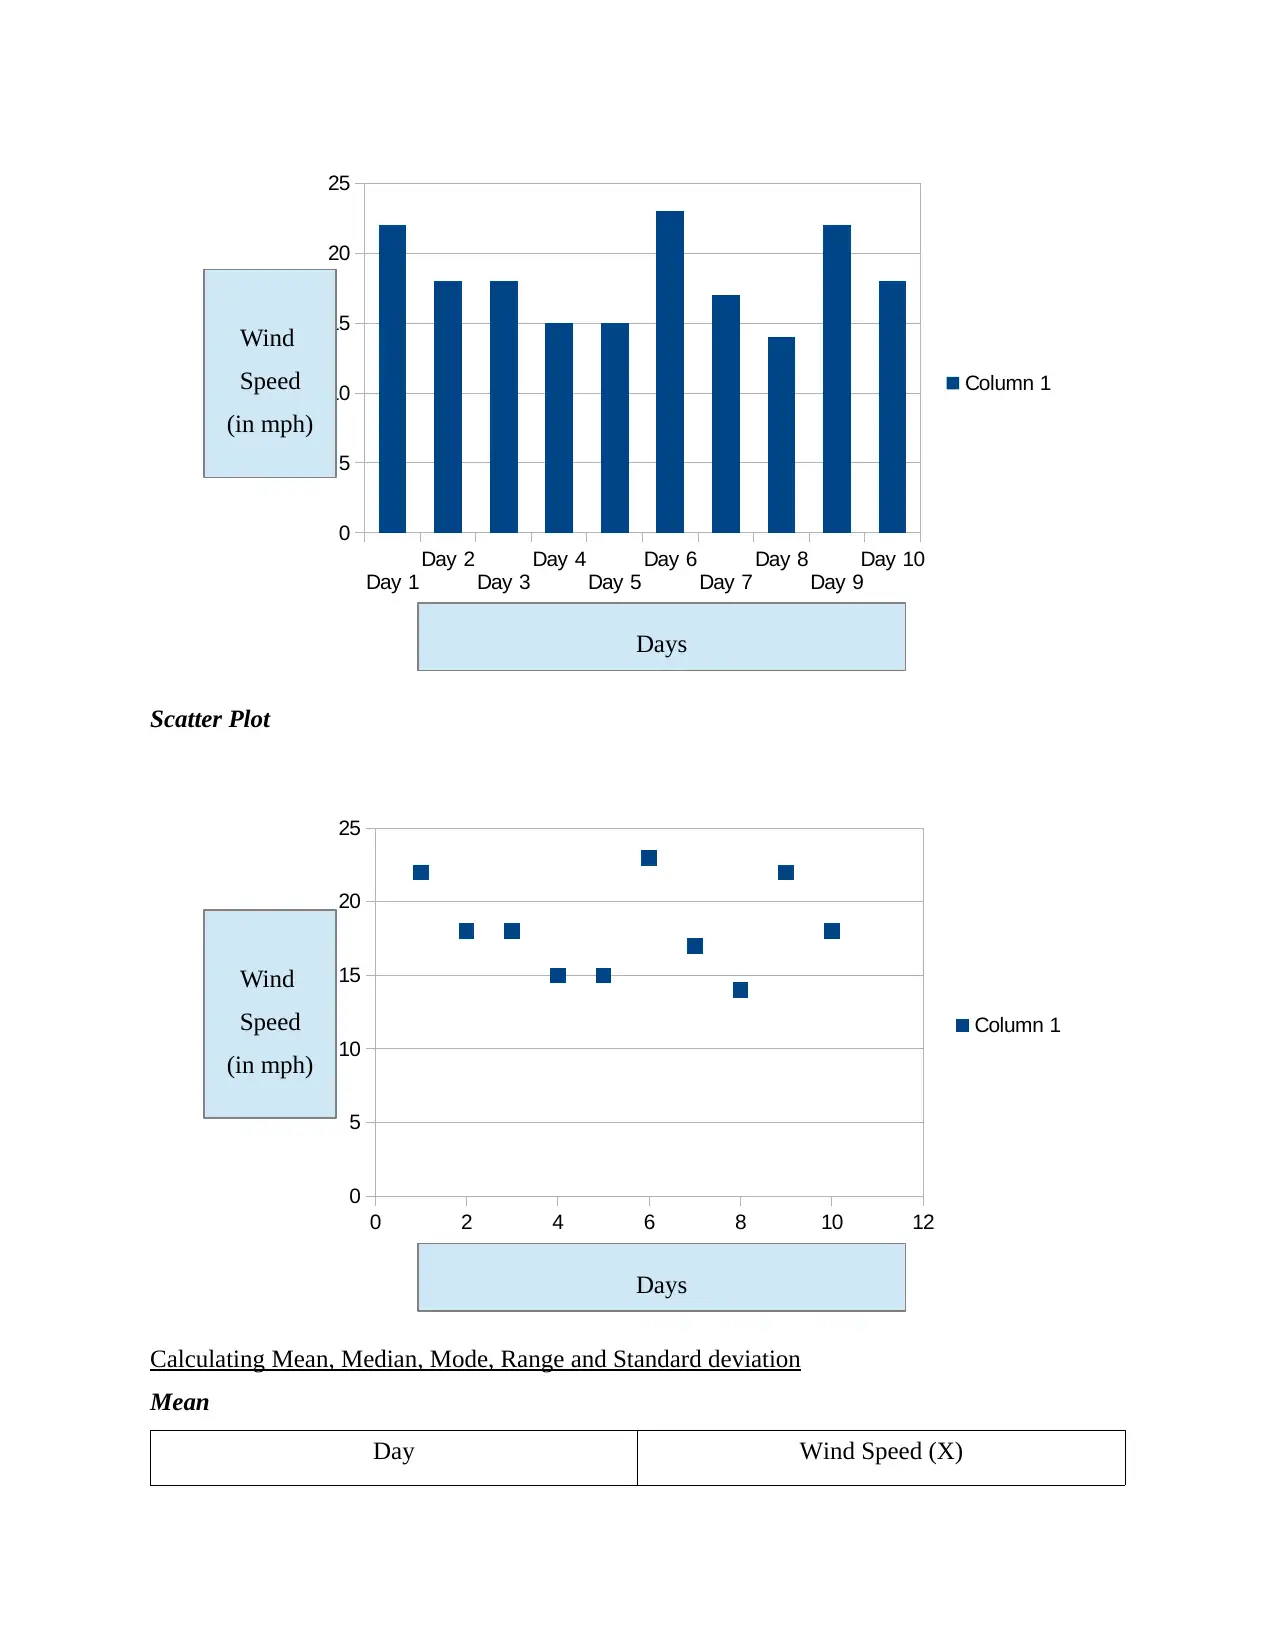
This report presents a comprehensive analysis of wind speed data collected in Birmingham. The main body of the report includes the tabulation of the data, the presentation of the data using bar charts and scatter plots, and the calculation of key statistical measures such as mean, median, mode, range, and standard deviation. The report then applies a linear forecasting model to predict wind speeds for days 12 and 14. Detailed steps for each calculation are provided, along with interpretations of the results. The report concludes with a summary of the findings and references relevant literature. This assignment demonstrates the application of data analysis techniques for understanding and forecasting environmental data. The report provides a good example of how to analyze real world data and create a report.
tabler-icon-diamond-filled.svg

Contribute Materials

Your contribution can guide someone’s learning journey. Share your documents today.
Document Page
Data Analysis and
Forecasting
tabler-icon-diamond-filled.svg

Secure Best Marks with AI Grader

Need help grading? Try our AI Grader for instant feedback on your assignments.
Document Page
Table of Contents
INTRODUCTION...........................................................................................................................3
MAIN BODY...................................................................................................................................3
Tabulation of data collected regarding wind speed in Birmingham............................................3
Presenting the Data......................................................................................................................3
Calculating Mean, Median, Mode, Range and Standard deviation.............................................4
Using linear forecasting model to forecast the speed of wind on day 12 and 14........................7
CONCLUSION................................................................................................................................9
REFERENCES................................................................................................................................1
Document Page
INTRODUCTION
Data analysis is very crucial for forecasting of data. The report will highlight how data is
structured and analysed. Data will be forecasted by data analysis.
MAIN BODY
Tabulation of data collected regarding wind speed in Birmingham
Date Wind Speed (in m/h)
08/04/22 22
09/04/22 18
10/04/22 18
11/04/22 15
12/04/22 15
13/04/22 23
14/04/22 17
15/04/22 14
16/04/22 22
17/04/22 18
Presenting the Data
Bar Chart
Document Page
Scatter Plot
Calculating Mean, Median, Mode, Range and Standard deviation
Mean
Day Wind Speed (X)
Day 1
Day 2
Day 3
Day 4
Day 5
Day 6
Day 7
Day 8
Day 9
Day 10
0
5
10
15
20
25
Column 1
0 2 4 6 8 10 12
0
5
10
15
20
25
Column 1
Wind
Speed
(in mph)
Days
Days
Wind
Speed
(in mph)
tabler-icon-diamond-filled.svg

Secure Best Marks with AI Grader

Need help grading? Try our AI Grader for instant feedback on your assignments.
Document Page
1 22
2 18
3 18
4 15
5 15
6 23
7 17
8 14
9 22
10 18
Total 182
Arithmetic Mean (x̄) = Sum total of wind speed on different days (∑X) / Number of observations
(N)
= 182 / 10 = 18.2.
Steps
For the calculation of arithmetic mean of the given data the data is first arranged in the
tabular format.
In the table the first column is marked as X representing the observation days.
The second column of the table represents the speed of wind on the particular day.
The speed of wind on different days is added and the sum is represented in the last row of
the table (Xiao and et.al., 2021).
The formula for mean is sum total of wind speed on different days divided by the total
number to days. The total is 182 and the number of observations are 10 so the mean of the given data is
182 divided by 10 equals to 18.2.
Interpretation
Document Page
The mean of the given data is 18.2. It means that the average of the wind speed of 10
days is 18.2.
Median
Arranging the data in ascending order
14, 15, 15, 17, 18, 18, 18, 22, 22, 23
N=10
Median (M) = ½ [ value of (N / 2) th item + value of ([N / 2] + 1) th item]
= ½ [ 18 + 18] = 18.
Steps
For calculating the mean of given information the data is first arranged in ascending
order.
The formula for calculation of median in an individual series is based on the number of
observations (Gao, Zhang and Zhu, 2021).
The number of observations in the given data is 10 that is an even number. For even number of observation the median is calculated by adding the value of the term
at the half of the observation and the value at the next term and then dividing the sum by
2.
Interpretation
The median of the following data is 18. It means that 18 is the middle value of all the
values.
Mode
14, 15, 15, 17, 18, 18, 18, 22, 22, 23
Mode (Z) = 18.
Steps
The data is arranged in ascending order. Mode is the observation value that is occurring maximum number of times.
Interpretation
The mode of the given information is 18. It means that 18 is the most occurred value in
the entire data.
Range
Range = the highest value – the lowest value.
Document Page
= 23 – 14= 9.
Steps First take the highest value then subtract the lowest value from the value taken.
Interpretation
The range of the data is 9 it means that the difference between the highest and lowest
value of the data is 9.
Standard Deviation
Day (X) Wind Speed (X) (X - X̄)^2
1 22 3.8
2 18 -0.2
3 18 -0.2
4 15 -3.2
5 15 -3.2
6 23 4.8
7 17 -1.2
8 14 -4.2
9 22 3.8
10 18 -0.2
Total 182 0
S = √∑(X – X̄)^2 / N
= √ 0/10
= 0.
Steps
First subtract the value of mean from each of the value in X column and square the result
and represent in another column (Staffa and Zurakowski, 2018). All the values are then added and the sum is divided by the number of observations (N).
Interpretation
tabler-icon-diamond-filled.svg

Paraphrase This Document

Need a fresh take? Get an instant paraphrase of this document with our AI Paraphraser
Document Page
The standard deviation of the data is 0. It means that the value are very close to each
other.
Using linear forecasting model to forecast the speed of wind on day 12 and 14
x y x^2 xy
1 22 1 22
2 18 4 36
3 18 9 54
4 15 16 60
5 15 25 75
6 23 36 138
7 17 49 119
8 14 64 112
9 22 81 198
10 18 100 180
55 182 385 994
y = mx + c
Calculating value of m
m = [n ∑ xy - (∑ x) (∑ y)] / [n (∑ x^2) - (∑ x)^2]
= [10 × 994 – 55 × 182] / [(10 × 385) – 3025]
= [ 9940 – 10010] / [3850 – 3025]
= -70/825
= -0.08.
Interpretation
The value of m is -0.08. It means that for a unit increase in the independent value will
bring a change of -0.08 in m.
Calculating value of c
c = [∑ y ∑ x^2 - ∑ x ∑ xy] / [n (∑ x^2) - (∑ x)^2]
Document Page
= [182 × 385 – 55 × 994] / [(10 × 385) - (55)^2]
= [70070 - 54670] / [3850 – 3025]
= 15400 / 825
= 18.66.
Interpretation
The value of c is 18.66. It means that at this value the line will cross the y-axis.
Steps
Prepare a table with four columns denote them as x, y, x^2 and xy.
Write the series of days in column x.
Write the wind speed on particular day in column y.
Write the squares of column one values in column x^2.
Write the product of column one and two in column xy (Kumari and Yadav, 2018).
For calculating the value of m put the value in formula = [n ∑ xy - (∑ x) (∑ y)] / [n (∑
x^2) - (∑ x)^2] and solve according BODMAS rule.
For calculating the value of c put the value in formula =[∑ y ∑ x2 - ∑ x ∑ xy] / [n (∑
x^2) - (∑ x)^2] and solve according BODMAS rule.
Forecast of wind speed
Day 12
y = mx + c
= -0.08 × 12 + 18.66
= -0.96 + 18.66
= 19.62 mph.
Day 14
y = mx + c
= -0.08 × 14 + 18.66
= -1.12 + 18.66
= 17.54 mph.
CONCLUSION
Based on the report the calculation of the measures of central tendency has been done.
The report on the basis of linear regression has forecasted the wind speed for two given days.
Document Page
tabler-icon-diamond-filled.svg

Secure Best Marks with AI Grader

Need help grading? Try our AI Grader for instant feedback on your assignments.
Document Page
REFERENCES
Books and Journals
Xiao, D. and et.al., 2021. Design of effective value calculation model for dynamic dataflow of
infrared gas online monitoring. PloS one. 16(10). p.e0259155.
Gao, C., Zhang, X. and Zhu, Y., 2021, December. MWLS: median-weighted least squares
algorithm for in-door localization in LOS environment. In 2021 International
Conference on Intelligent Computing, Automation and Systems (ICICAS) (pp. 228-
231). IEEE.
Staffa, S. J. and Zurakowski, D., 2018. Five steps to successfully implement and evaluate
propensity score matching in clinical research studies. Anesthesia & Analgesia. 127(4).
pp.1066-1073.
Kumari, K. and Yadav, S., 2018. Linear regression analysis study. Journal of the practice of
Cardiovascular Sciences. 4(1). p.33.
1
chevron_up_icon
1 out of 11
circle_padding
hide_on_mobile
zoom_out_icon
logo.png

Your All-in-One AI-Powered Toolkit for Academic Success.

Available 24*7 on WhatsApp / Email

[object Object]