Comprehensive Data Analysis Report: Birth Weight and Related Factors
VerifiedAdded on 2020/01/23
|13
|2069
|57
Report
AI Summary
This report presents a comprehensive data analysis of birth weight, exploring the influence of various factors. The analysis includes two-sample t-tests to compare birth weights between different years, smoking mothers versus non-smoking mothers, and indigenous versus non-indigenous mothers. Furthermore, a forward stepwise regression model is employed to identify the significant predictors of birth weight, such as gestation, smoking status, height, and mother's status. The report details the regression coefficients, correlation matrix, and the impact of each variable on birth weight. The findings indicate significant differences in birth weight based on smoking habits and indigenous status, along with the identification of key factors contributing to birth weight variation. The report concludes with a summary of the findings and relevant references.
DATA ANALYSIS
Paraphrase This Document
Need a fresh take? Get an instant paraphrase of this document with our AI Paraphraser
Table of Contents
PART 1........................................................................................................................................................................................................3
Analysis of the age difference between the birth weight of year 2004 and 2015....................................................................................3
1. Two-sample t test.................................................................................................................................................................................4
(A)............................................................................................................................................................................................................4
(B)............................................................................................................................................................................................................5
2 Regression equation by forward stepwise model.................................................................................................................................6
(A) Regression coefficient.......................................................................................................................................................................8
(B) Correlation matrix.............................................................................................................................................................................9
(C) Impact of regression coefficient with the introduction of height....................................................................................................10
(D)..........................................................................................................................................................................................................10
(E) Overall model adequacy..................................................................................................................................................................11
(F) Expected weight...............................................................................................................................................................................11
3. Computing the difference in the average birth weight of babies of indigenous and non-indigenous mothers.................................11
REFERENCES..........................................................................................................................................................................................14
PART 1
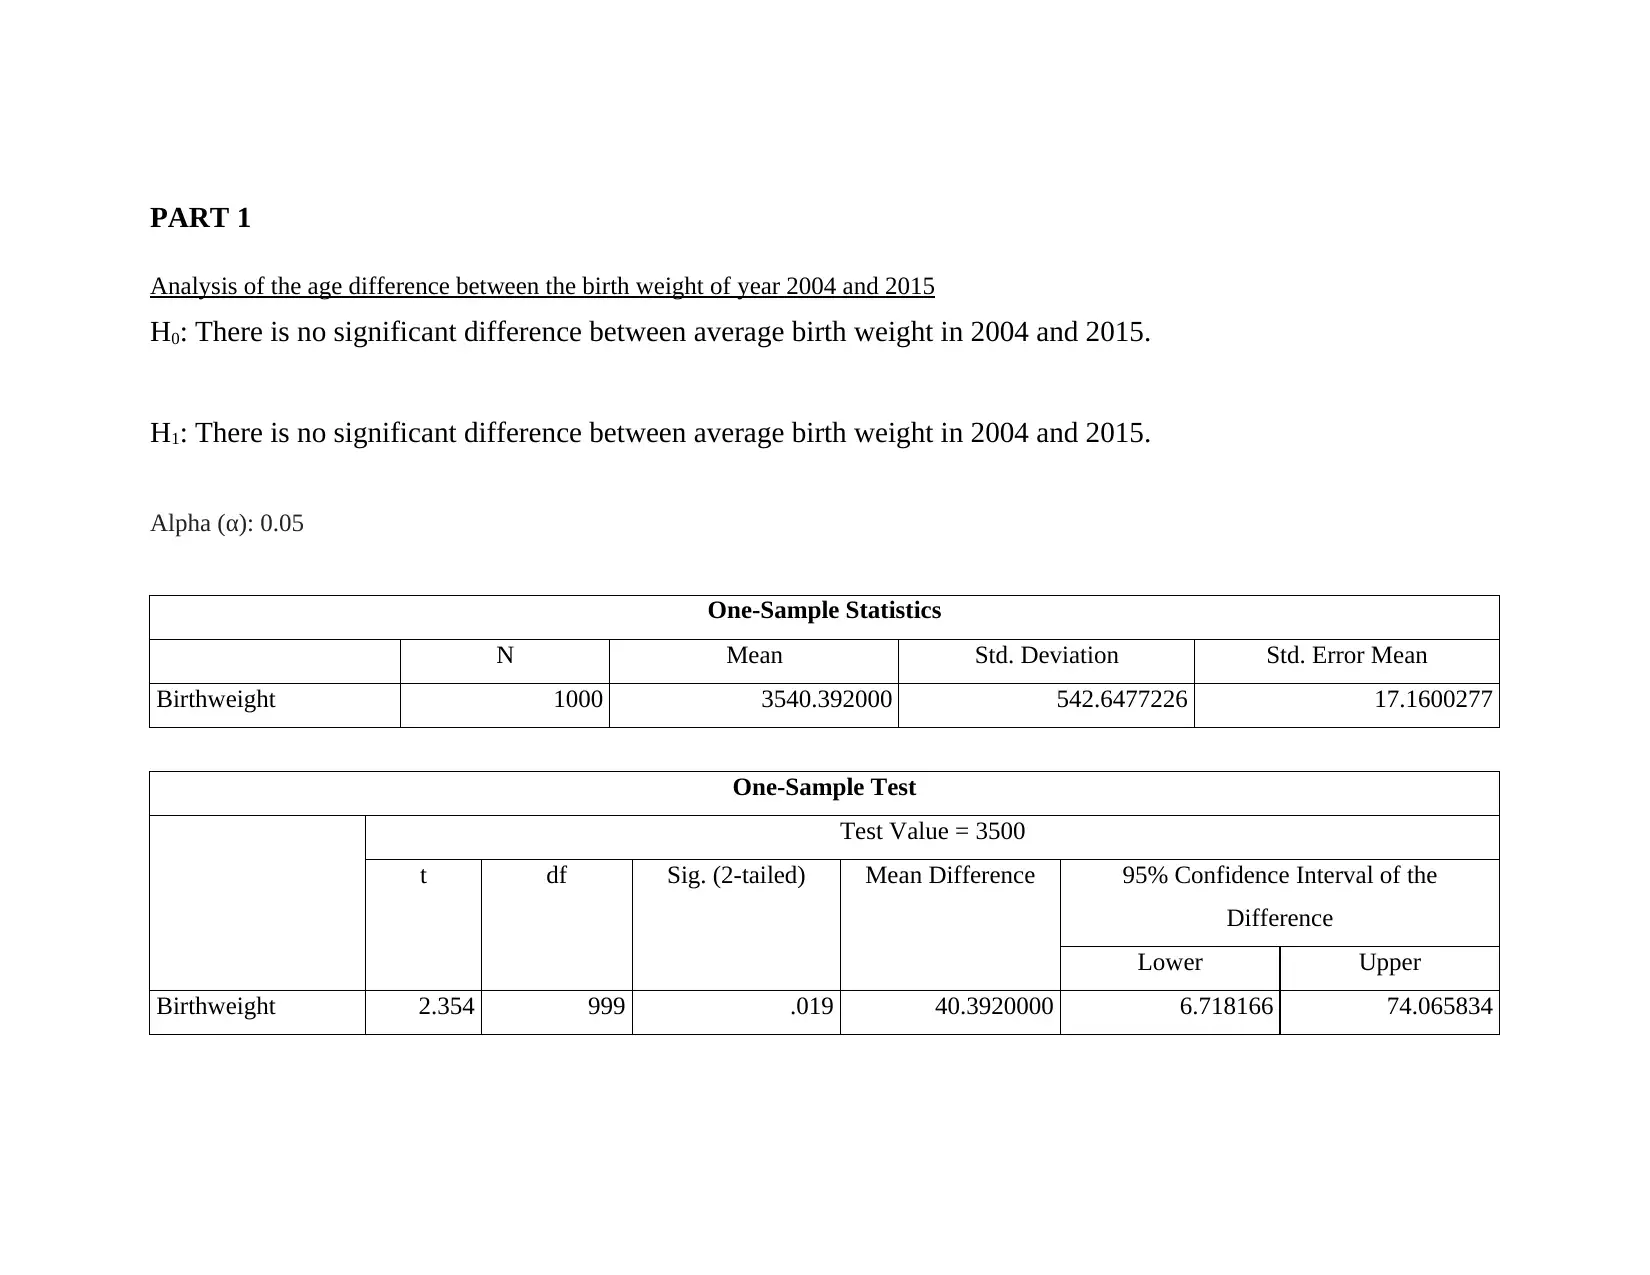
Analysis of the age difference between the birth weight of year 2004 and 2015
H0: There is no significant difference between average birth weight in 2004 and 2015.
H1: There is no significant difference between average birth weight in 2004 and 2015.
Alpha (α): 0.05
One-Sample Statistics
N Mean Std. Deviation Std. Error Mean
Birthweight 1000 3540.392000 542.6477226 17.1600277
One-Sample Test
Test Value = 3500
t df Sig. (2-tailed) Mean Difference 95% Confidence Interval of the
Difference
Lower Upper
Birthweight 2.354 999 .019 40.3920000 6.718166 74.065834
⊘ This is a preview!⊘
Do you want full access?
Subscribe today to unlock all pages.
Trusted by 1+ million students worldwide
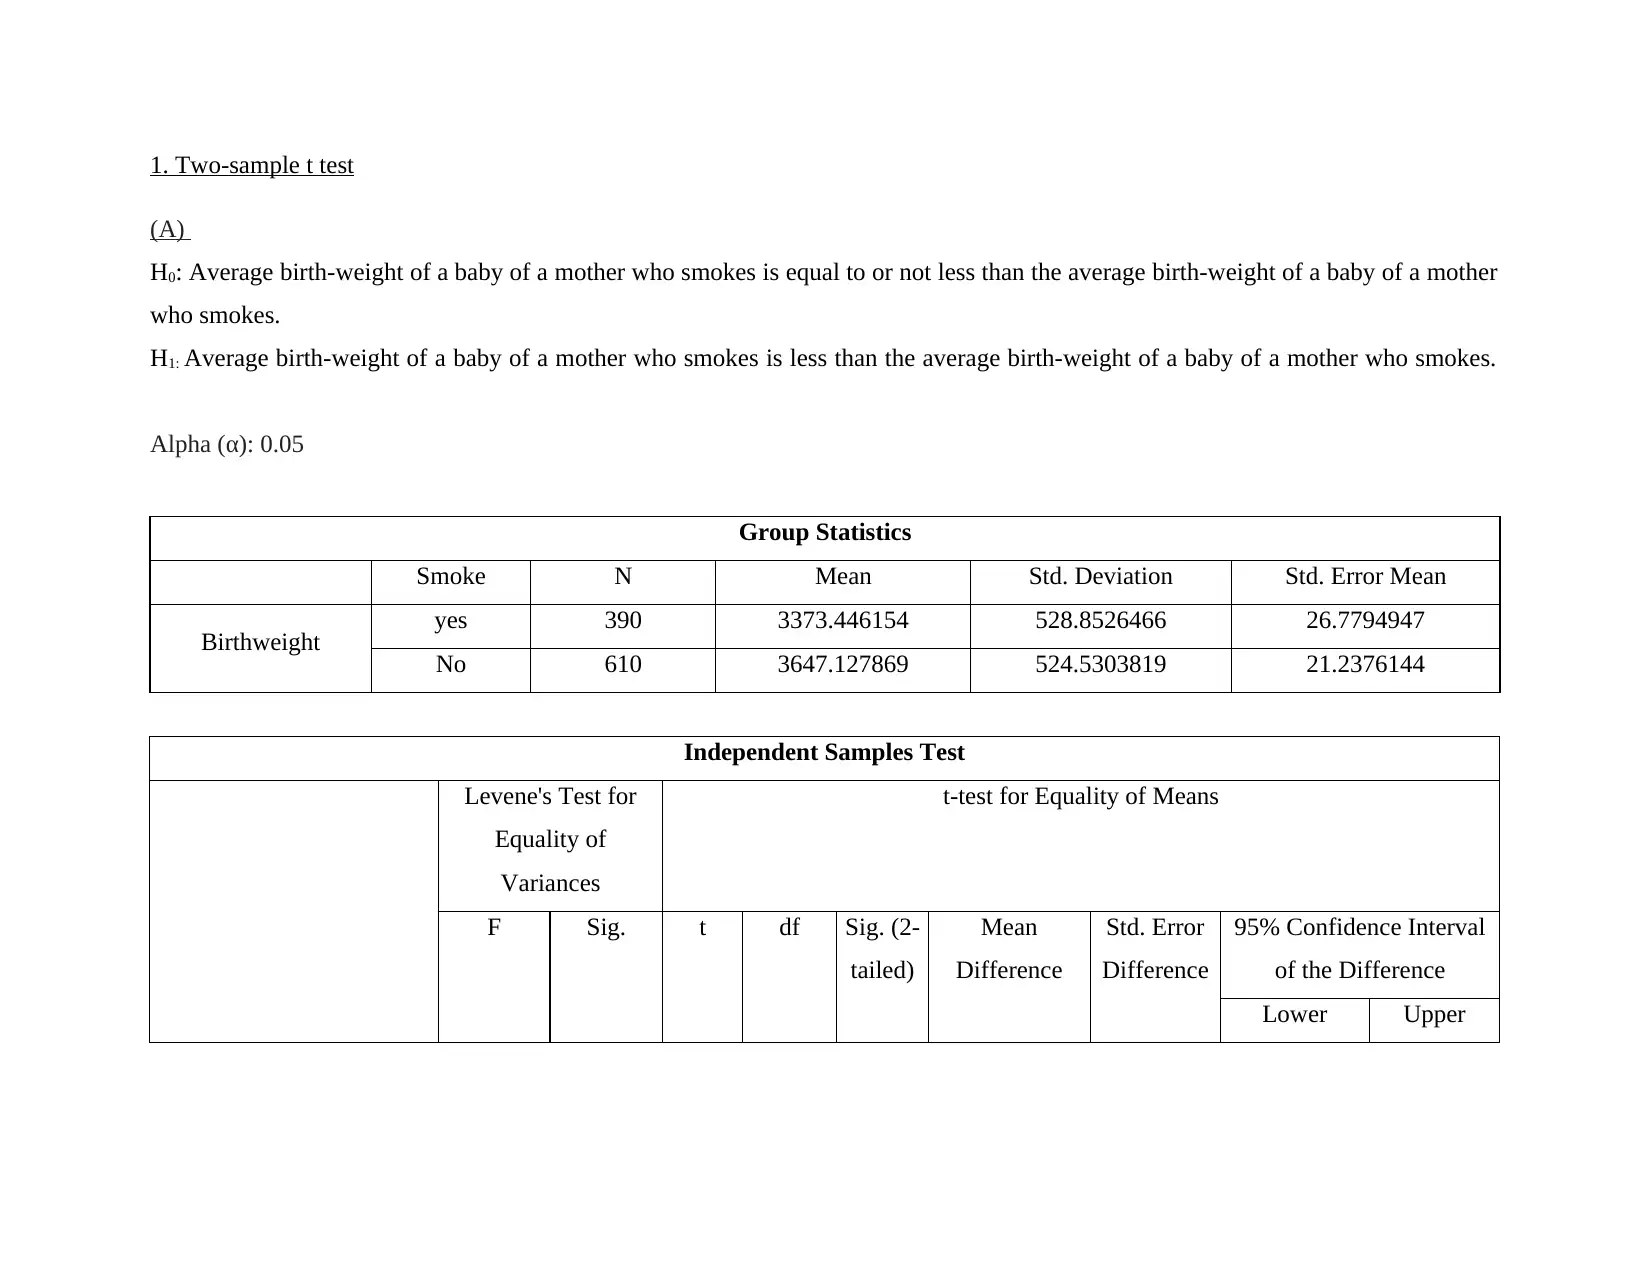
1. Two-sample t test
(A)
H0: Average birth-weight of a baby of a mother who smokes is equal to or not less than the average birth-weight of a baby of a mother
who smokes.
H1: Average birth-weight of a baby of a mother who smokes is less than the average birth-weight of a baby of a mother who smokes.
Alpha (α): 0.05
Group Statistics
Smoke N Mean Std. Deviation Std. Error Mean
Birthweight yes 390 3373.446154 528.8526466 26.7794947
No 610 3647.127869 524.5303819 21.2376144
Independent Samples Test
Levene's Test for
Equality of
Variances
t-test for Equality of Means
F Sig. t df Sig. (2-
tailed)
Mean
Difference
Std. Error
Difference
95% Confidence Interval
of the Difference
Lower Upper
Paraphrase This Document
Need a fresh take? Get an instant paraphrase of this document with our AI Paraphraser
Birthweigh
t
Equal
variances
assumed
.950 .330 -8.022 998 .000 -273.6817150 34.116901
4
-
340.6308065
-
206.73262
36
Equal
variances not
assumed
-8.007 823.99
2 .000 -273.6817150 34.178613
2
-
340.7691084
-
206.59432
16
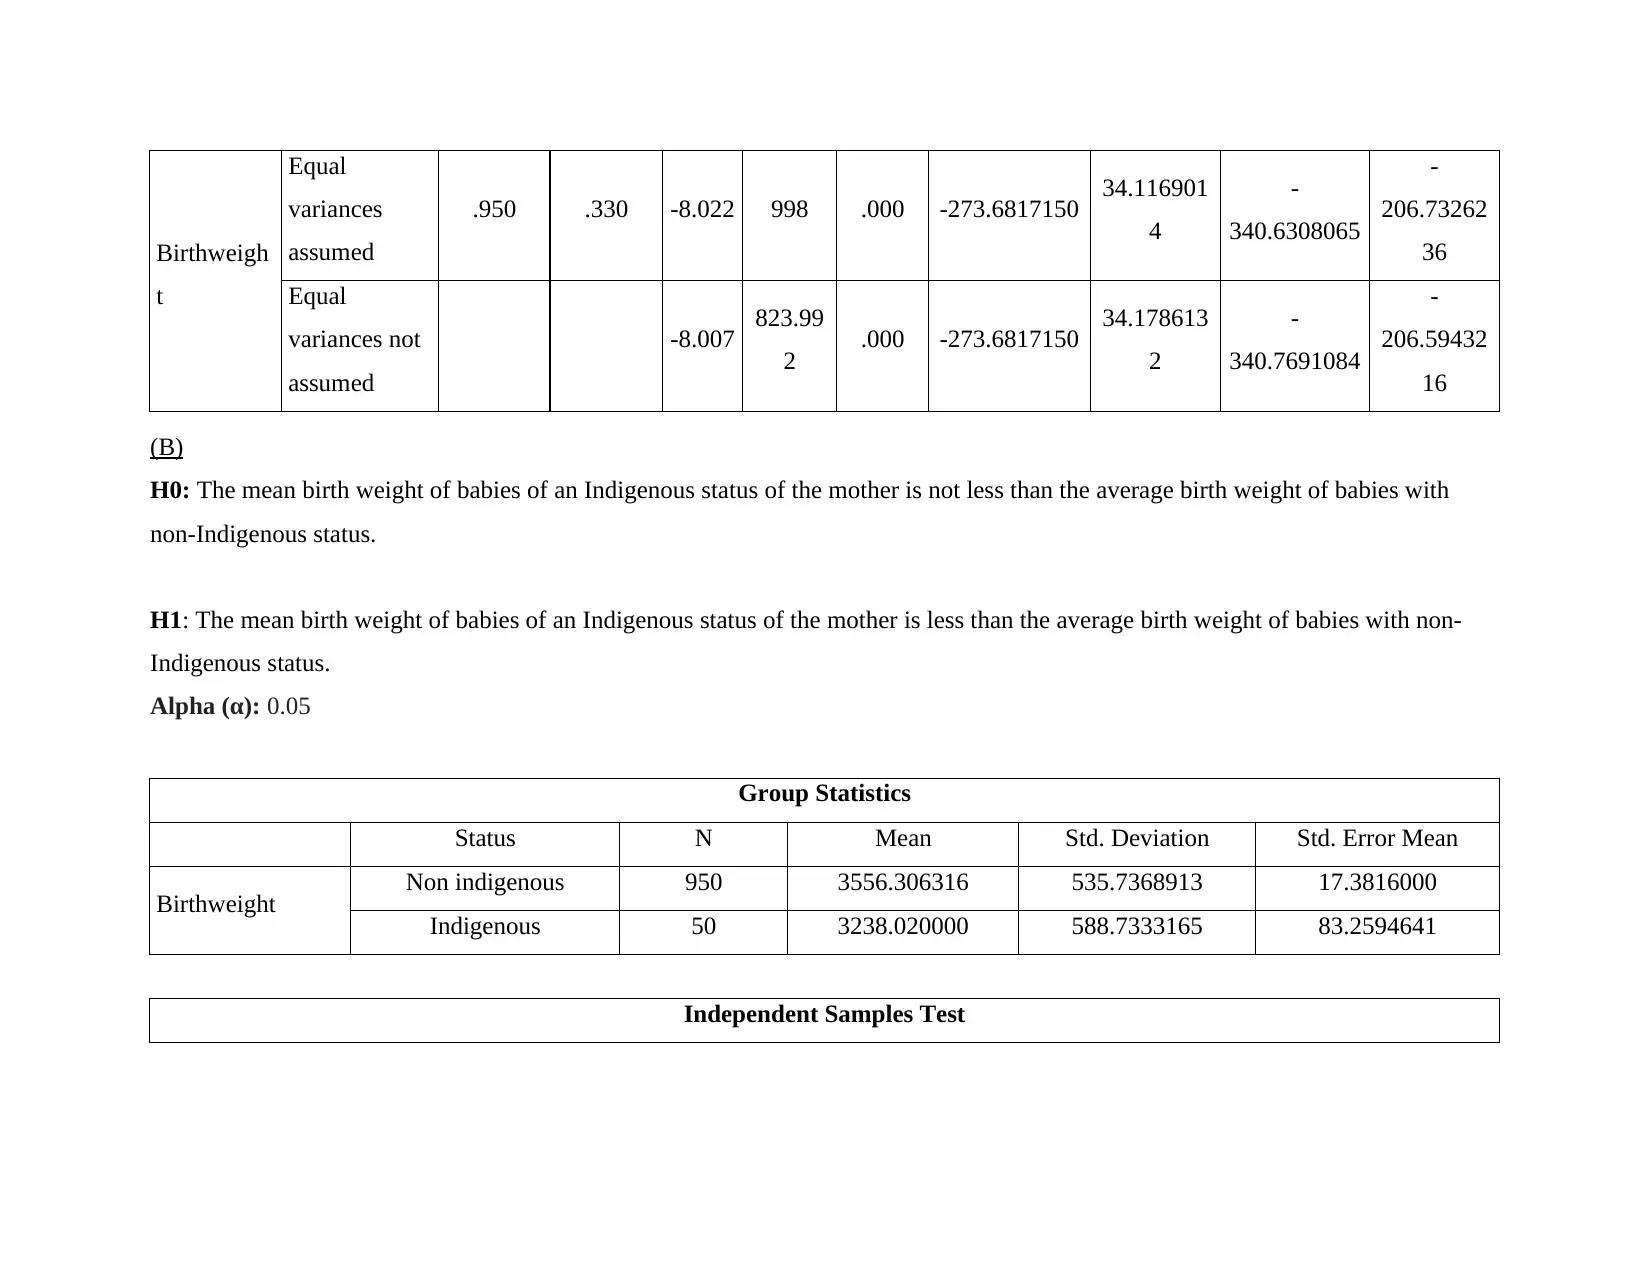
(B)
H0: The mean birth weight of babies of an Indigenous status of the mother is not less than the average birth weight of babies with
non-Indigenous status.
H1: The mean birth weight of babies of an Indigenous status of the mother is less than the average birth weight of babies with non-
Indigenous status.
Alpha (α): 0.05
Group Statistics
Status N Mean Std. Deviation Std. Error Mean
Birthweight Non indigenous 950 3556.306316 535.7368913 17.3816000
Indigenous 50 3238.020000 588.7333165 83.2594641
Independent Samples Test
t
Equal
variances
assumed
.950 .330 -8.022 998 .000 -273.6817150 34.116901
4
-
340.6308065
-
206.73262
36
Equal
variances not
assumed
-8.007 823.99
2 .000 -273.6817150 34.178613
2
-
340.7691084
-
206.59432
16
(B)
H0: The mean birth weight of babies of an Indigenous status of the mother is not less than the average birth weight of babies with
non-Indigenous status.
H1: The mean birth weight of babies of an Indigenous status of the mother is less than the average birth weight of babies with non-
Indigenous status.
Alpha (α): 0.05
Group Statistics
Status N Mean Std. Deviation Std. Error Mean
Birthweight Non indigenous 950 3556.306316 535.7368913 17.3816000
Indigenous 50 3238.020000 588.7333165 83.2594641
Independent Samples Test
Levene's Test for
Equality of
Variances
t-test for Equality of Means
F Sig. t df Sig. (2-
tailed)
Mean
Difference
Std. Error
Difference
95% Confidence Interval
of the Difference
Lower Upper
Birthweigh
t
Equal variances
assumed 1.234 .267 4.074 998 .000 318.286315
8 78.1280893 164.972140
6 471.6004909
Equal variances
not assumed 3.742 53.359 .000 318.286315
8 85.0544436 147.715490
2 488.8571414
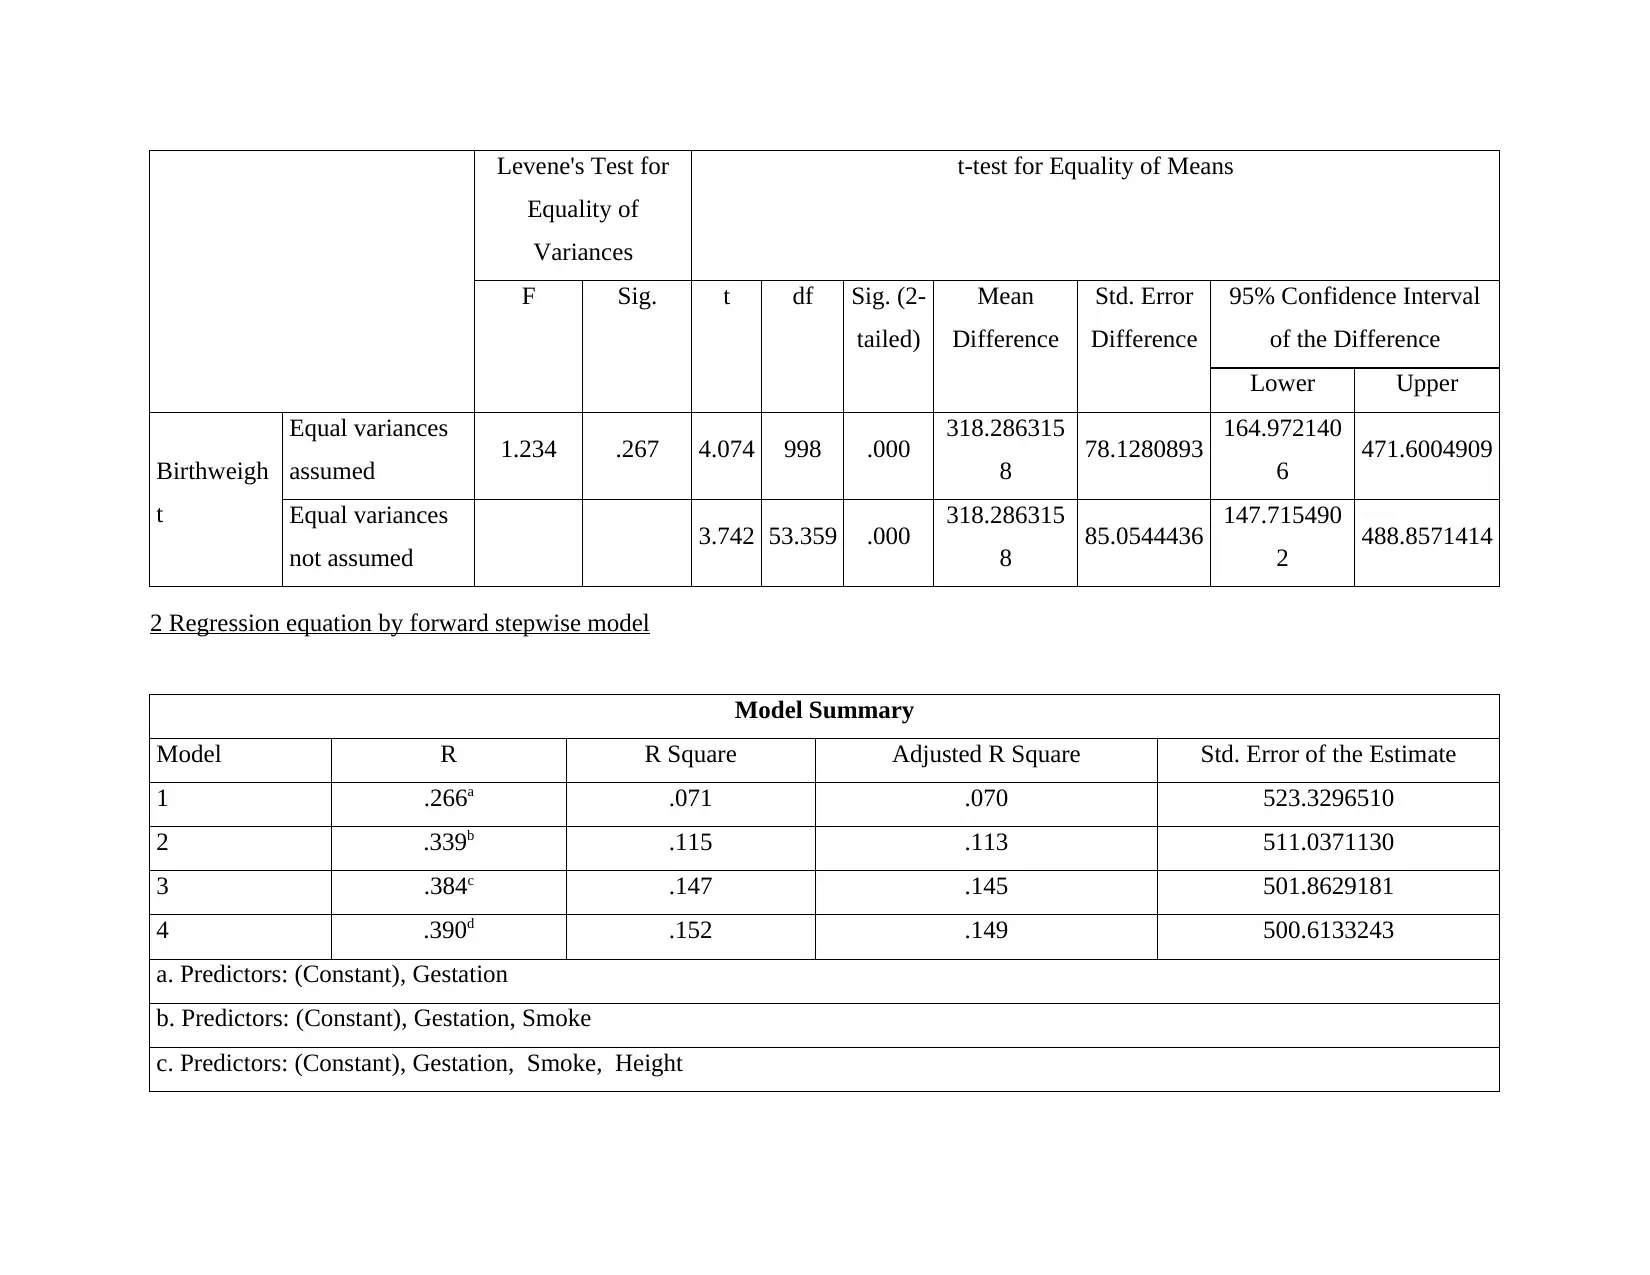
2 Regression equation by forward stepwise model
Model Summary
Model R R Square Adjusted R Square Std. Error of the Estimate
1 .266a .071 .070 523.3296510
2 .339b .115 .113 511.0371130
3 .384c .147 .145 501.8629181
4 .390d .152 .149 500.6133243
a. Predictors: (Constant), Gestation
b. Predictors: (Constant), Gestation, Smoke
c. Predictors: (Constant), Gestation, Smoke, Height
Equality of
Variances
t-test for Equality of Means
F Sig. t df Sig. (2-
tailed)
Mean
Difference
Std. Error
Difference
95% Confidence Interval
of the Difference
Lower Upper
Birthweigh
t
Equal variances
assumed 1.234 .267 4.074 998 .000 318.286315
8 78.1280893 164.972140
6 471.6004909
Equal variances
not assumed 3.742 53.359 .000 318.286315
8 85.0544436 147.715490
2 488.8571414
2 Regression equation by forward stepwise model
Model Summary
Model R R Square Adjusted R Square Std. Error of the Estimate
1 .266a .071 .070 523.3296510
2 .339b .115 .113 511.0371130
3 .384c .147 .145 501.8629181
4 .390d .152 .149 500.6133243
a. Predictors: (Constant), Gestation
b. Predictors: (Constant), Gestation, Smoke
c. Predictors: (Constant), Gestation, Smoke, Height
⊘ This is a preview!⊘
Do you want full access?
Subscribe today to unlock all pages.
Trusted by 1+ million students worldwide
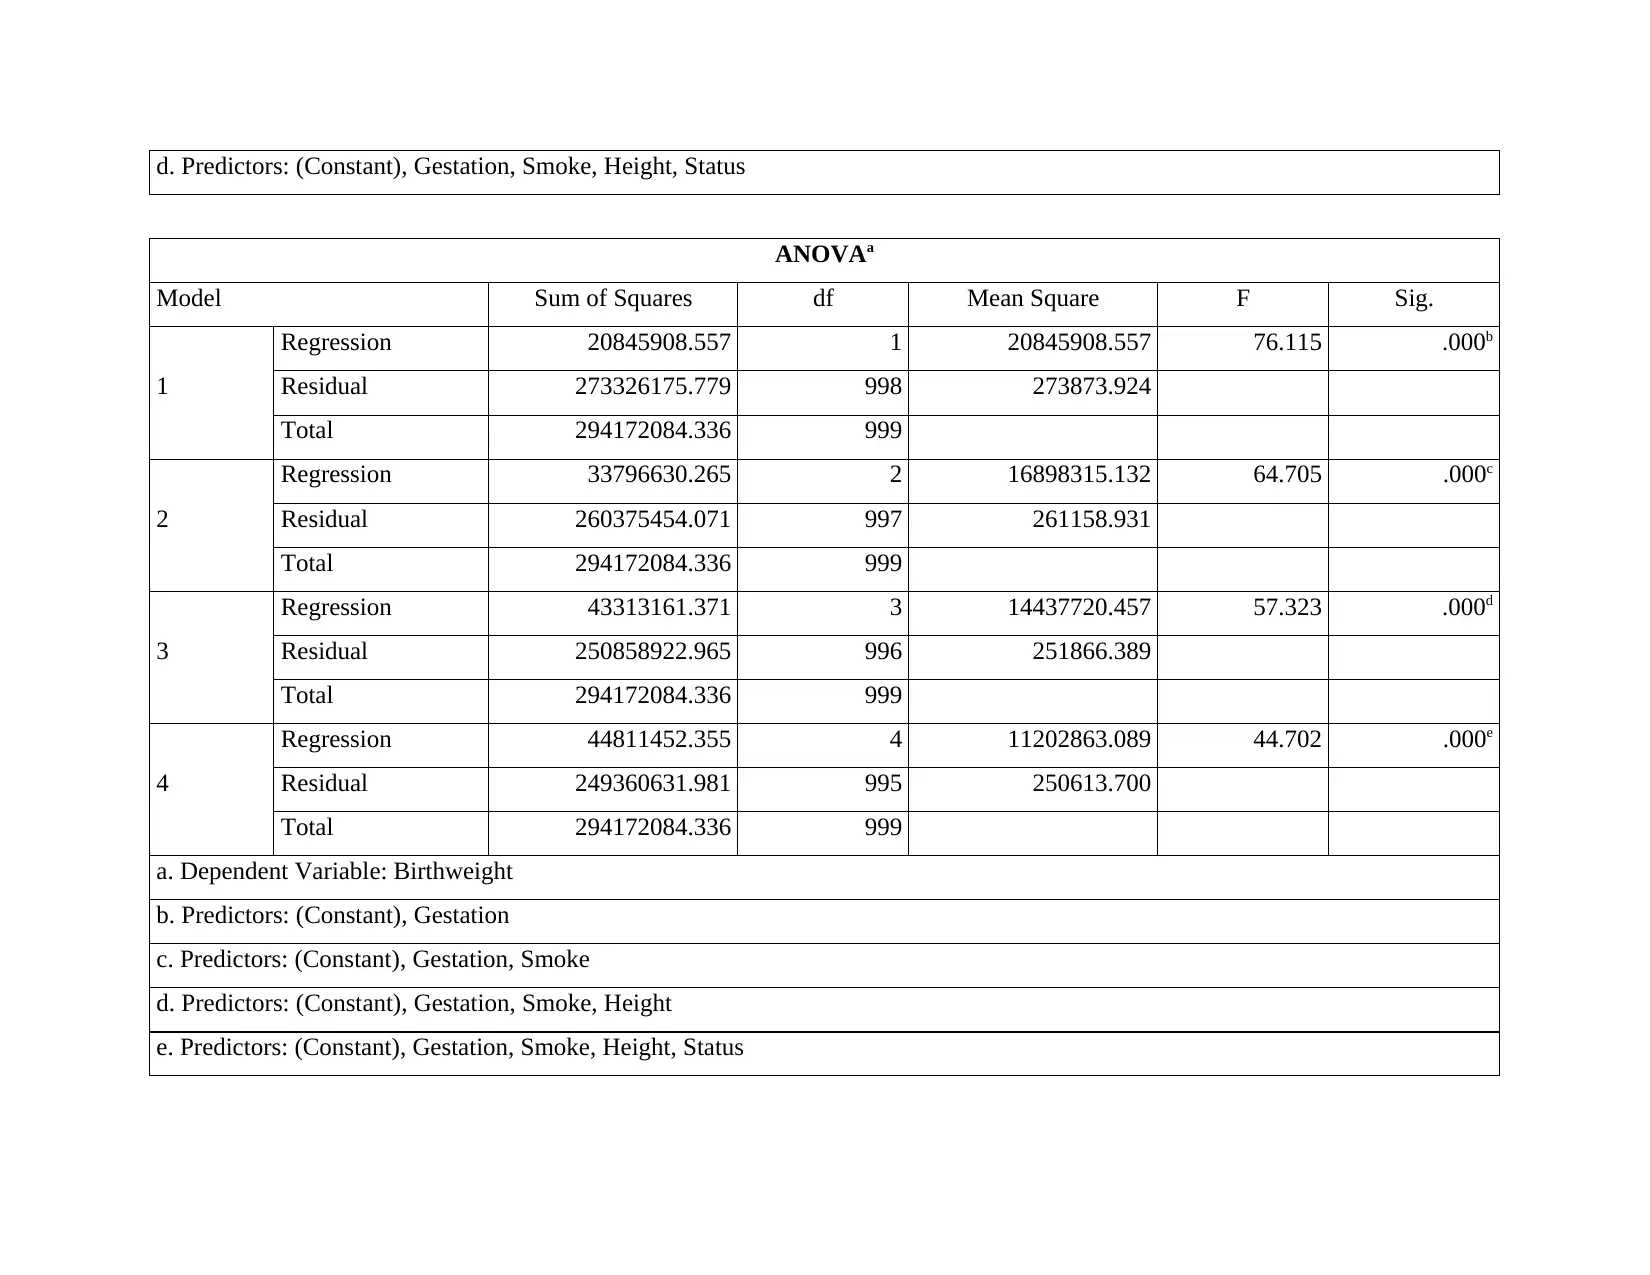
d. Predictors: (Constant), Gestation, Smoke, Height, Status
ANOVAa
Model Sum of Squares df Mean Square F Sig.
1
Regression 20845908.557 1 20845908.557 76.115 .000b
Residual 273326175.779 998 273873.924
Total 294172084.336 999
2
Regression 33796630.265 2 16898315.132 64.705 .000c
Residual 260375454.071 997 261158.931
Total 294172084.336 999
3
Regression 43313161.371 3 14437720.457 57.323 .000d
Residual 250858922.965 996 251866.389
Total 294172084.336 999
4
Regression 44811452.355 4 11202863.089 44.702 .000e
Residual 249360631.981 995 250613.700
Total 294172084.336 999
a. Dependent Variable: Birthweight
b. Predictors: (Constant), Gestation
c. Predictors: (Constant), Gestation, Smoke
d. Predictors: (Constant), Gestation, Smoke, Height
e. Predictors: (Constant), Gestation, Smoke, Height, Status
Paraphrase This Document
Need a fresh take? Get an instant paraphrase of this document with our AI Paraphraser
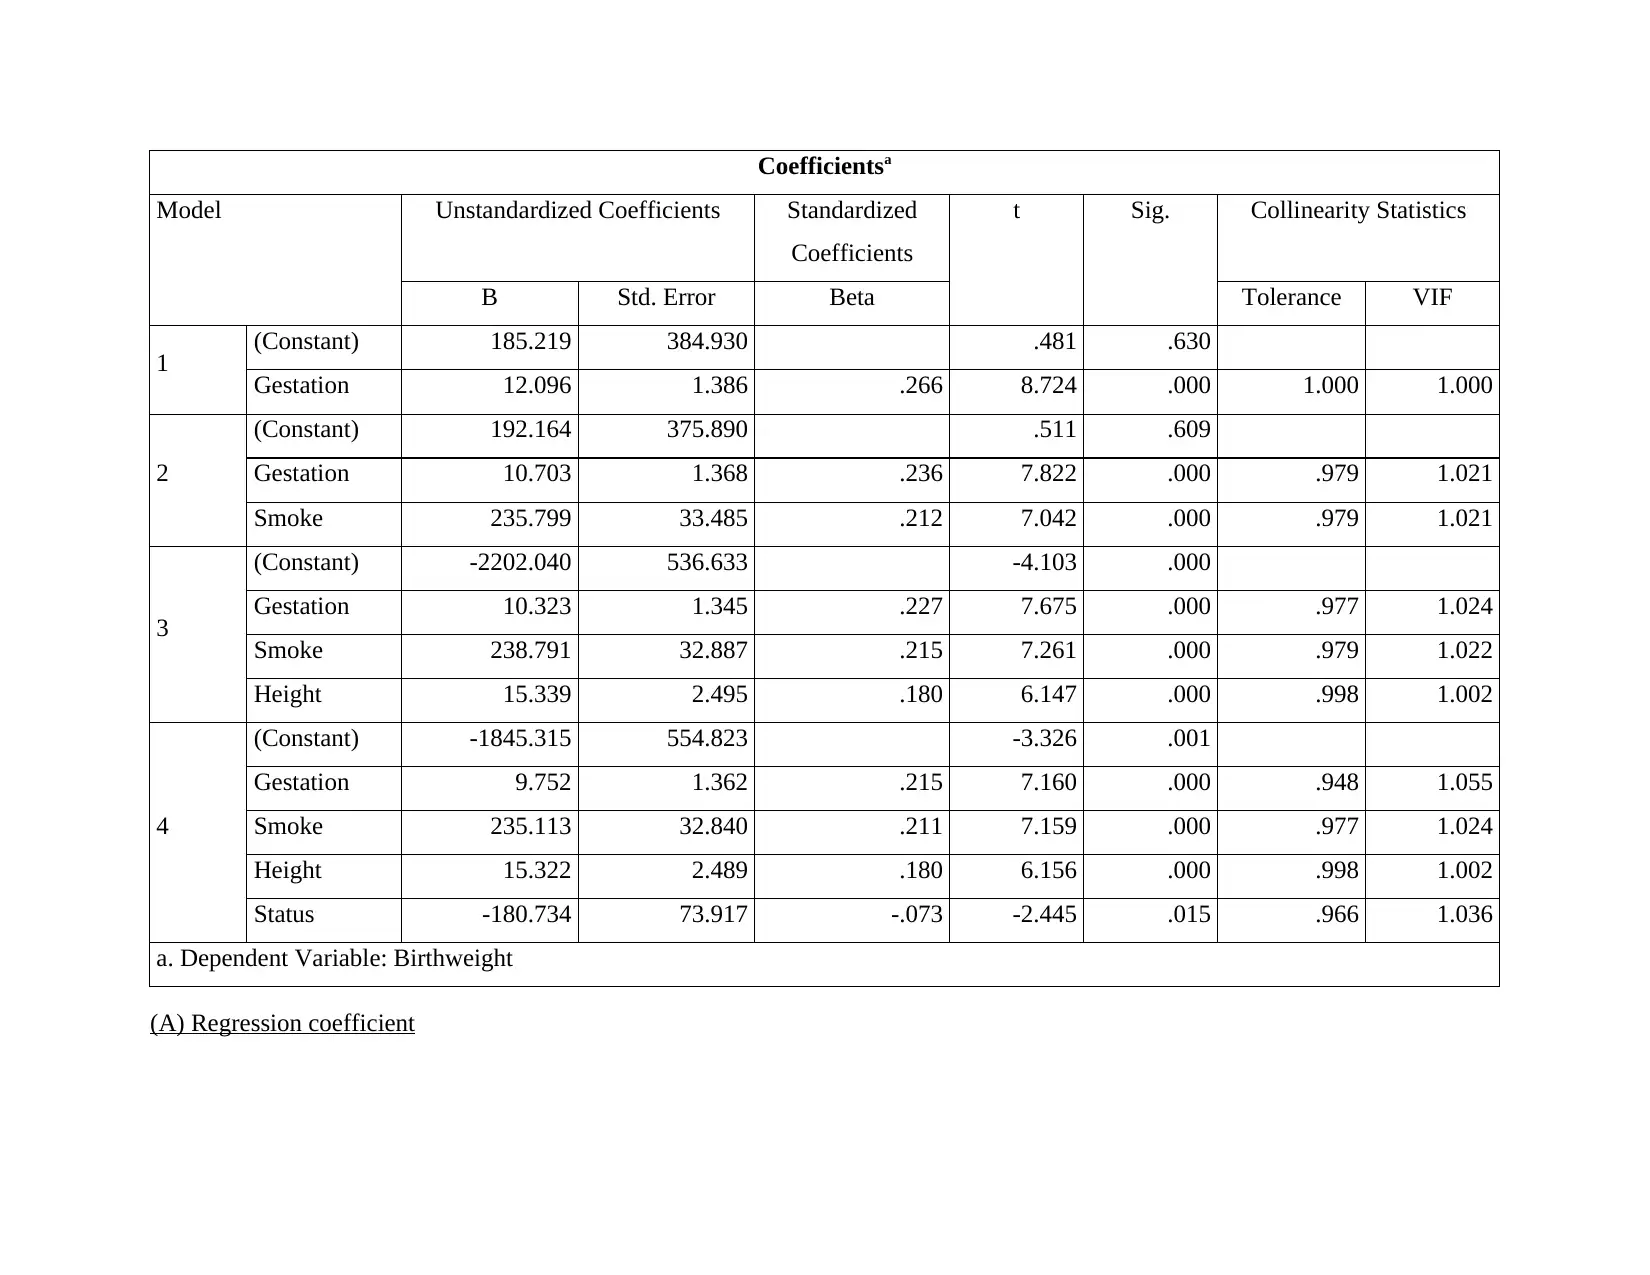
Coefficientsa
Model Unstandardized Coefficients Standardized
Coefficients
t Sig. Collinearity Statistics
B Std. Error Beta Tolerance VIF
1 (Constant) 185.219 384.930 .481 .630
Gestation 12.096 1.386 .266 8.724 .000 1.000 1.000
2
(Constant) 192.164 375.890 .511 .609
Gestation 10.703 1.368 .236 7.822 .000 .979 1.021
Smoke 235.799 33.485 .212 7.042 .000 .979 1.021
3
(Constant) -2202.040 536.633 -4.103 .000
Gestation 10.323 1.345 .227 7.675 .000 .977 1.024
Smoke 238.791 32.887 .215 7.261 .000 .979 1.022
Height 15.339 2.495 .180 6.147 .000 .998 1.002
4
(Constant) -1845.315 554.823 -3.326 .001
Gestation 9.752 1.362 .215 7.160 .000 .948 1.055
Smoke 235.113 32.840 .211 7.159 .000 .977 1.024
Height 15.322 2.489 .180 6.156 .000 .998 1.002
Status -180.734 73.917 -.073 -2.445 .015 .966 1.036
a. Dependent Variable: Birthweight
(A) Regression coefficient
Coefficients
Standard
Error t Stat P-value
Lower
95%
Upper
95%
Lower
95.0%
Upper
95.0%
Intercept -1767.283353 573.6535661 -3.08075 0.21% -2893 -641.571 -2893 -641.571
Gestation 9.670187253 1.365749902
7.08049
6 0.00% 6.9901 12.35027 6.9901 12.35027
Smoke 232.2779335 32.95588738
7.04814
7 0.00%
167.606
8 296.9491 167.6068 296.9491
Pre-pregnancy
weight 1.889045785 1.872550217
1.00880
9 31.33%
-
1.78556 5.563656 -1.78556 5.563656
Height 14.1439232 2.754137681
5.13551
8 0.00%
8.73932
5 19.54852 8.739325 19.54852
Status -180.2979259 73.96014857 -2.43777 1.50%
-
325.434 -35.1618 -325.434 -35.1618
Age 1.120907347 2.782524229
0.40283
8 68.72% -4.3394 6.58121 -4.3394 6.58121
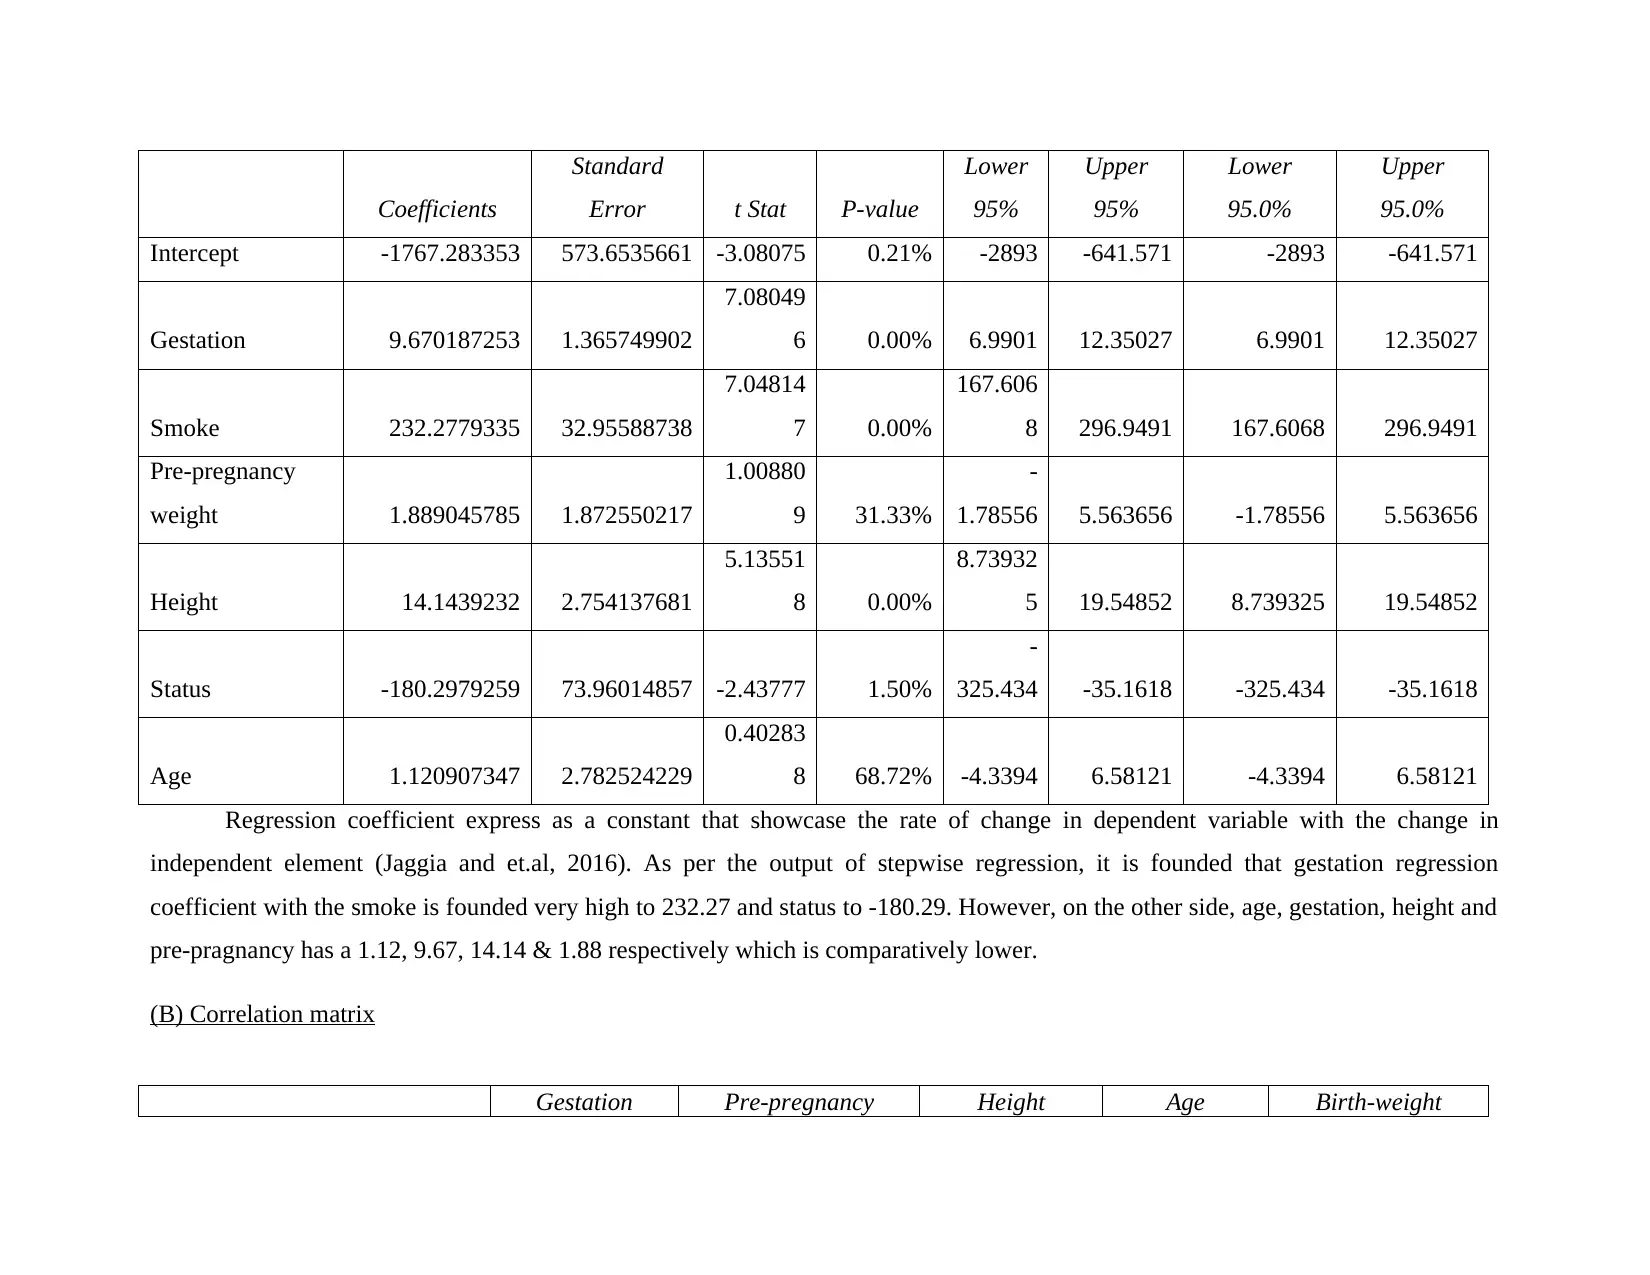
Regression coefficient express as a constant that showcase the rate of change in dependent variable with the change in
independent element (Jaggia and et.al, 2016). As per the output of stepwise regression, it is founded that gestation regression
coefficient with the smoke is founded very high to 232.27 and status to -180.29. However, on the other side, age, gestation, height and
pre-pragnancy has a 1.12, 9.67, 14.14 & 1.88 respectively which is comparatively lower.
(B) Correlation matrix
Gestation Pre-pregnancy Height Age Birth-weight
Standard
Error t Stat P-value
Lower
95%
Upper
95%
Lower
95.0%
Upper
95.0%
Intercept -1767.283353 573.6535661 -3.08075 0.21% -2893 -641.571 -2893 -641.571
Gestation 9.670187253 1.365749902
7.08049
6 0.00% 6.9901 12.35027 6.9901 12.35027
Smoke 232.2779335 32.95588738
7.04814
7 0.00%
167.606
8 296.9491 167.6068 296.9491
Pre-pregnancy
weight 1.889045785 1.872550217
1.00880
9 31.33%
-
1.78556 5.563656 -1.78556 5.563656
Height 14.1439232 2.754137681
5.13551
8 0.00%
8.73932
5 19.54852 8.739325 19.54852
Status -180.2979259 73.96014857 -2.43777 1.50%
-
325.434 -35.1618 -325.434 -35.1618
Age 1.120907347 2.782524229
0.40283
8 68.72% -4.3394 6.58121 -4.3394 6.58121
Regression coefficient express as a constant that showcase the rate of change in dependent variable with the change in
independent element (Jaggia and et.al, 2016). As per the output of stepwise regression, it is founded that gestation regression
coefficient with the smoke is founded very high to 232.27 and status to -180.29. However, on the other side, age, gestation, height and
pre-pragnancy has a 1.12, 9.67, 14.14 & 1.88 respectively which is comparatively lower.
(B) Correlation matrix
Gestation Pre-pregnancy Height Age Birth-weight
⊘ This is a preview!⊘
Do you want full access?
Subscribe today to unlock all pages.
Trusted by 1+ million students worldwide
weight
Gestation 1
Pre-pregnancy weight 0.08839 1
Height 0.044172 0.422038 1
Age -0.00904 0.153221 -0.00741 1
Birthweight 0.266201 0.138509 0.188322 0.02554 1
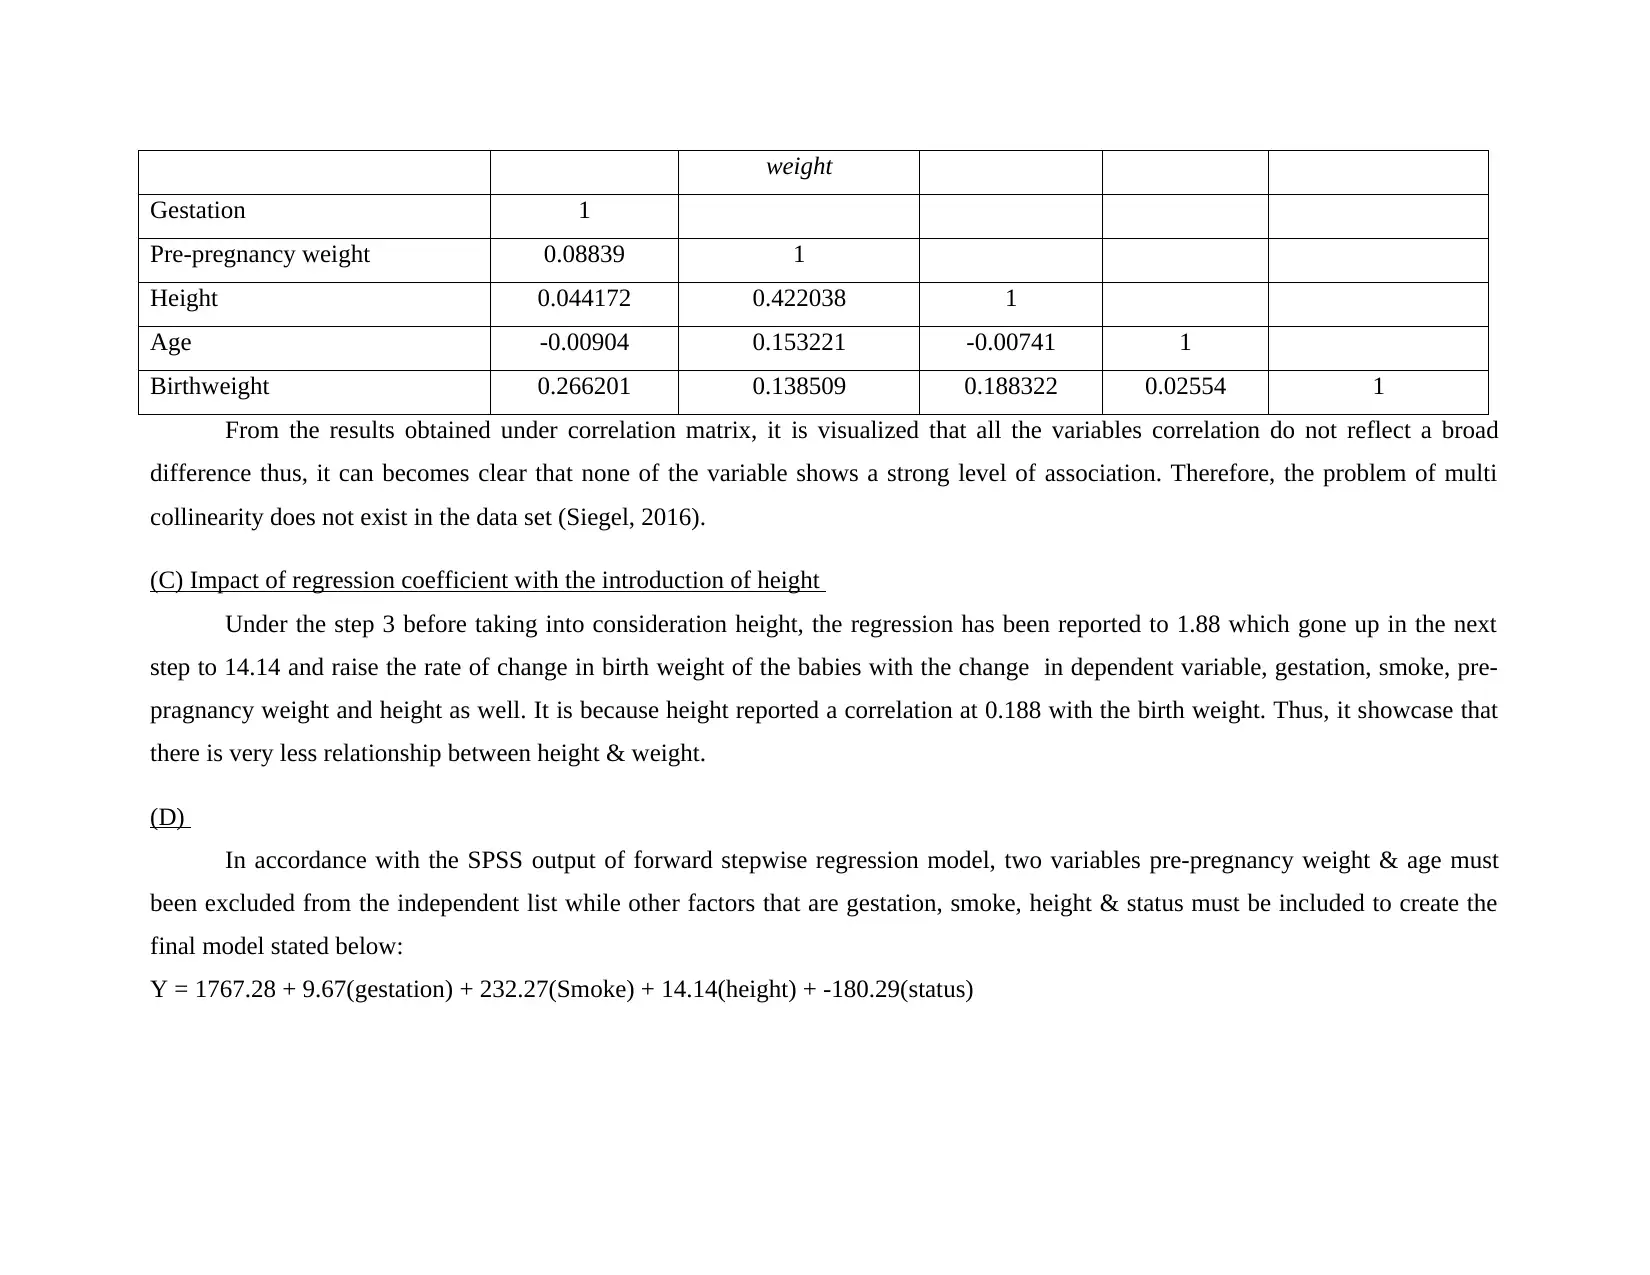
From the results obtained under correlation matrix, it is visualized that all the variables correlation do not reflect a broad
difference thus, it can becomes clear that none of the variable shows a strong level of association. Therefore, the problem of multi
collinearity does not exist in the data set (Siegel, 2016).
(C) Impact of regression coefficient with the introduction of height
Under the step 3 before taking into consideration height, the regression has been reported to 1.88 which gone up in the next
step to 14.14 and raise the rate of change in birth weight of the babies with the change in dependent variable, gestation, smoke, pre-
pragnancy weight and height as well. It is because height reported a correlation at 0.188 with the birth weight. Thus, it showcase that
there is very less relationship between height & weight.
(D)
In accordance with the SPSS output of forward stepwise regression model, two variables pre-pregnancy weight & age must
been excluded from the independent list while other factors that are gestation, smoke, height & status must be included to create the
final model stated below:
Y = 1767.28 + 9.67(gestation) + 232.27(Smoke) + 14.14(height) + -180.29(status)
Gestation 1
Pre-pregnancy weight 0.08839 1
Height 0.044172 0.422038 1
Age -0.00904 0.153221 -0.00741 1
Birthweight 0.266201 0.138509 0.188322 0.02554 1
From the results obtained under correlation matrix, it is visualized that all the variables correlation do not reflect a broad
difference thus, it can becomes clear that none of the variable shows a strong level of association. Therefore, the problem of multi
collinearity does not exist in the data set (Siegel, 2016).
(C) Impact of regression coefficient with the introduction of height
Under the step 3 before taking into consideration height, the regression has been reported to 1.88 which gone up in the next
step to 14.14 and raise the rate of change in birth weight of the babies with the change in dependent variable, gestation, smoke, pre-
pragnancy weight and height as well. It is because height reported a correlation at 0.188 with the birth weight. Thus, it showcase that
there is very less relationship between height & weight.
(D)
In accordance with the SPSS output of forward stepwise regression model, two variables pre-pregnancy weight & age must
been excluded from the independent list while other factors that are gestation, smoke, height & status must be included to create the
final model stated below:
Y = 1767.28 + 9.67(gestation) + 232.27(Smoke) + 14.14(height) + -180.29(status)
Paraphrase This Document
Need a fresh take? Get an instant paraphrase of this document with our AI Paraphraser
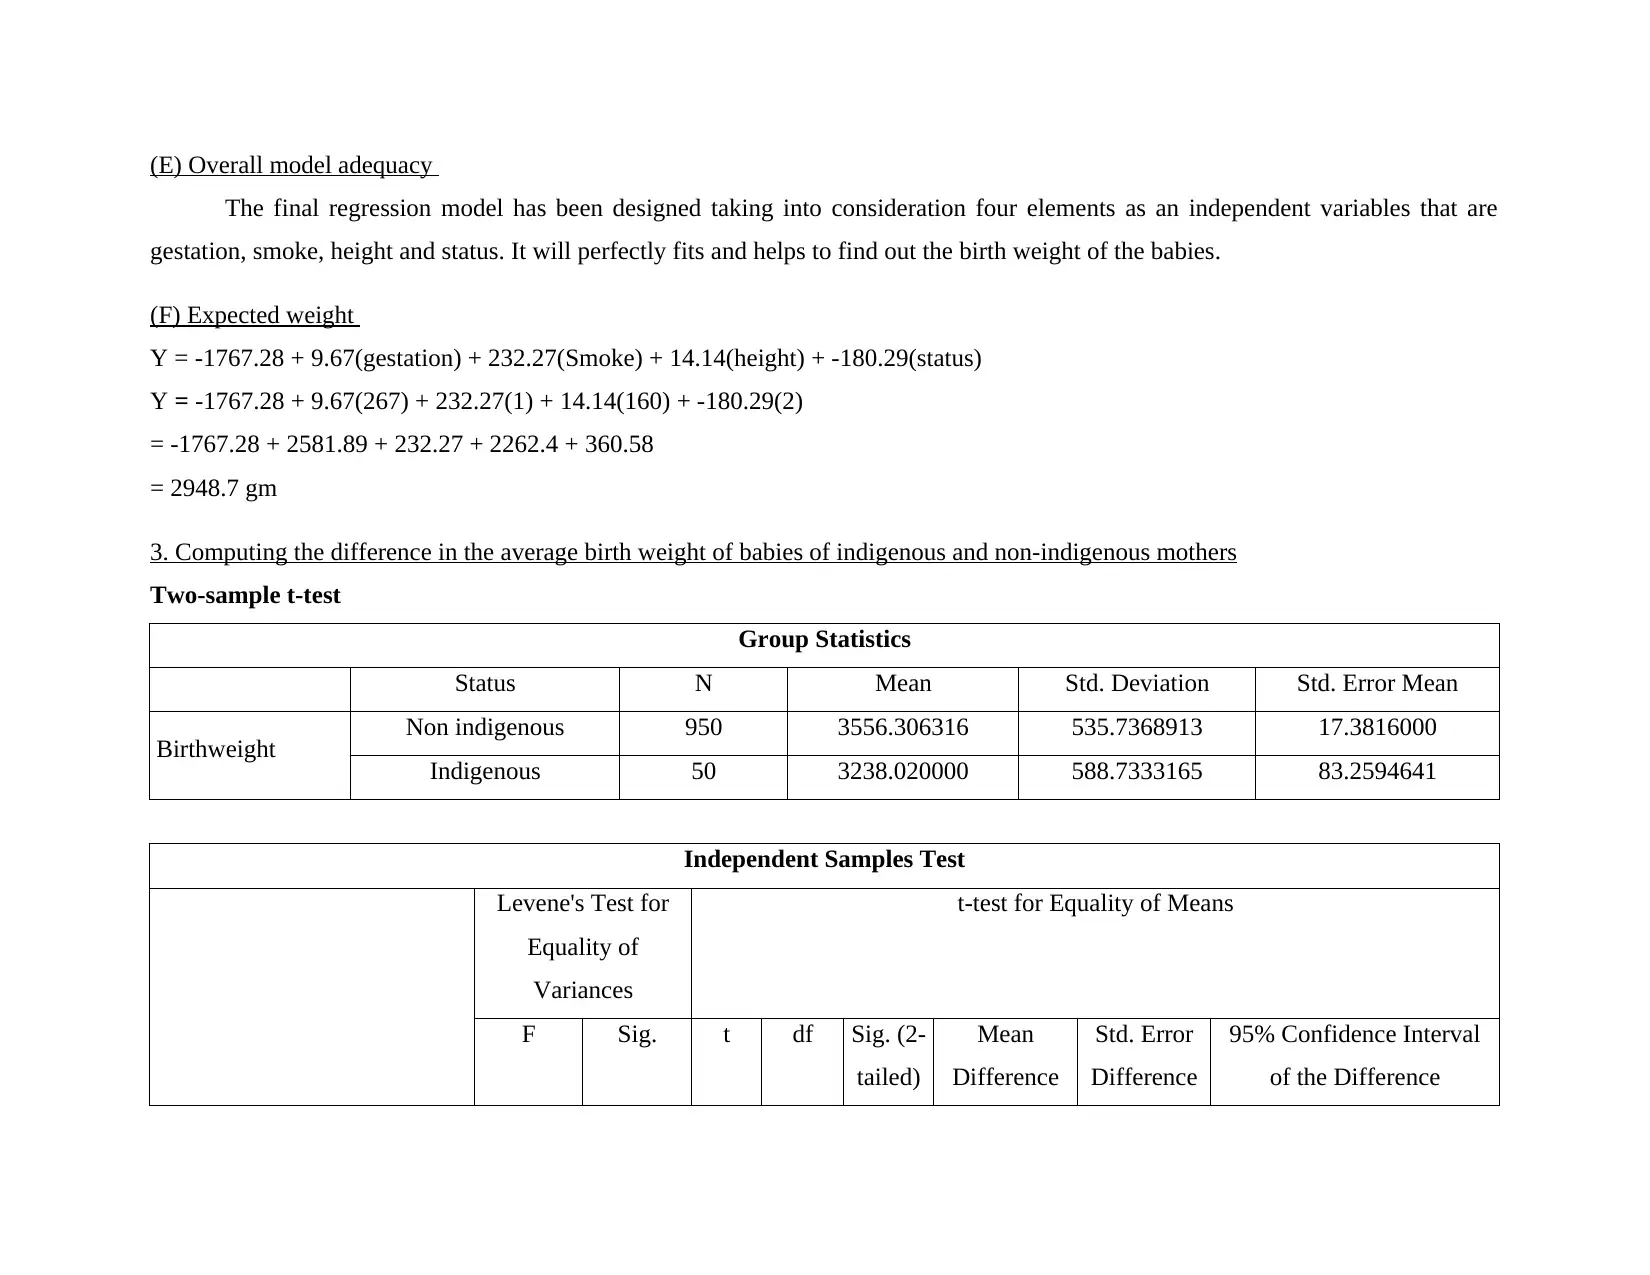
(E) Overall model adequacy
The final regression model has been designed taking into consideration four elements as an independent variables that are
gestation, smoke, height and status. It will perfectly fits and helps to find out the birth weight of the babies.
(F) Expected weight
Y = -1767.28 + 9.67(gestation) + 232.27(Smoke) + 14.14(height) + -180.29(status)
Y = -1767.28 + 9.67(267) + 232.27(1) + 14.14(160) + -180.29(2)
= -1767.28 + 2581.89 + 232.27 + 2262.4 + 360.58
= 2948.7 gm
3. Computing the difference in the average birth weight of babies of indigenous and non-indigenous mothers
Two-sample t-test
Group Statistics
Status N Mean Std. Deviation Std. Error Mean
Birthweight Non indigenous 950 3556.306316 535.7368913 17.3816000
Indigenous 50 3238.020000 588.7333165 83.2594641
Independent Samples Test
Levene's Test for
Equality of
Variances
t-test for Equality of Means
F Sig. t df Sig. (2-
tailed)
Mean
Difference
Std. Error
Difference
95% Confidence Interval
of the Difference
Lower Upper
Birthweigh
t
Equal variances
assumed 1.234 .267 4.074 998 .000 318.286315
8 78.1280893 164.972140
6 471.6004909
Equal variances
not assumed 3.742 53.359 .000 318.286315
8 85.0544436 147.715490
2 488.8571414
Regression model
Model Summary
Model R R Square Adjusted R Square Std. Error of the Estimate
1 .128a .016 .015 538.4606956
a. Predictors: (Constant), Status
Coefficientsa
Model Unstandardized Coefficients Standardized
Coefficients
t Sig. Collinearity Statistics
B Std. Error Beta Tolerance VIF
1 (Constant) 3874.593 83.783 46.246 .000
Status -318.286 78.128 -.128 -4.074 .000 1.000 1.000
a. Dependent Variable: Birthweight
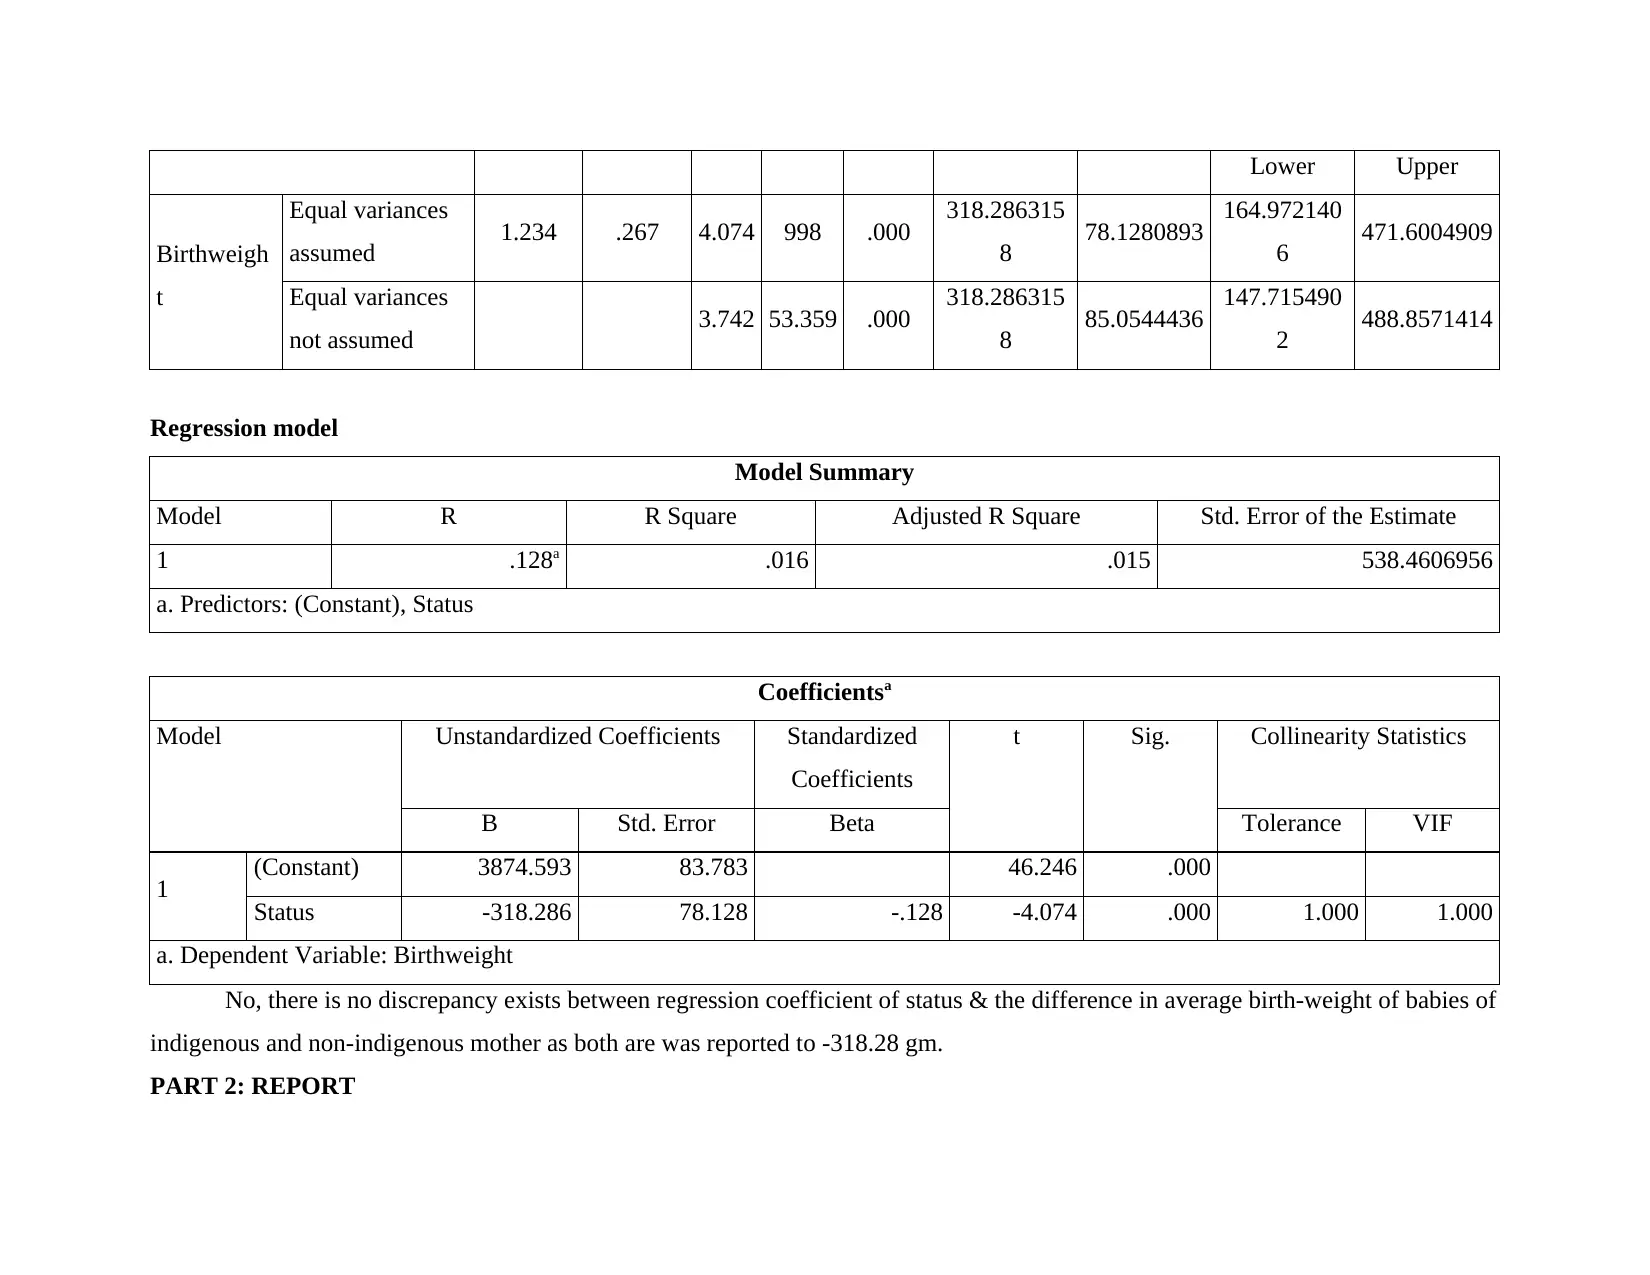
No, there is no discrepancy exists between regression coefficient of status & the difference in average birth-weight of babies of
indigenous and non-indigenous mother as both are was reported to -318.28 gm.
PART 2: REPORT
Birthweigh
t
Equal variances
assumed 1.234 .267 4.074 998 .000 318.286315
8 78.1280893 164.972140
6 471.6004909
Equal variances
not assumed 3.742 53.359 .000 318.286315
8 85.0544436 147.715490
2 488.8571414
Regression model
Model Summary
Model R R Square Adjusted R Square Std. Error of the Estimate
1 .128a .016 .015 538.4606956
a. Predictors: (Constant), Status
Coefficientsa
Model Unstandardized Coefficients Standardized
Coefficients
t Sig. Collinearity Statistics
B Std. Error Beta Tolerance VIF
1 (Constant) 3874.593 83.783 46.246 .000
Status -318.286 78.128 -.128 -4.074 .000 1.000 1.000
a. Dependent Variable: Birthweight
No, there is no discrepancy exists between regression coefficient of status & the difference in average birth-weight of babies of
indigenous and non-indigenous mother as both are was reported to -318.28 gm.
PART 2: REPORT
⊘ This is a preview!⊘
Do you want full access?
Subscribe today to unlock all pages.
Trusted by 1+ million students worldwide
1 out of 13
Related Documents


Your All-in-One AI-Powered Toolkit for Academic Success.
+13062052269
info@desklib.com
Available 24*7 on WhatsApp / Email
![[object Object]](/_next/static/media/star-bottom.7253800d.svg)
Unlock your academic potential
Copyright © 2020–2026 A2Z Services. All Rights Reserved. Developed and managed by ZUCOL.