Analysis of BIS Data: Business Support Barrier Identification Report
VerifiedAdded on 2023/01/11
|17
|2997
|27
Report
AI Summary
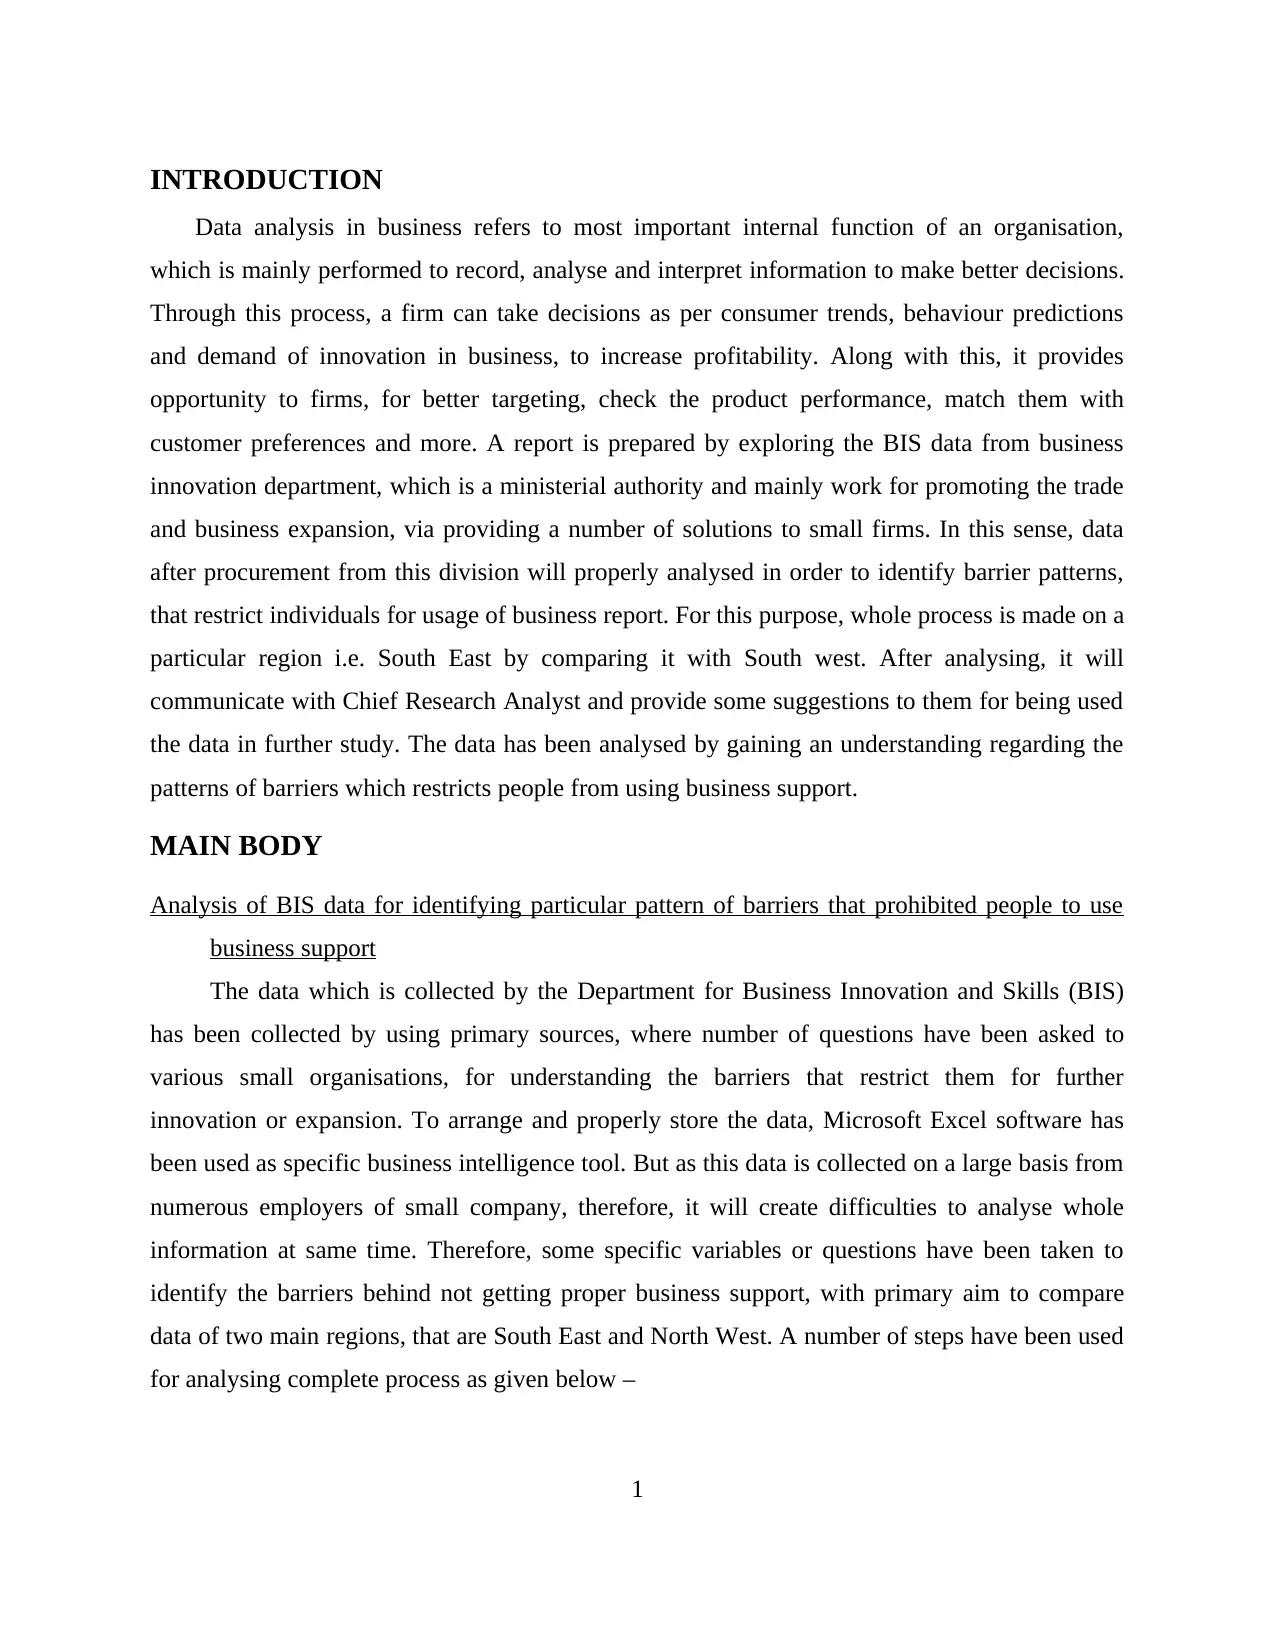
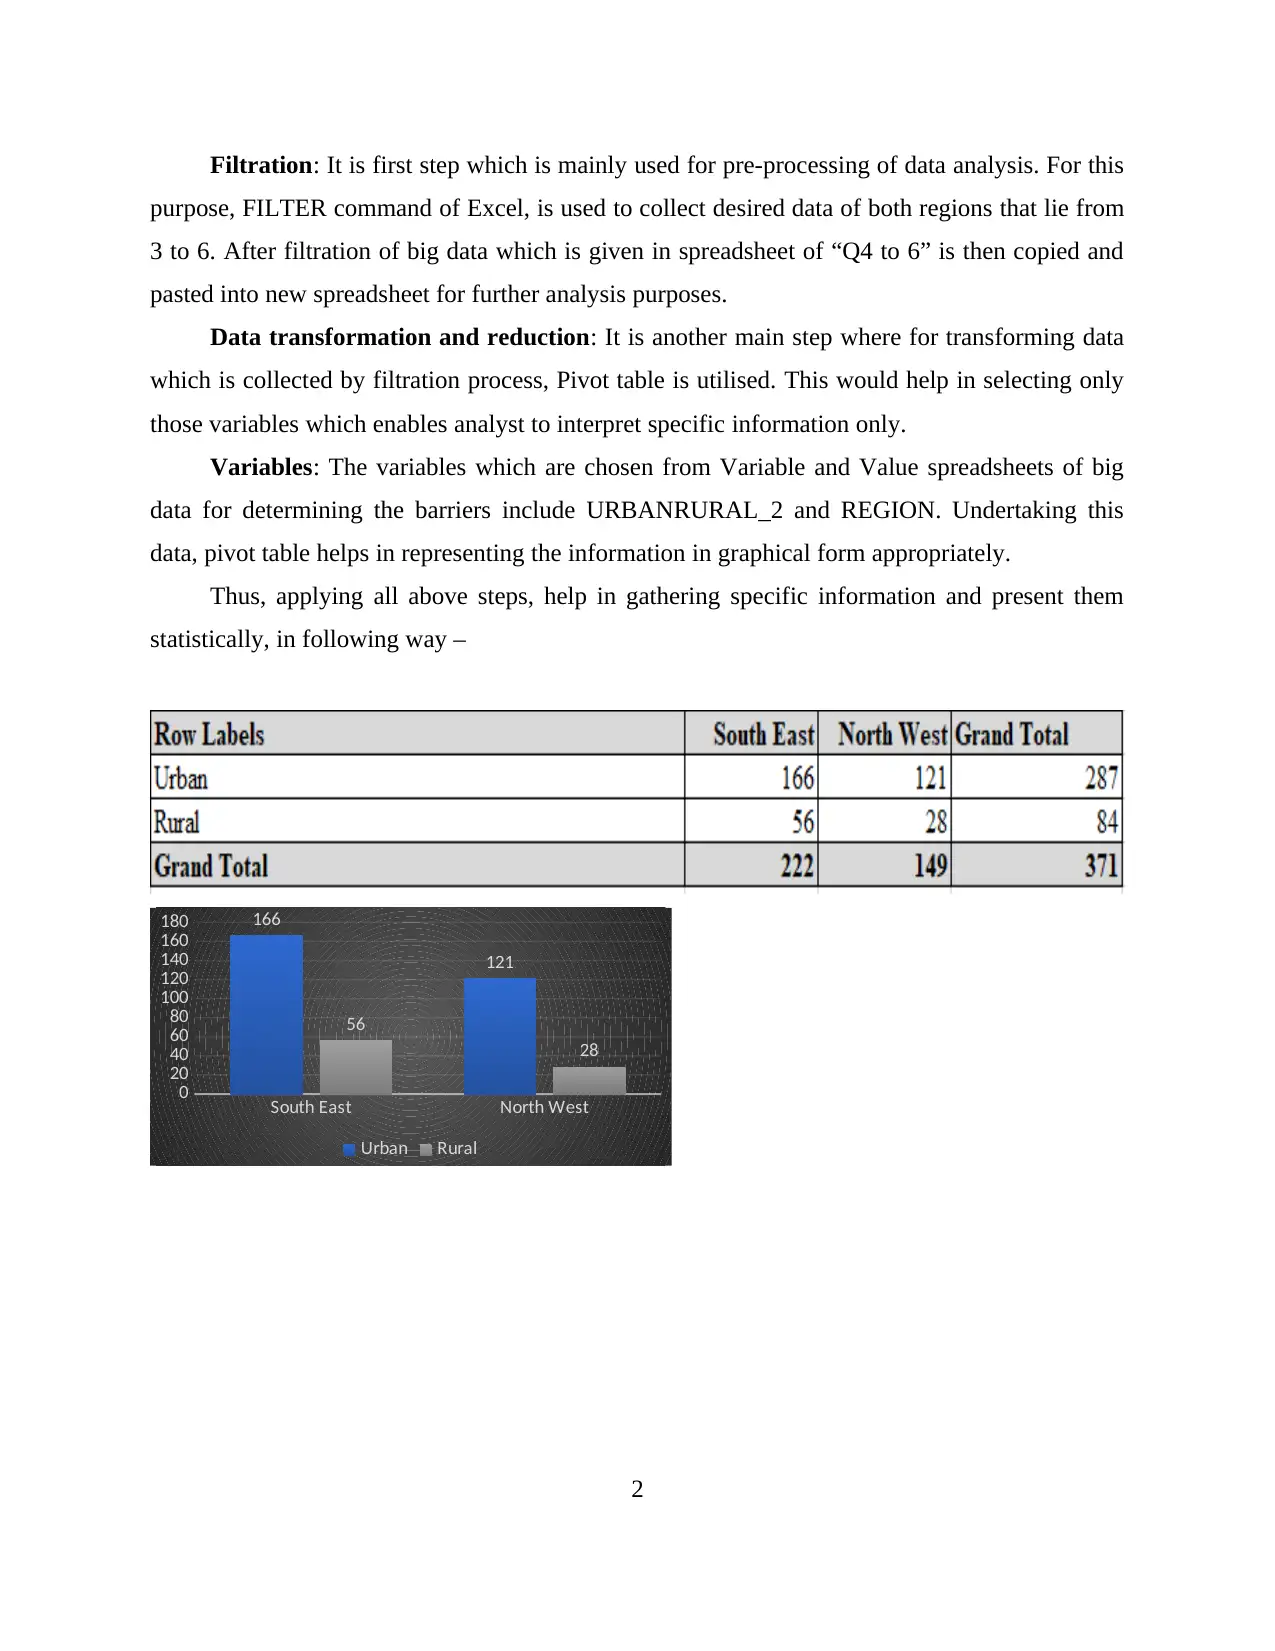
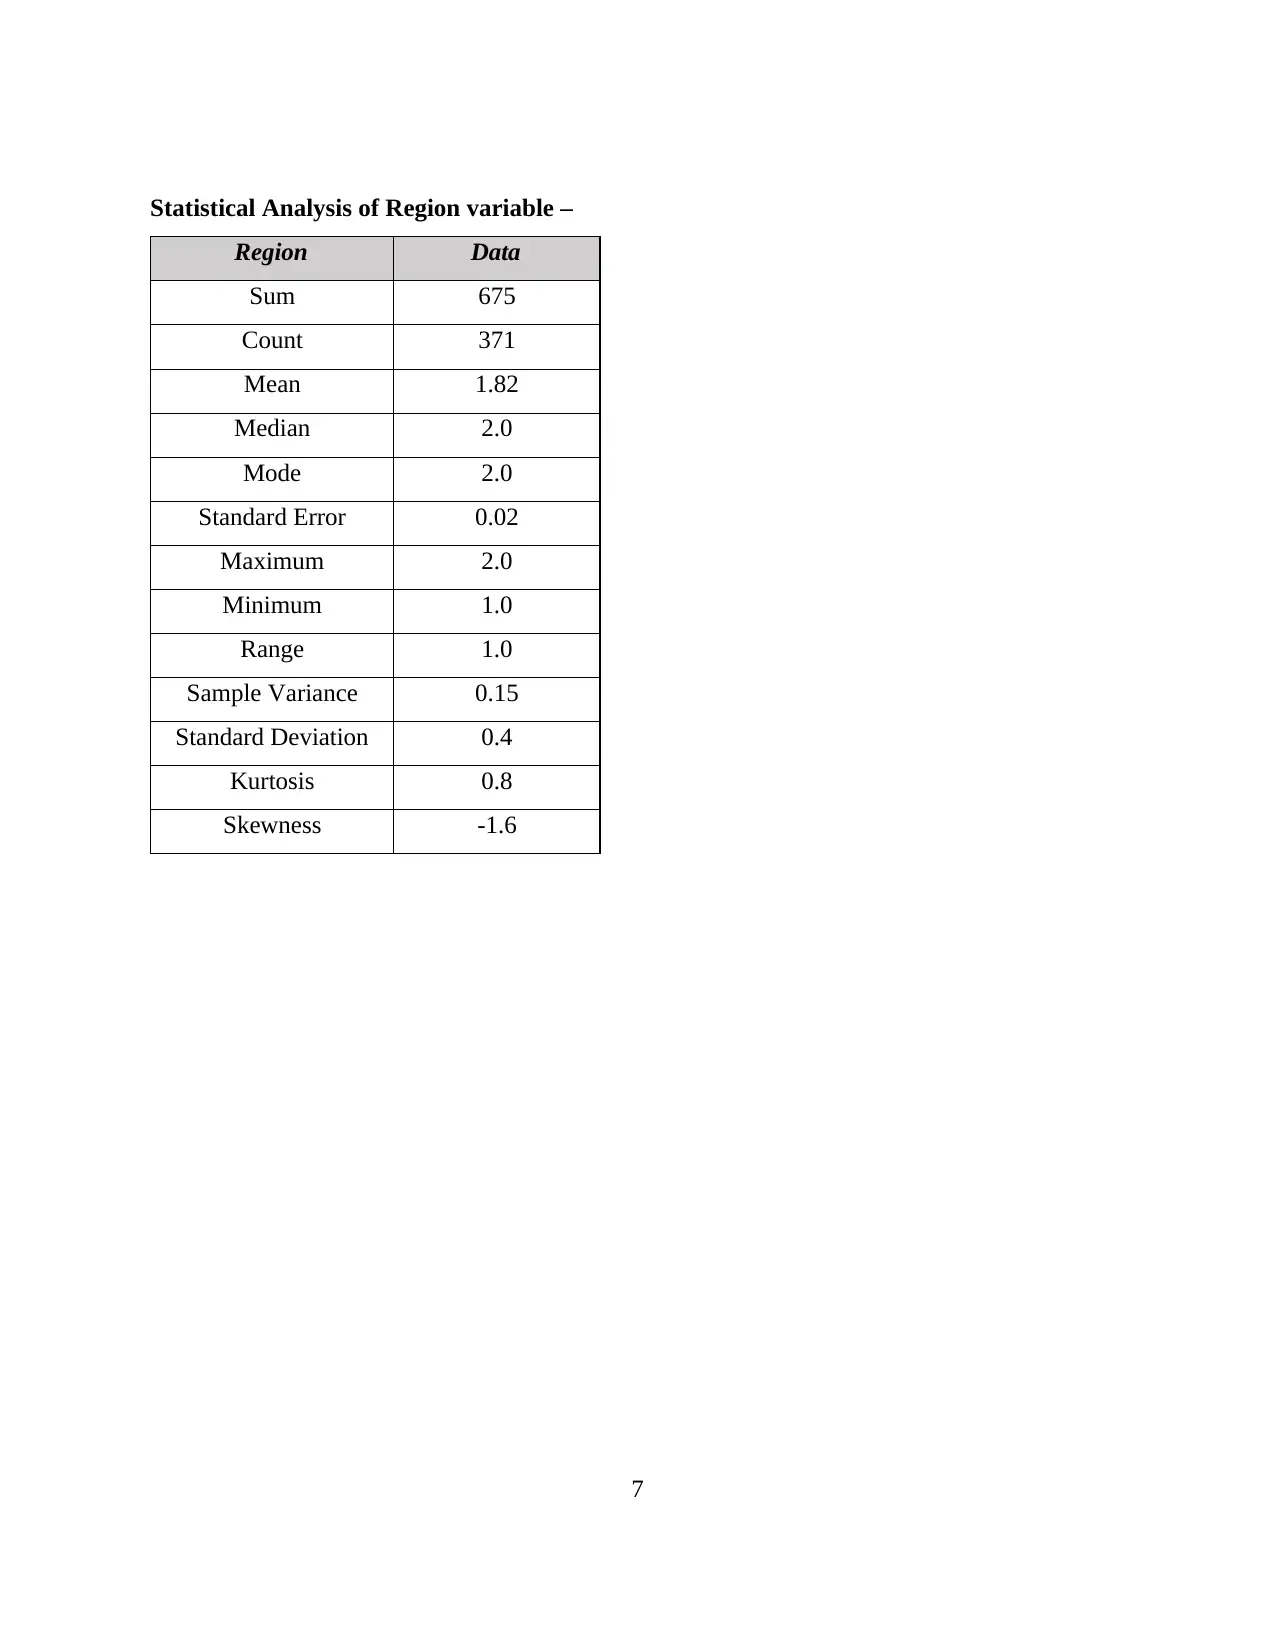
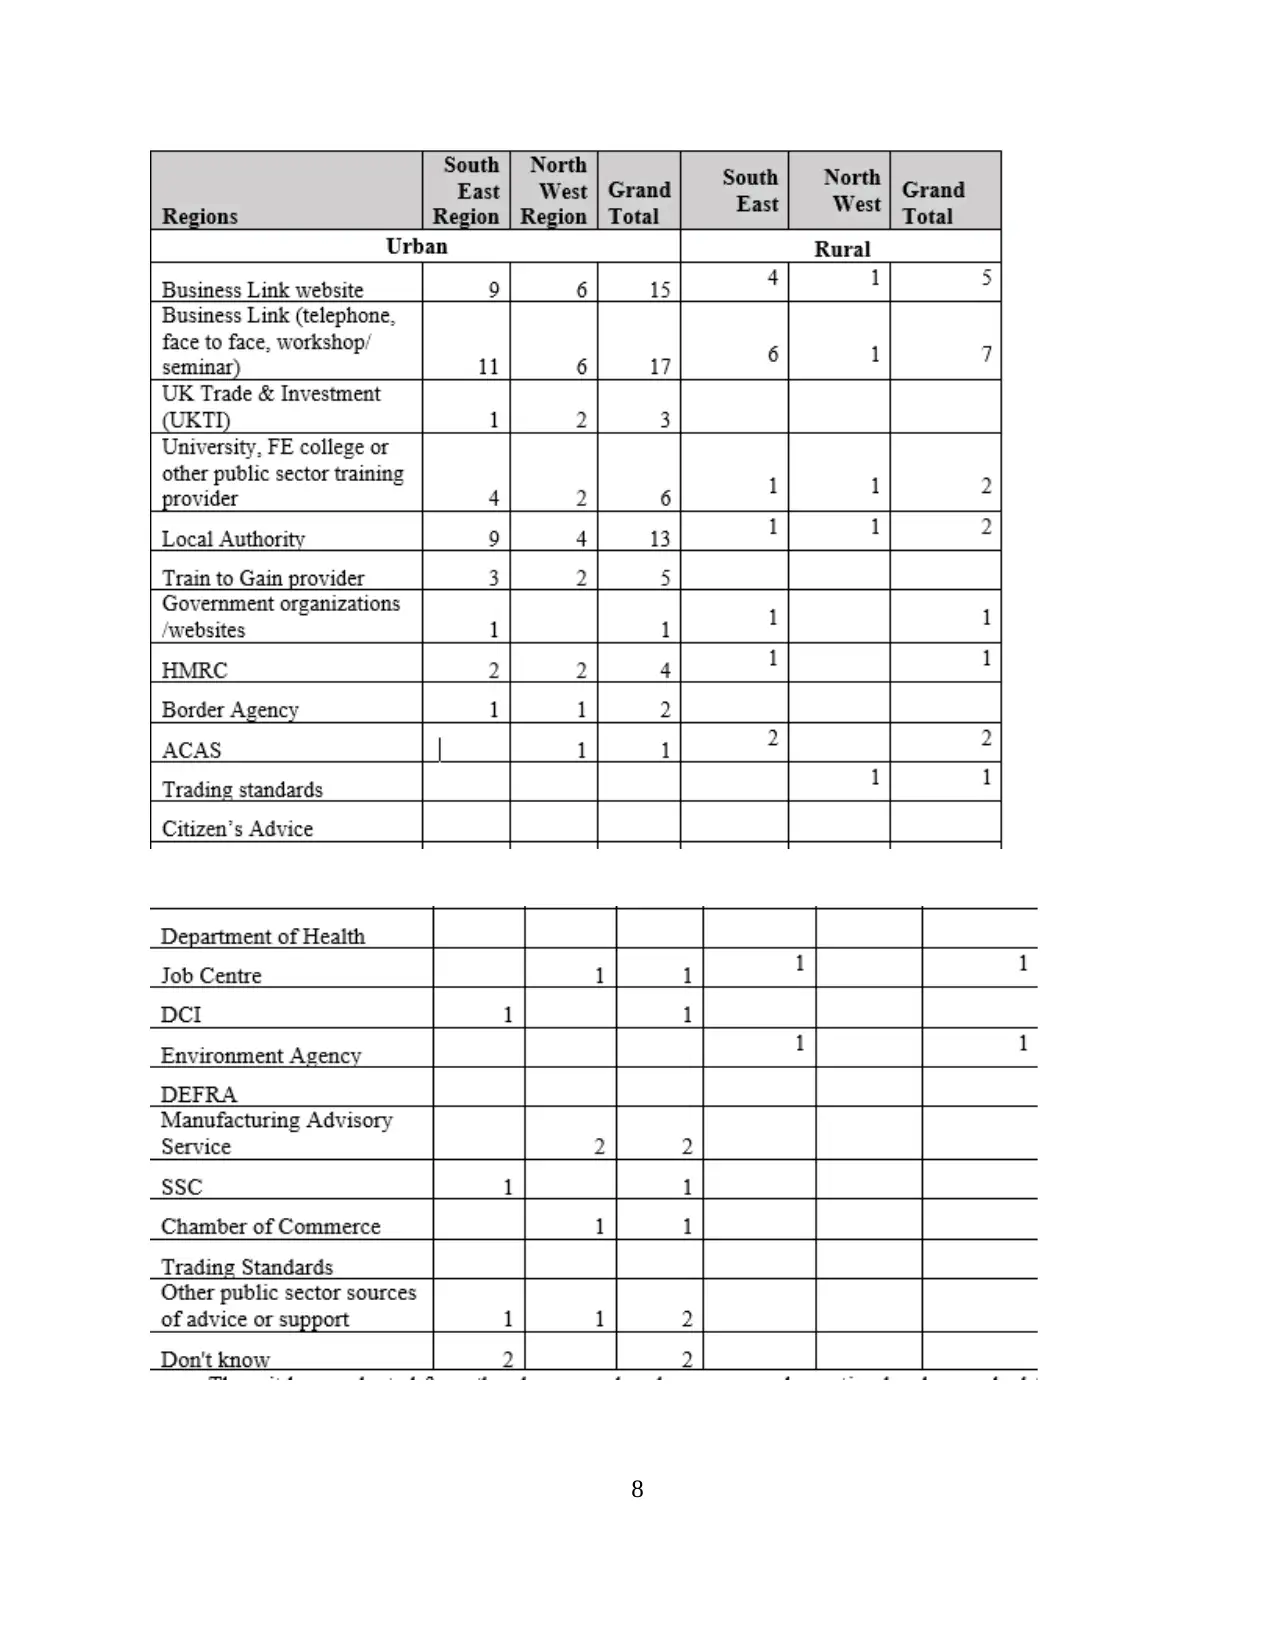
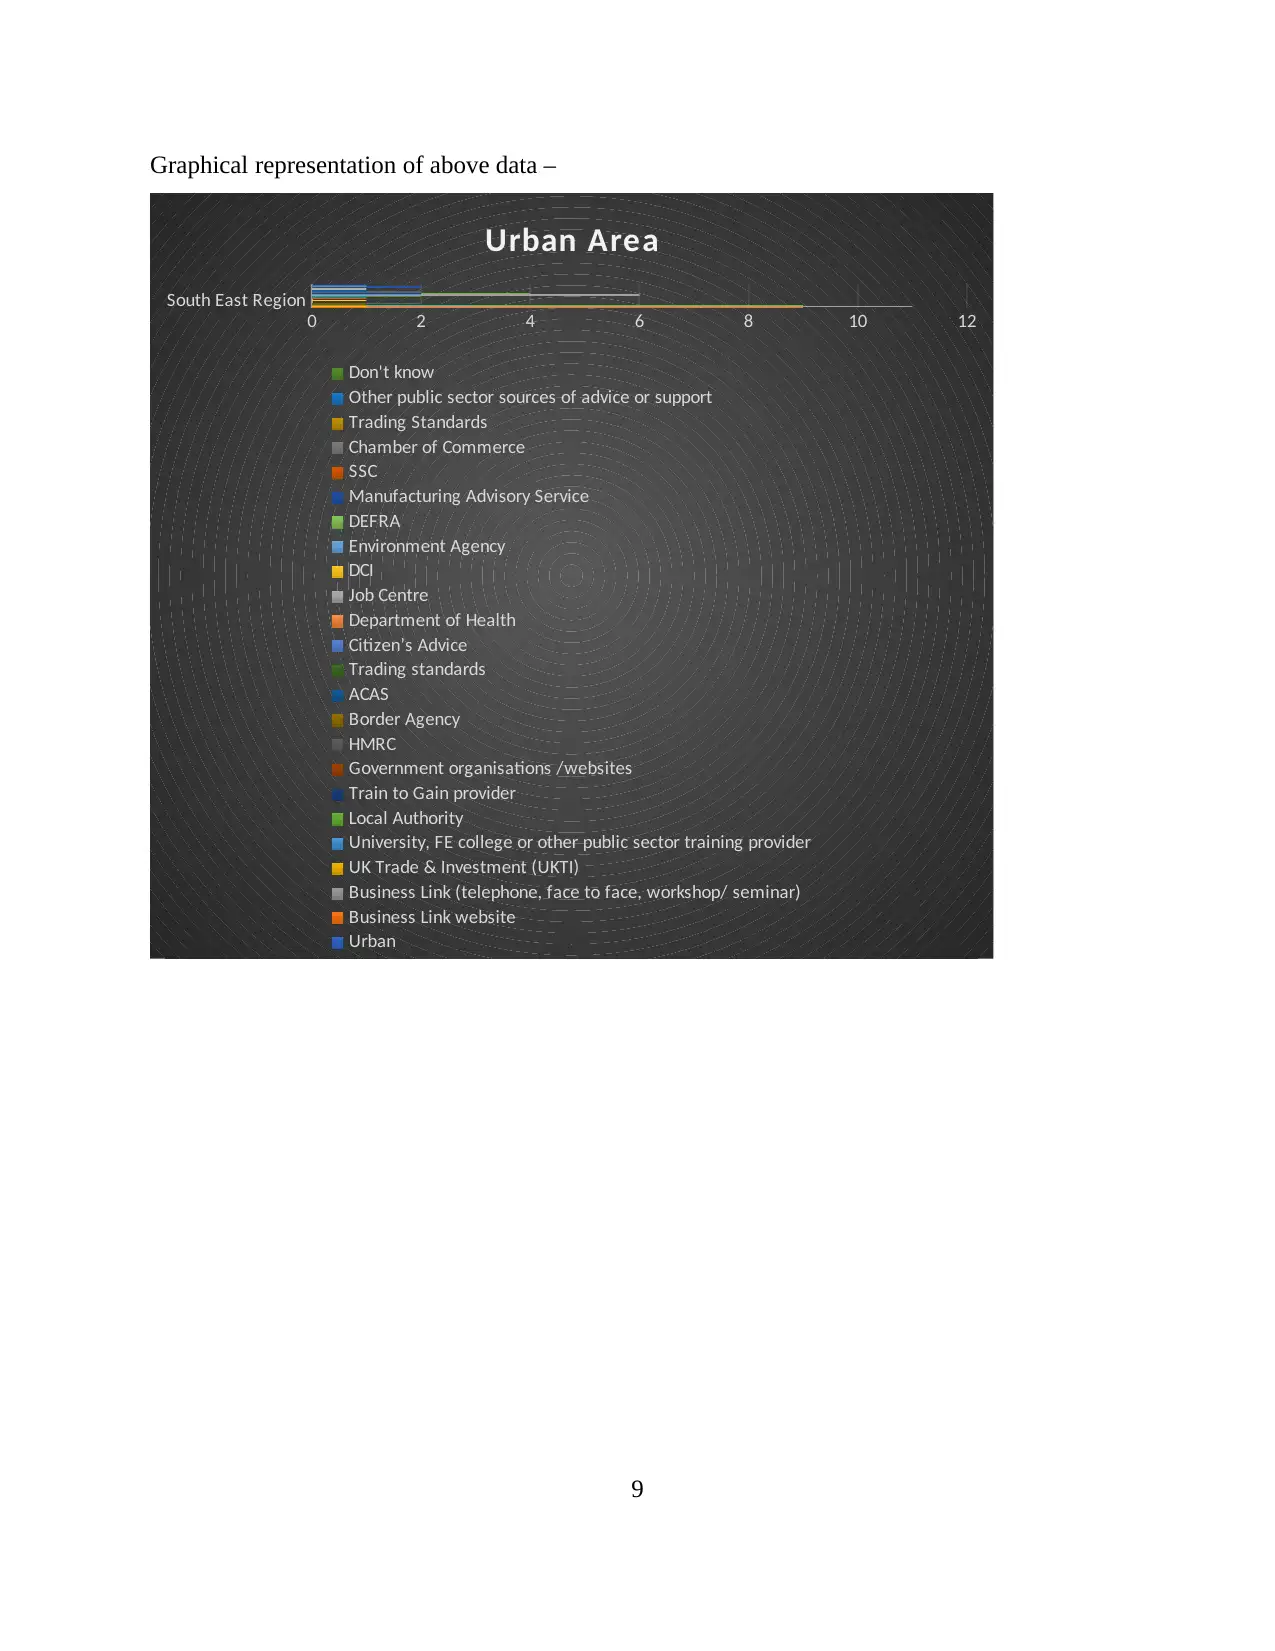
This report presents an analysis of data from the Department for Business Innovation and Skills (BIS), focusing on identifying barriers that prevent individuals and businesses from utilizing available business support resources. The analysis compares data from the South East and North West regions of the UK, utilizing Microsoft Excel for data organization and analysis. The study employs filtration, data transformation, and reduction techniques, including the use of pivot tables, to identify patterns and trends. The report examines variables such as urban/rural location and the type of business to understand the characteristics of businesses in each region. Key findings include differences in the utilization of public sector support between the regions, with urban areas in the South East receiving more support than those in the North West. The analysis also explores the types of support services used by businesses, such as Business Link and UK Trade & Investment, and the concerns businesses have regarding external advice. The report concludes by highlighting barriers related to low-skill levels and differences in support preferences, offering recommendations for improving business support accessibility and effectiveness.

BIS Data analysis
Paraphrase This Document
Need a fresh take? Get an instant paraphrase of this document with our AI Paraphraser

Contents
INTRODUCTION...........................................................................................................................1
MAIN BODY..................................................................................................................................1
Analysis of BIS data for identifying particular pattern of barriers that prohibited people to use
business support...........................................................................................................................1
Highlights of some interesting findings.....................................................................................13
Recommendations as per highlighted areas that require more support.....................................14
CONCLUSION..............................................................................................................................14

INTRODUCTION
Data analysis in business refers to most important internal function of an organisation,
which is mainly performed to record, analyse and interpret information to make better decisions.
Through this process, a firm can take decisions as per consumer trends, behaviour predictions
and demand of innovation in business, to increase profitability. Along with this, it provides
opportunity to firms, for better targeting, check the product performance, match them with
customer preferences and more. A report is prepared by exploring the BIS data from business
innovation department, which is a ministerial authority and mainly work for promoting the trade
and business expansion, via providing a number of solutions to small firms. In this sense, data
after procurement from this division will properly analysed in order to identify barrier patterns,
that restrict individuals for usage of business report. For this purpose, whole process is made on a
particular region i.e. South East by comparing it with South west. After analysing, it will
communicate with Chief Research Analyst and provide some suggestions to them for being used
the data in further study. The data has been analysed by gaining an understanding regarding the
patterns of barriers which restricts people from using business support.
MAIN BODY
Analysis of BIS data for identifying particular pattern of barriers that prohibited people to use
business support
The data which is collected by the Department for Business Innovation and Skills (BIS)
has been collected by using primary sources, where number of questions have been asked to
various small organisations, for understanding the barriers that restrict them for further
innovation or expansion. To arrange and properly store the data, Microsoft Excel software has
been used as specific business intelligence tool. But as this data is collected on a large basis from
numerous employers of small company, therefore, it will create difficulties to analyse whole
information at same time. Therefore, some specific variables or questions have been taken to
identify the barriers behind not getting proper business support, with primary aim to compare
data of two main regions, that are South East and North West. A number of steps have been used
for analysing complete process as given below –
1
⊘ This is a preview!⊘
Do you want full access?
Subscribe today to unlock all pages.

Trusted by 1+ million students worldwide

Filtration: It is first step which is mainly used for pre-processing of data analysis. For this
purpose, FILTER command of Excel, is used to collect desired data of both regions that lie from
3 to 6. After filtration of big data which is given in spreadsheet of “Q4 to 6” is then copied and
pasted into new spreadsheet for further analysis purposes.
Data transformation and reduction: It is another main step where for transforming data
which is collected by filtration process, Pivot table is utilised. This would help in selecting only
those variables which enables analyst to interpret specific information only.
Variables: The variables which are chosen from Variable and Value spreadsheets of big
data for determining the barriers include URBANRURAL_2 and REGION. Undertaking this
data, pivot table helps in representing the information in graphical form appropriately.
Thus, applying all above steps, help in gathering specific information and present them
statistically, in following way –
South East North West
0
20
40
60
80
100
120
140
160
180 166
121
56
28
Urban Rural
2
Paraphrase This Document
Need a fresh take? Get an instant paraphrase of this document with our AI Paraphraser

Statistical Table of Region variable –
Region Data
Sum 1560
Count 371
Mean 4.21
Median 3.0
Mode 3.0
Standard Error 0.08
Maximum 6.0
Minimum 3.0
Range 3.0
Sample Variance 2.2
Standard Deviation 1.48
Kurtosis -1.8
Skewness 0.4
Statistical Table of Region variable –
Region Data
Sum 455
Count 371
Mean 1.2
Median 1.0
Mode 1.0
Standard Error 0.02
Maximum 2.0
Minimum 1.0
Range 1.0
Sample Variance 0.18
Standard Deviation 0.42
Kurtosis -0.3
3
Region Data
Sum 1560
Count 371
Mean 4.21
Median 3.0
Mode 3.0
Standard Error 0.08
Maximum 6.0
Minimum 3.0
Range 3.0
Sample Variance 2.2
Standard Deviation 1.48
Kurtosis -1.8
Skewness 0.4
Statistical Table of Region variable –
Region Data
Sum 455
Count 371
Mean 1.2
Median 1.0
Mode 1.0
Standard Error 0.02
Maximum 2.0
Minimum 1.0
Range 1.0
Sample Variance 0.18
Standard Deviation 0.42
Kurtosis -0.3
3

Skewness 1.3
Thus, after applying the statistical methods like mean, median, mode and other central
tendencies on chosen data, it has been identified that South East relatively has more smaller
organisations as compared to region of North West. So, this factor illustrates the high economic
value of South East. Although, North West area has higher organisations in urban areas than
rural ones, where on contrast, it has been found that South East region, employers are mainly
deal in rural type of businesses. Therefore, it has been interpreted that both regions have
possessed small organisations in different-different areas, so, there might some reasons present
that create barriers in front of them for further expansion at large level. Therefore, to analyse
such factors and identify particular pattern of barriers, it is essential to determine which business
data have already been used by firms of both regions. This would help in evaluating barriers that
causes limitations in expansion or trading at another level. From big data which is collected from
primary sources, Q1-1a is chosen which is “Would you classify your organisation as one mainly
seeking to make a profit; as a charity or voluntary sector organisation; or as a government
financed body (either by central or local government)?”. After asking this question, to
employers of both regions that are South East and North West, result has been arranged in
following way –
Regions South East North West Total
Urban 166 121 287
Commercial business who seek to profit
mainly 166 121 287
Rural 56 28 84
Commercial business who seek to profit
mainly 56 28 84
Total 222 149 371
4
⊘ This is a preview!⊘
Do you want full access?
Subscribe today to unlock all pages.

Trusted by 1+ million students worldwide

1 2
166
56
121
28
South East North West
Urban Rural
Through this statistical information, it has been evaluated that organisations of both
regions that are South East and Noth West are mainly seek to gain high profitability. Therefore,
at this point, it is difficult to make comparison of both regions, but has been analysed that urban
areas of these regions are more concerned than rural areas, to acquire profit for further growth.
Now, in order to gather more information for further comparison, another question is asked
to them – “Q3.5. And now can I ask since your business was established/ during the last three
years, has your business used assistance or support from public sector organisations to provide
you with information about the day to day running of your business?”. So, taking this question
information about whether organisations of South East and North West has gained any support of
public sector firms can be analysed. This would also help in analysing how much public
authorities give support to private sectors in expansion of their business, so that better steps can
be taken for the same. In this regard, following information has been gathered from big data
given in excel sheet –
Regions
South East
Regions
North West
Regions Total
Urban 166 121 287
High Support 28 19 47
No support 138 102 240
Rural 56 28 84
High Support 16 4 20
No Support 40 24 64
Total 222 149 371
5
Paraphrase This Document
Need a fresh take? Get an instant paraphrase of this document with our AI Paraphraser

Urban
High Support
No support
Rural
High Support
No Support
0 20 40 60 80 100 120 140 160 180
North West Regions South East Regions
Thus, it has evaluated from the above graph, where a general question has been asked to
private organisations of urban and rural sectors of both regions (North East and South West)
about any support of public authorities, it has been analysed that maximum of them do not get
the same. In this sense, it has been further evaluated that urban regions of South East region as
compared with North West, receive higher support from organisations of public sectors. But
firms operate in rural areas of both regions relatively not get much support from public firms.
Therefore, on this basis of assumption, it has been identified that having low skilled and less
abilities to contribute their role in developing economy, public organisations of these regions
ignore to support them in resolving business issues and for further growth. This has highlighted
one of the major barrier faced by rural sector firms. In this regard, after gathering entire
information about South East and North West regions, to analyse what type of support or specific
services, required by organisations from public sector, another questions have been asked, as
given in the excel sheet from as –
Q3.6 A. What kind of organisations have you used? : Business Link website
Q3.6 B. What kind of organisations have you used?: Business Link (telephone, face to face,
workshop/ seminar)
Q3.6. What kind of organisations have you used?: UK Trade & Investment (UKTI)
After asking these questions from smaller organisations of both regions, their responsse
are collected and represented in following way –
6
High Support
No support
Rural
High Support
No Support
0 20 40 60 80 100 120 140 160 180
North West Regions South East Regions
Thus, it has evaluated from the above graph, where a general question has been asked to
private organisations of urban and rural sectors of both regions (North East and South West)
about any support of public authorities, it has been analysed that maximum of them do not get
the same. In this sense, it has been further evaluated that urban regions of South East region as
compared with North West, receive higher support from organisations of public sectors. But
firms operate in rural areas of both regions relatively not get much support from public firms.
Therefore, on this basis of assumption, it has been identified that having low skilled and less
abilities to contribute their role in developing economy, public organisations of these regions
ignore to support them in resolving business issues and for further growth. This has highlighted
one of the major barrier faced by rural sector firms. In this regard, after gathering entire
information about South East and North West regions, to analyse what type of support or specific
services, required by organisations from public sector, another questions have been asked, as
given in the excel sheet from as –
Q3.6 A. What kind of organisations have you used? : Business Link website
Q3.6 B. What kind of organisations have you used?: Business Link (telephone, face to face,
workshop/ seminar)
Q3.6. What kind of organisations have you used?: UK Trade & Investment (UKTI)
After asking these questions from smaller organisations of both regions, their responsse
are collected and represented in following way –
6

Statistical Analysis of Region variable –
Region Data
Sum 675
Count 371
Mean 1.82
Median 2.0
Mode 2.0
Standard Error 0.02
Maximum 2.0
Minimum 1.0
Range 1.0
Sample Variance 0.15
Standard Deviation 0.4
Kurtosis 0.8
Skewness -1.6
7
Region Data
Sum 675
Count 371
Mean 1.82
Median 2.0
Mode 2.0
Standard Error 0.02
Maximum 2.0
Minimum 1.0
Range 1.0
Sample Variance 0.15
Standard Deviation 0.4
Kurtosis 0.8
Skewness -1.6
7
⊘ This is a preview!⊘
Do you want full access?
Subscribe today to unlock all pages.

Trusted by 1+ million students worldwide

8
Paraphrase This Document
Need a fresh take? Get an instant paraphrase of this document with our AI Paraphraser

Graphical representation of above data –
South East Region
0 2 4 6 8 10 12
Urban Area
Don't know
Other public sector sources of advice or support
Trading Standards
Chamber of Commerce
SSC
Manufacturing Advisory Service
DEFRA
Environment Agency
DCI
Job Centre
Department of Health
Citizen’s Advice
Trading standards
ACAS
Border Agency
HMRC
Government organisations /websites
Train to Gain provider
Local Authority
University, FE college or other public sector training provider
UK Trade & Investment (UKTI)
Business Link (telephone, face to face, workshop/ seminar)
Business Link website
Urban
9

Rural
Don't know
Other public sector sources of advice or support
Trading Standards
Chamber of Commerce
SSC
Manufacturing Advisory Service
DEFRA
Environment Agency
DCI
Job Centre
Department of Health
Citizen’s Advice
Trading standards
ACAS
Border Agency
HMRC
Government organisations /websites
Train to Gain provider
Local Authority
University, FE college or other public sector training provider
UK Trade & Investment (UKTI)
Business Link (telephone, face to face, workshop/ seminar)
Business Link website
Rural
From these statistical information analysis, it has been analysed that mostly private sector
organisations of South West regions use business link services, which are being provided from
public authorities who work mostly to provide support for resolving their solutions, like BIS. On
contrast, smaller employers of North West region mostly not prefer to get same service (business
link websites), for enhancing their business operations at large level. So, this point indicates
differences of seeking support of organisations of both regions in terms of services, seeking from
public sectors. Thus, it has been identified that differences in preferences of support is another
main barrier after low-skill, that arise difficulties for individuals in their business expansion.
Now, for further analysis and better discussion, more questions have been asked, which are
shortlisted from big data as given below –
10
⊘ This is a preview!⊘
Do you want full access?
Subscribe today to unlock all pages.

Trusted by 1+ million students worldwide
1 out of 17
Related Documents

Your All-in-One AI-Powered Toolkit for Academic Success.
+13062052269
info@desklib.com
Available 24*7 on WhatsApp / Email
Unlock your academic potential
Copyright © 2020–2025 A2Z Services. All Rights Reserved. Developed and managed by ZUCOL.