BIS Report: Regional Analysis of Barriers Restricting Business Support
VerifiedAdded on 2023/01/11
|12
|2724
|35
Report
AI Summary
This report analyzes data from the Department for Business Innovation and Skills (BIS) to identify barriers hindering small businesses from utilizing available support. The analysis focuses on comparing the North West and South East regions, examining variables such as the use of public sector information, strategic advice, and the impact of information obtained. The report utilizes data analysis techniques, including Microsoft Excel's FILTER function, to assess the responses of small business owners on questions related to the effectiveness of received information and the factors influencing their decision to seek support. Key findings highlight the challenges faced by businesses in accessing support, the varying levels of satisfaction with obtained information, and the gender distribution of business ownership. The report concludes with recommendations for addressing the identified barriers and improving the effectiveness of business support programs.

BIS report
Paraphrase This Document
Need a fresh take? Get an instant paraphrase of this document with our AI Paraphraser
Table of Contents
Table of Contents.............................................................................................................................2
INTRODUCTION...........................................................................................................................1
MAIN BODY..................................................................................................................................1
1. Analysis of the information of BIS in order to identify the barrier’s pattern that restricts the
use of business support................................................................................................................1
2. Highlights of the interesting findings......................................................................................8
3. Recommendations for the major areas where further support is required...............................9
CONCLUSION..............................................................................................................................10
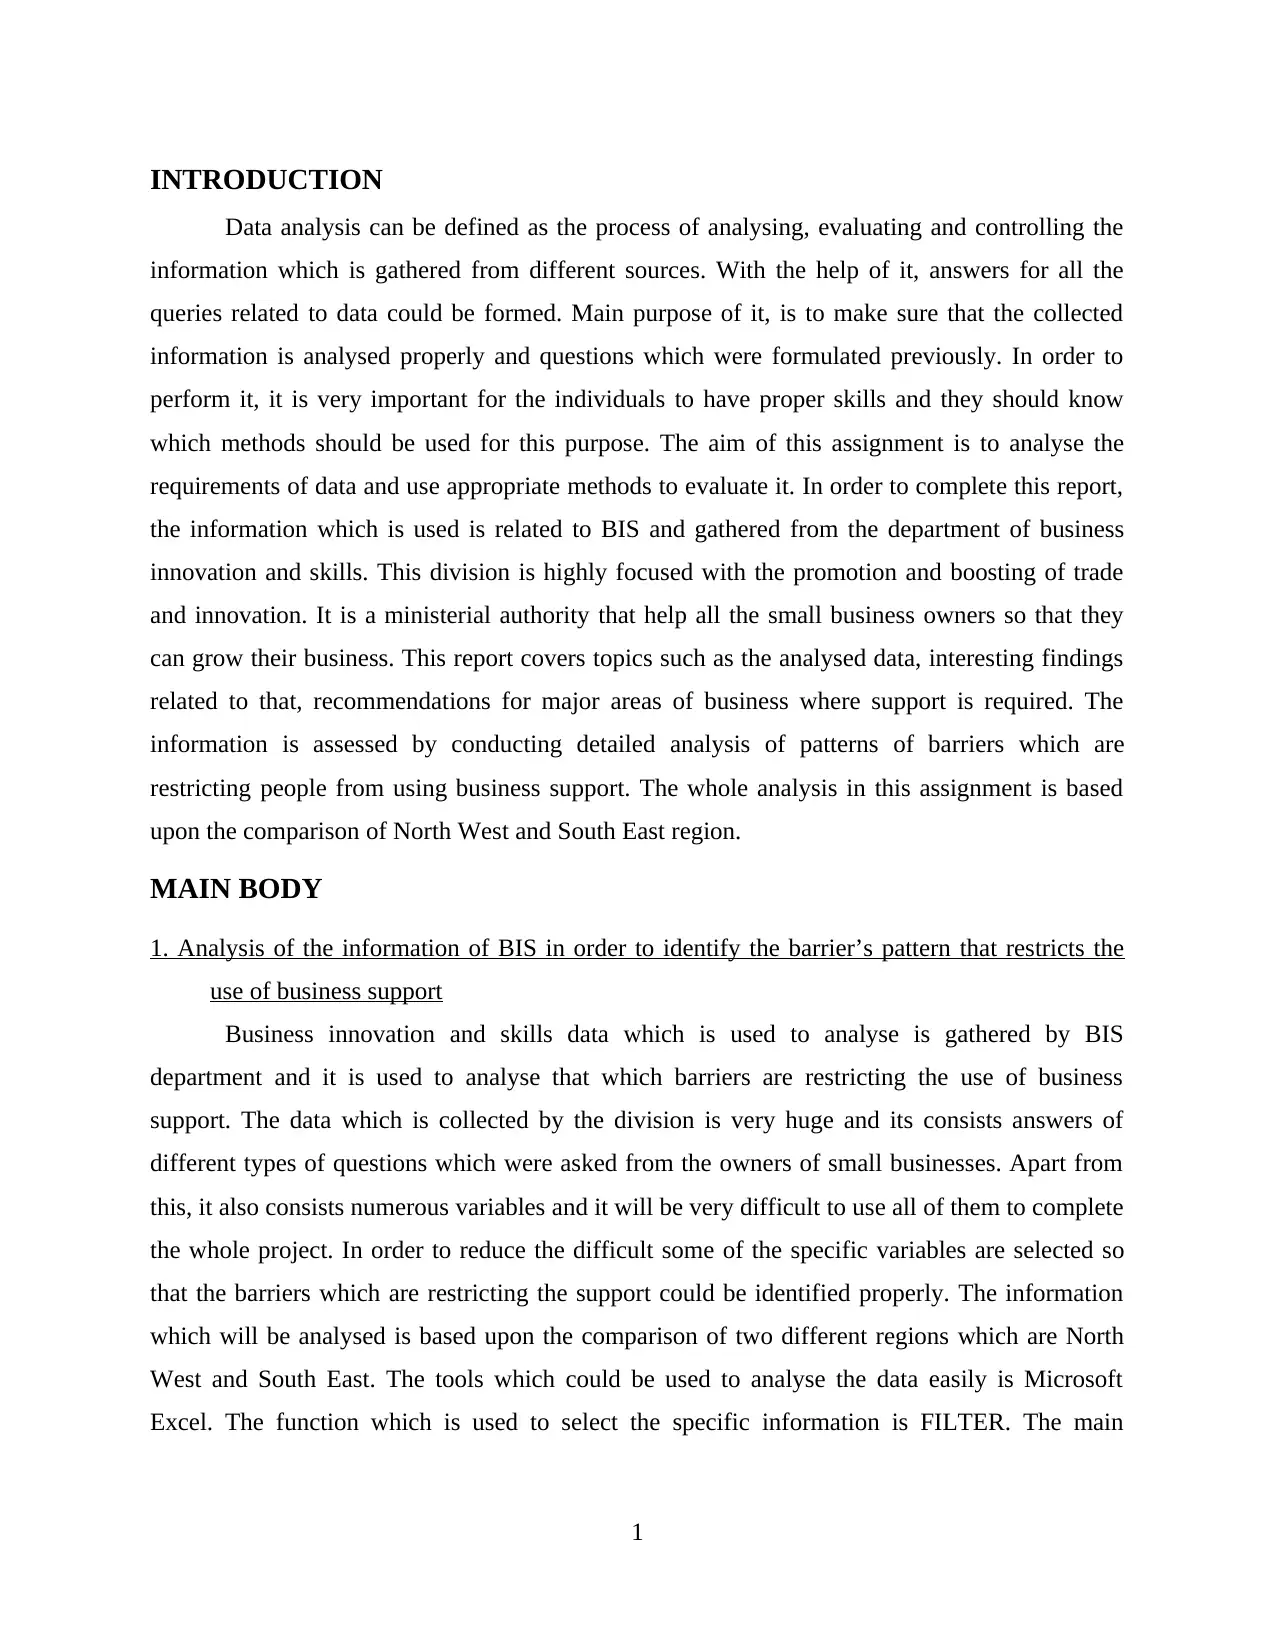
INTRODUCTION
Data analysis can be defined as the process of analysing, evaluating and controlling the
information which is gathered from different sources. With the help of it, answers for all the
queries related to data could be formed. Main purpose of it, is to make sure that the collected
information is analysed properly and questions which were formulated previously. In order to
perform it, it is very important for the individuals to have proper skills and they should know
which methods should be used for this purpose. The aim of this assignment is to analyse the
requirements of data and use appropriate methods to evaluate it. In order to complete this report,
the information which is used is related to BIS and gathered from the department of business
innovation and skills. This division is highly focused with the promotion and boosting of trade
and innovation. It is a ministerial authority that help all the small business owners so that they
can grow their business. This report covers topics such as the analysed data, interesting findings
related to that, recommendations for major areas of business where support is required. The
information is assessed by conducting detailed analysis of patterns of barriers which are
restricting people from using business support. The whole analysis in this assignment is based
upon the comparison of North West and South East region.
MAIN BODY
1. Analysis of the information of BIS in order to identify the barrier’s pattern that restricts the
use of business support
Business innovation and skills data which is used to analyse is gathered by BIS
department and it is used to analyse that which barriers are restricting the use of business
support. The data which is collected by the division is very huge and its consists answers of
different types of questions which were asked from the owners of small businesses. Apart from
this, it also consists numerous variables and it will be very difficult to use all of them to complete
the whole project. In order to reduce the difficult some of the specific variables are selected so
that the barriers which are restricting the support could be identified properly. The information
which will be analysed is based upon the comparison of two different regions which are North
West and South East. The tools which could be used to analyse the data easily is Microsoft
Excel. The function which is used to select the specific information is FILTER. The main
1
⊘ This is a preview!⊘
Do you want full access?
Subscribe today to unlock all pages.
Trusted by 1+ million students worldwide
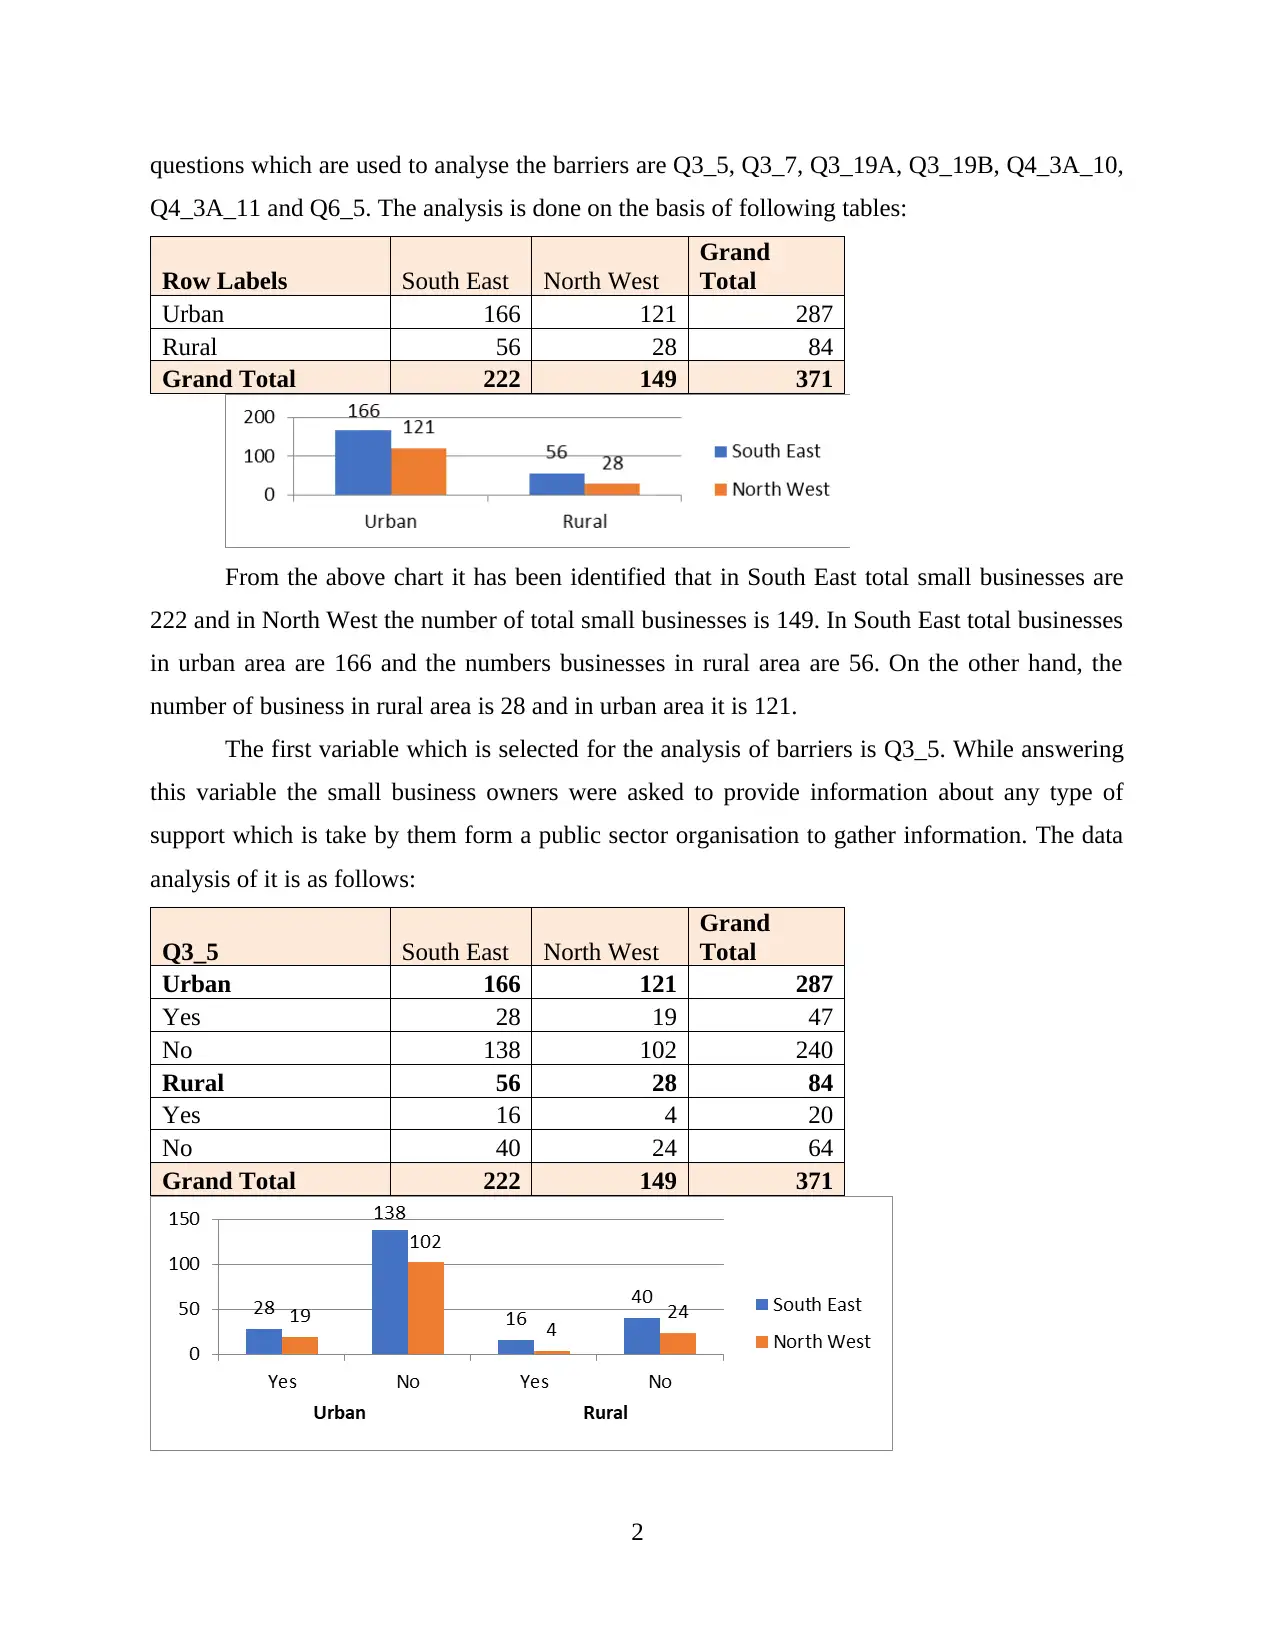
questions which are used to analyse the barriers are Q3_5, Q3_7, Q3_19A, Q3_19B, Q4_3A_10,
Q4_3A_11 and Q6_5. The analysis is done on the basis of following tables:
Row Labels South East North West
Grand
Total
Urban 166 121 287
Rural 56 28 84
Grand Total 222 149 371
From the above chart it has been identified that in South East total small businesses are
222 and in North West the number of total small businesses is 149. In South East total businesses
in urban area are 166 and the numbers businesses in rural area are 56. On the other hand, the
number of business in rural area is 28 and in urban area it is 121.
The first variable which is selected for the analysis of barriers is Q3_5. While answering
this variable the small business owners were asked to provide information about any type of
support which is take by them form a public sector organisation to gather information. The data
analysis of it is as follows:
Q3_5 South East North West
Grand
Total
Urban 166 121 287
Yes 28 19 47
No 138 102 240
Rural 56 28 84
Yes 16 4 20
No 40 24 64
Grand Total 222 149 371
2
Paraphrase This Document
Need a fresh take? Get an instant paraphrase of this document with our AI Paraphraser
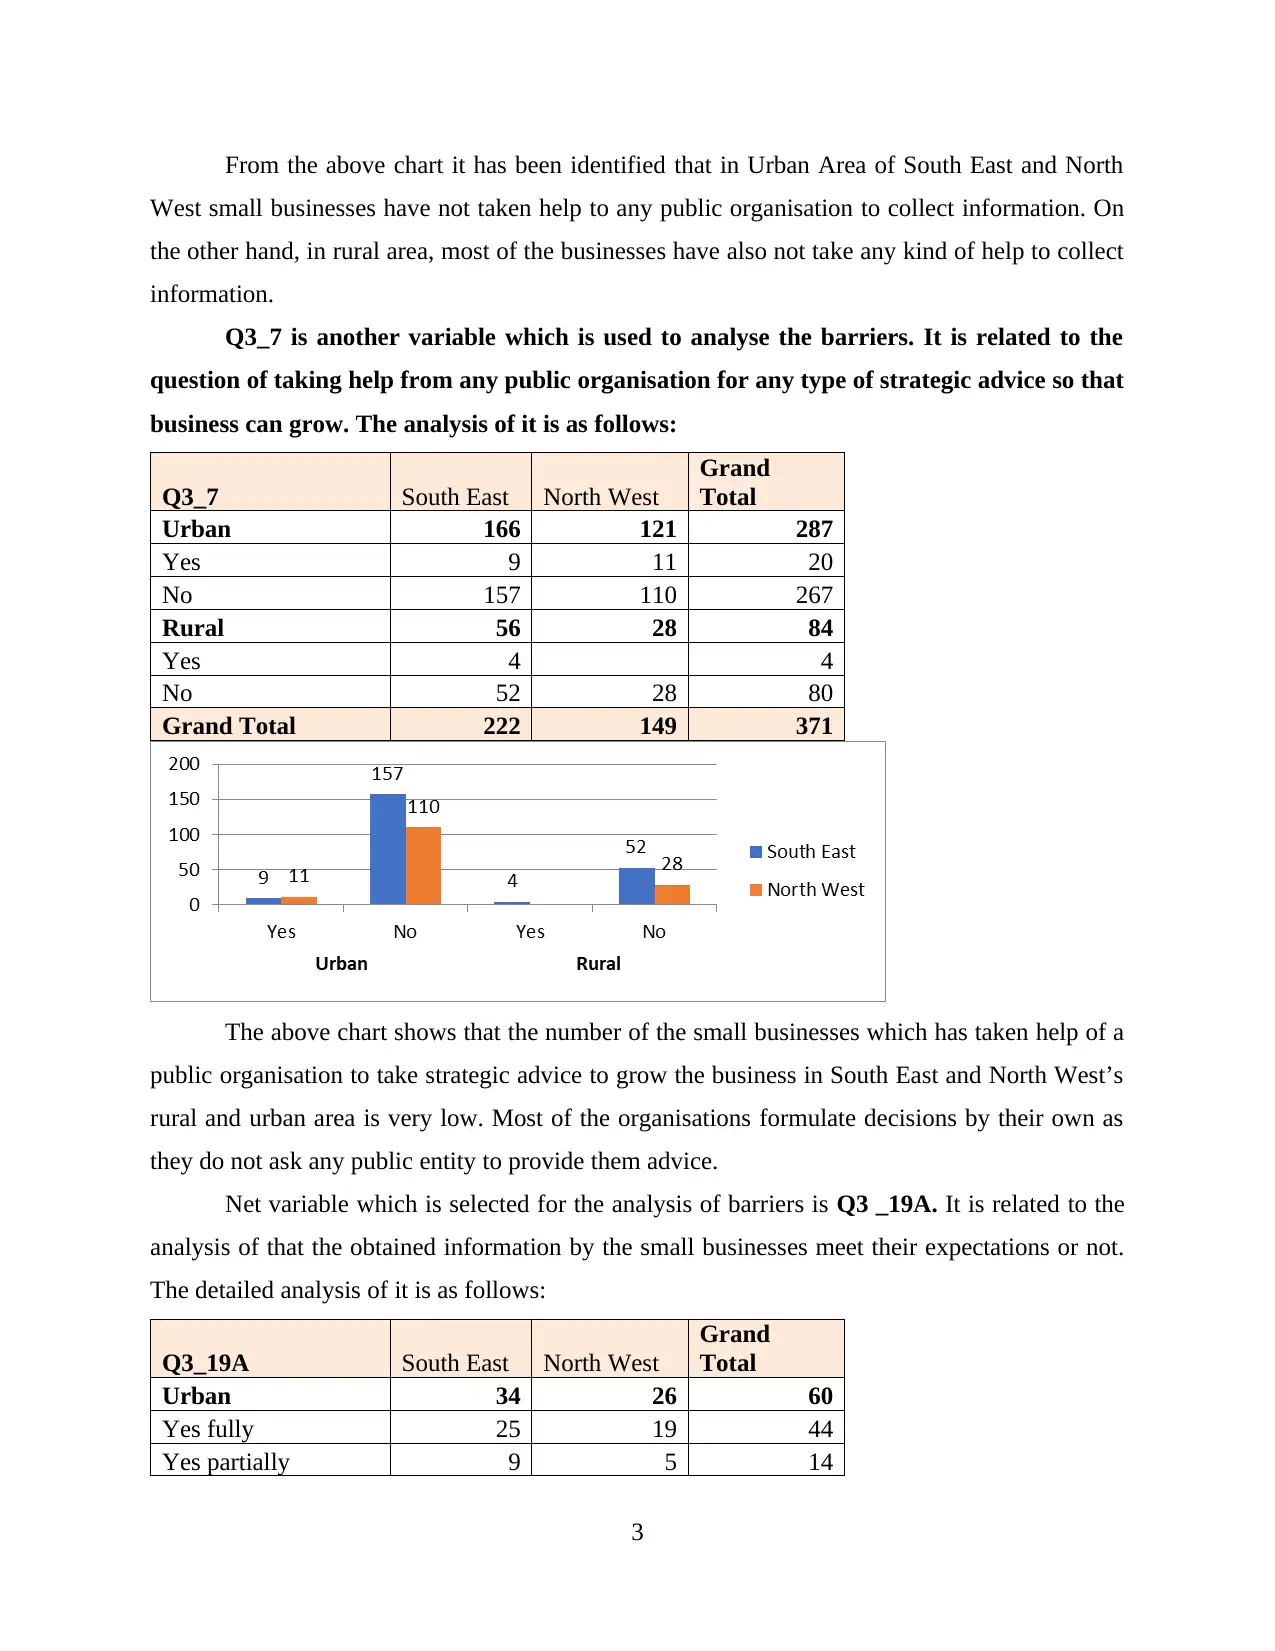
From the above chart it has been identified that in Urban Area of South East and North
West small businesses have not taken help to any public organisation to collect information. On
the other hand, in rural area, most of the businesses have also not take any kind of help to collect
information.
Q3_7 is another variable which is used to analyse the barriers. It is related to the
question of taking help from any public organisation for any type of strategic advice so that
business can grow. The analysis of it is as follows:
Q3_7 South East North West
Grand
Total
Urban 166 121 287
Yes 9 11 20
No 157 110 267
Rural 56 28 84
Yes 4 4
No 52 28 80
Grand Total 222 149 371
The above chart shows that the number of the small businesses which has taken help of a
public organisation to take strategic advice to grow the business in South East and North West’s
rural and urban area is very low. Most of the organisations formulate decisions by their own as
they do not ask any public entity to provide them advice.
Net variable which is selected for the analysis of barriers is Q3 _19A. It is related to the
analysis of that the obtained information by the small businesses meet their expectations or not.
The detailed analysis of it is as follows:
Q3_19A South East North West
Grand
Total
Urban 34 26 60
Yes fully 25 19 44
Yes partially 9 5 14
3
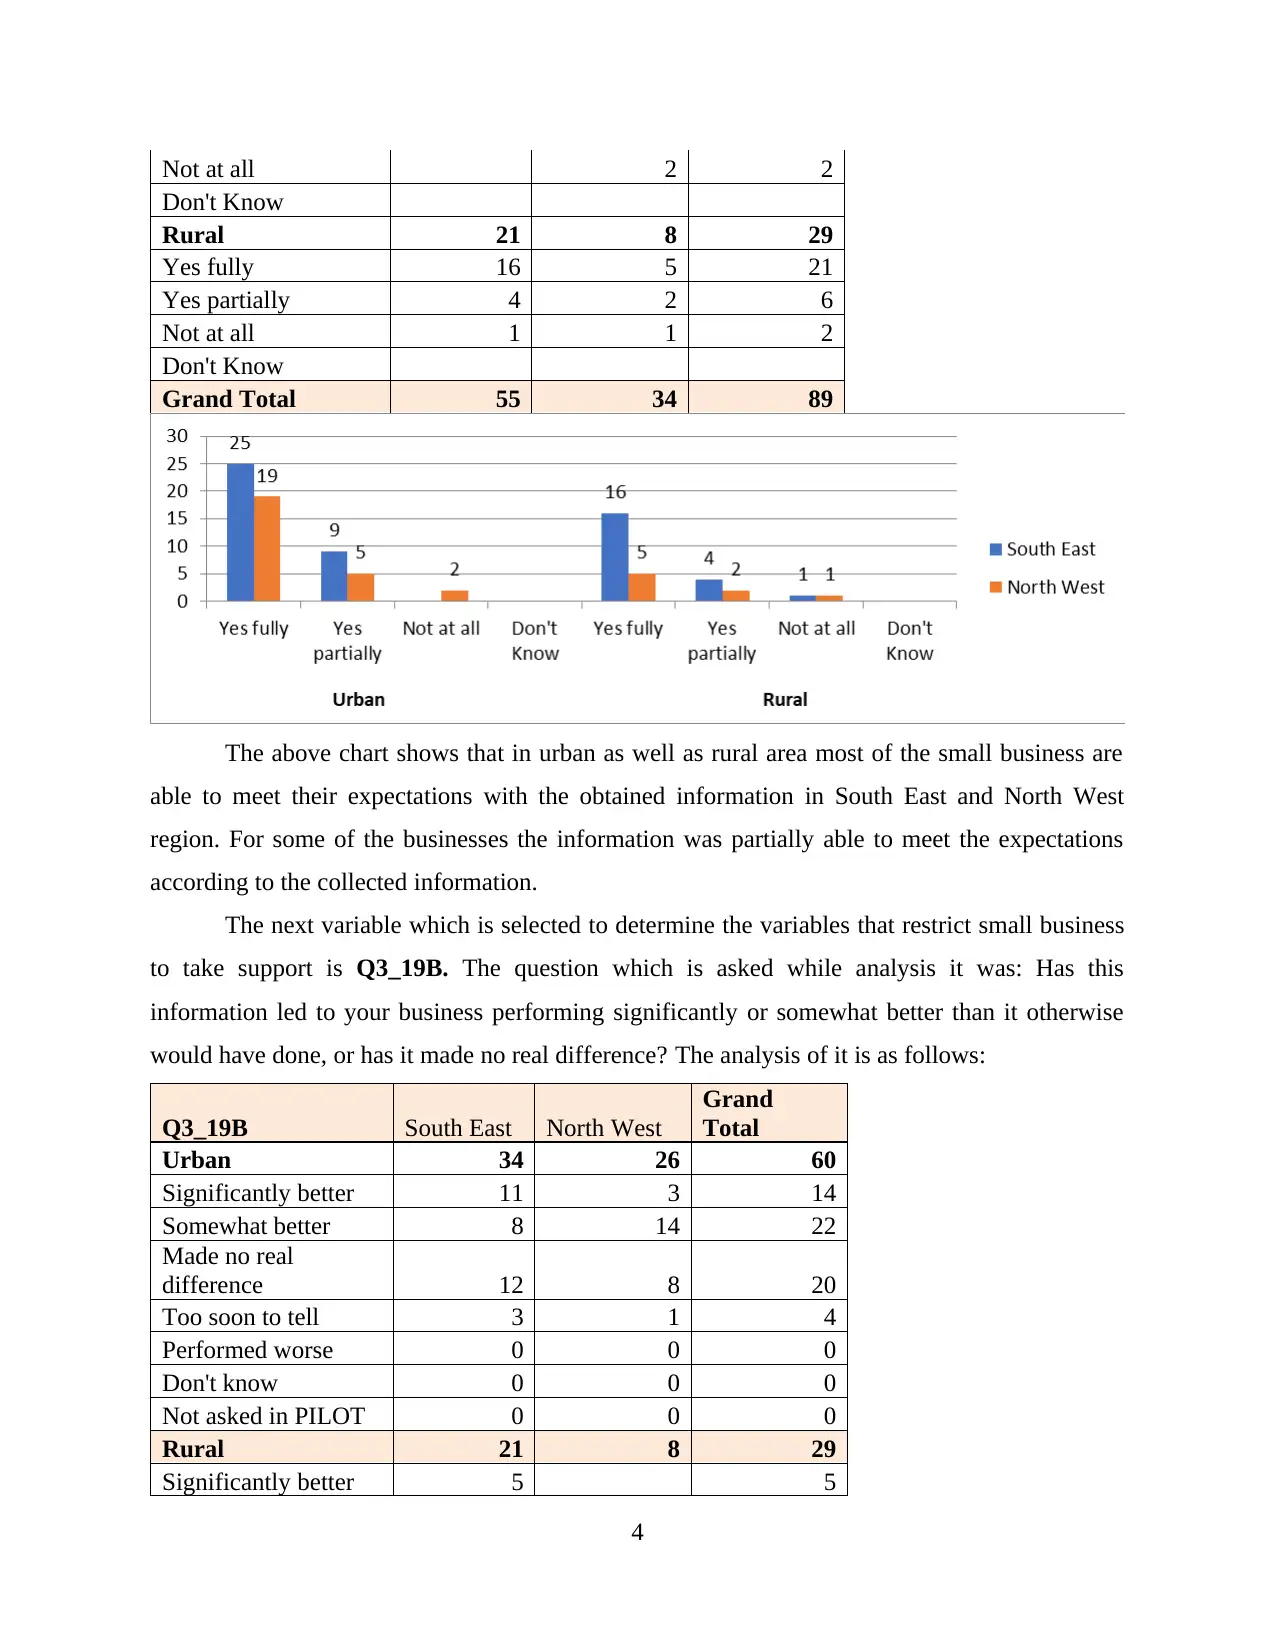
Not at all 2 2
Don't Know
Rural 21 8 29
Yes fully 16 5 21
Yes partially 4 2 6
Not at all 1 1 2
Don't Know
Grand Total 55 34 89
The above chart shows that in urban as well as rural area most of the small business are
able to meet their expectations with the obtained information in South East and North West
region. For some of the businesses the information was partially able to meet the expectations
according to the collected information.
The next variable which is selected to determine the variables that restrict small business
to take support is Q3_19B. The question which is asked while analysis it was: Has this
information led to your business performing significantly or somewhat better than it otherwise
would have done, or has it made no real difference? The analysis of it is as follows:
Q3_19B South East North West
Grand
Total
Urban 34 26 60
Significantly better 11 3 14
Somewhat better 8 14 22
Made no real
difference 12 8 20
Too soon to tell 3 1 4
Performed worse 0 0 0
Don't know 0 0 0
Not asked in PILOT 0 0 0
Rural 21 8 29
Significantly better 5 5
4
Don't Know
Rural 21 8 29
Yes fully 16 5 21
Yes partially 4 2 6
Not at all 1 1 2
Don't Know
Grand Total 55 34 89
The above chart shows that in urban as well as rural area most of the small business are
able to meet their expectations with the obtained information in South East and North West
region. For some of the businesses the information was partially able to meet the expectations
according to the collected information.
The next variable which is selected to determine the variables that restrict small business
to take support is Q3_19B. The question which is asked while analysis it was: Has this
information led to your business performing significantly or somewhat better than it otherwise
would have done, or has it made no real difference? The analysis of it is as follows:
Q3_19B South East North West
Grand
Total
Urban 34 26 60
Significantly better 11 3 14
Somewhat better 8 14 22
Made no real
difference 12 8 20
Too soon to tell 3 1 4
Performed worse 0 0 0
Don't know 0 0 0
Not asked in PILOT 0 0 0
Rural 21 8 29
Significantly better 5 5
4
⊘ This is a preview!⊘
Do you want full access?
Subscribe today to unlock all pages.
Trusted by 1+ million students worldwide
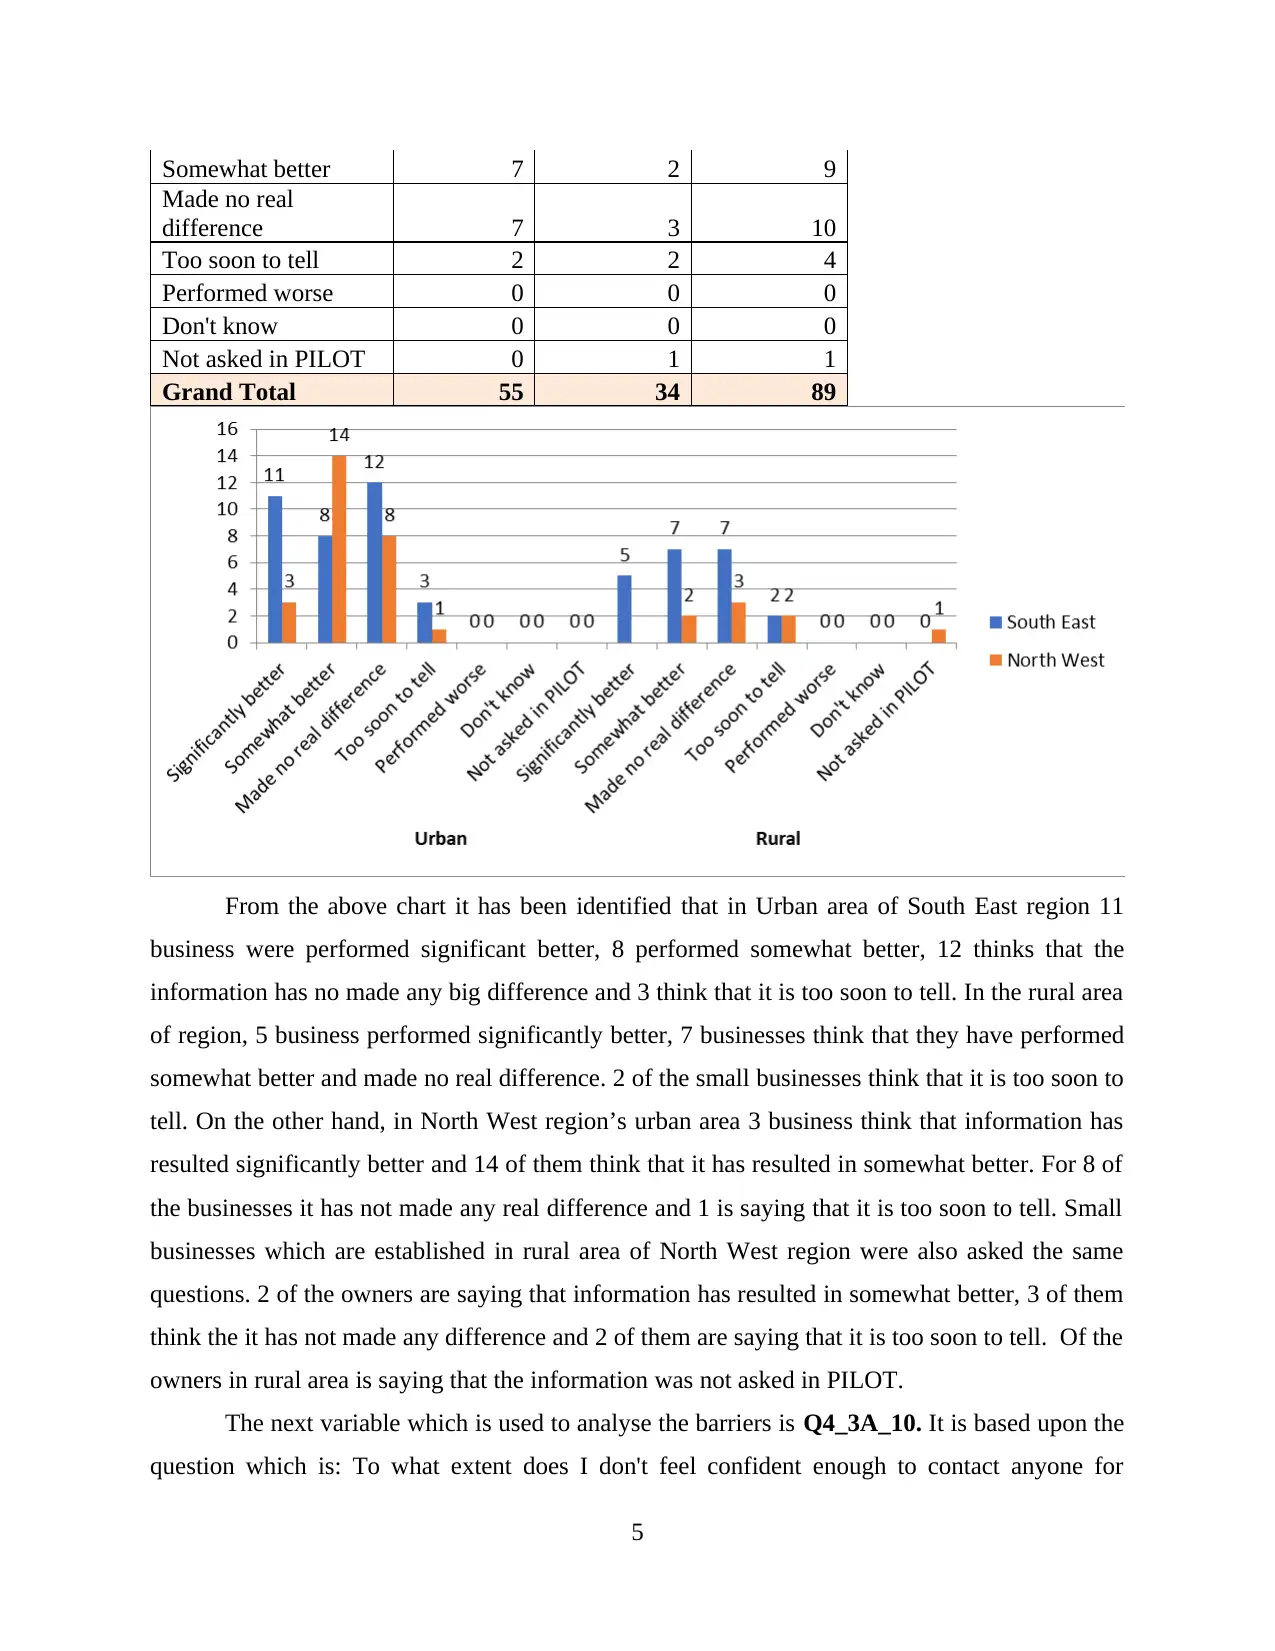
Somewhat better 7 2 9
Made no real
difference 7 3 10
Too soon to tell 2 2 4
Performed worse 0 0 0
Don't know 0 0 0
Not asked in PILOT 0 1 1
Grand Total 55 34 89
From the above chart it has been identified that in Urban area of South East region 11
business were performed significant better, 8 performed somewhat better, 12 thinks that the
information has no made any big difference and 3 think that it is too soon to tell. In the rural area
of region, 5 business performed significantly better, 7 businesses think that they have performed
somewhat better and made no real difference. 2 of the small businesses think that it is too soon to
tell. On the other hand, in North West region’s urban area 3 business think that information has
resulted significantly better and 14 of them think that it has resulted in somewhat better. For 8 of
the businesses it has not made any real difference and 1 is saying that it is too soon to tell. Small
businesses which are established in rural area of North West region were also asked the same
questions. 2 of the owners are saying that information has resulted in somewhat better, 3 of them
think the it has not made any difference and 2 of them are saying that it is too soon to tell. Of the
owners in rural area is saying that the information was not asked in PILOT.
The next variable which is used to analyse the barriers is Q4_3A_10. It is based upon the
question which is: To what extent does I don't feel confident enough to contact anyone for
5
Paraphrase This Document
Need a fresh take? Get an instant paraphrase of this document with our AI Paraphraser
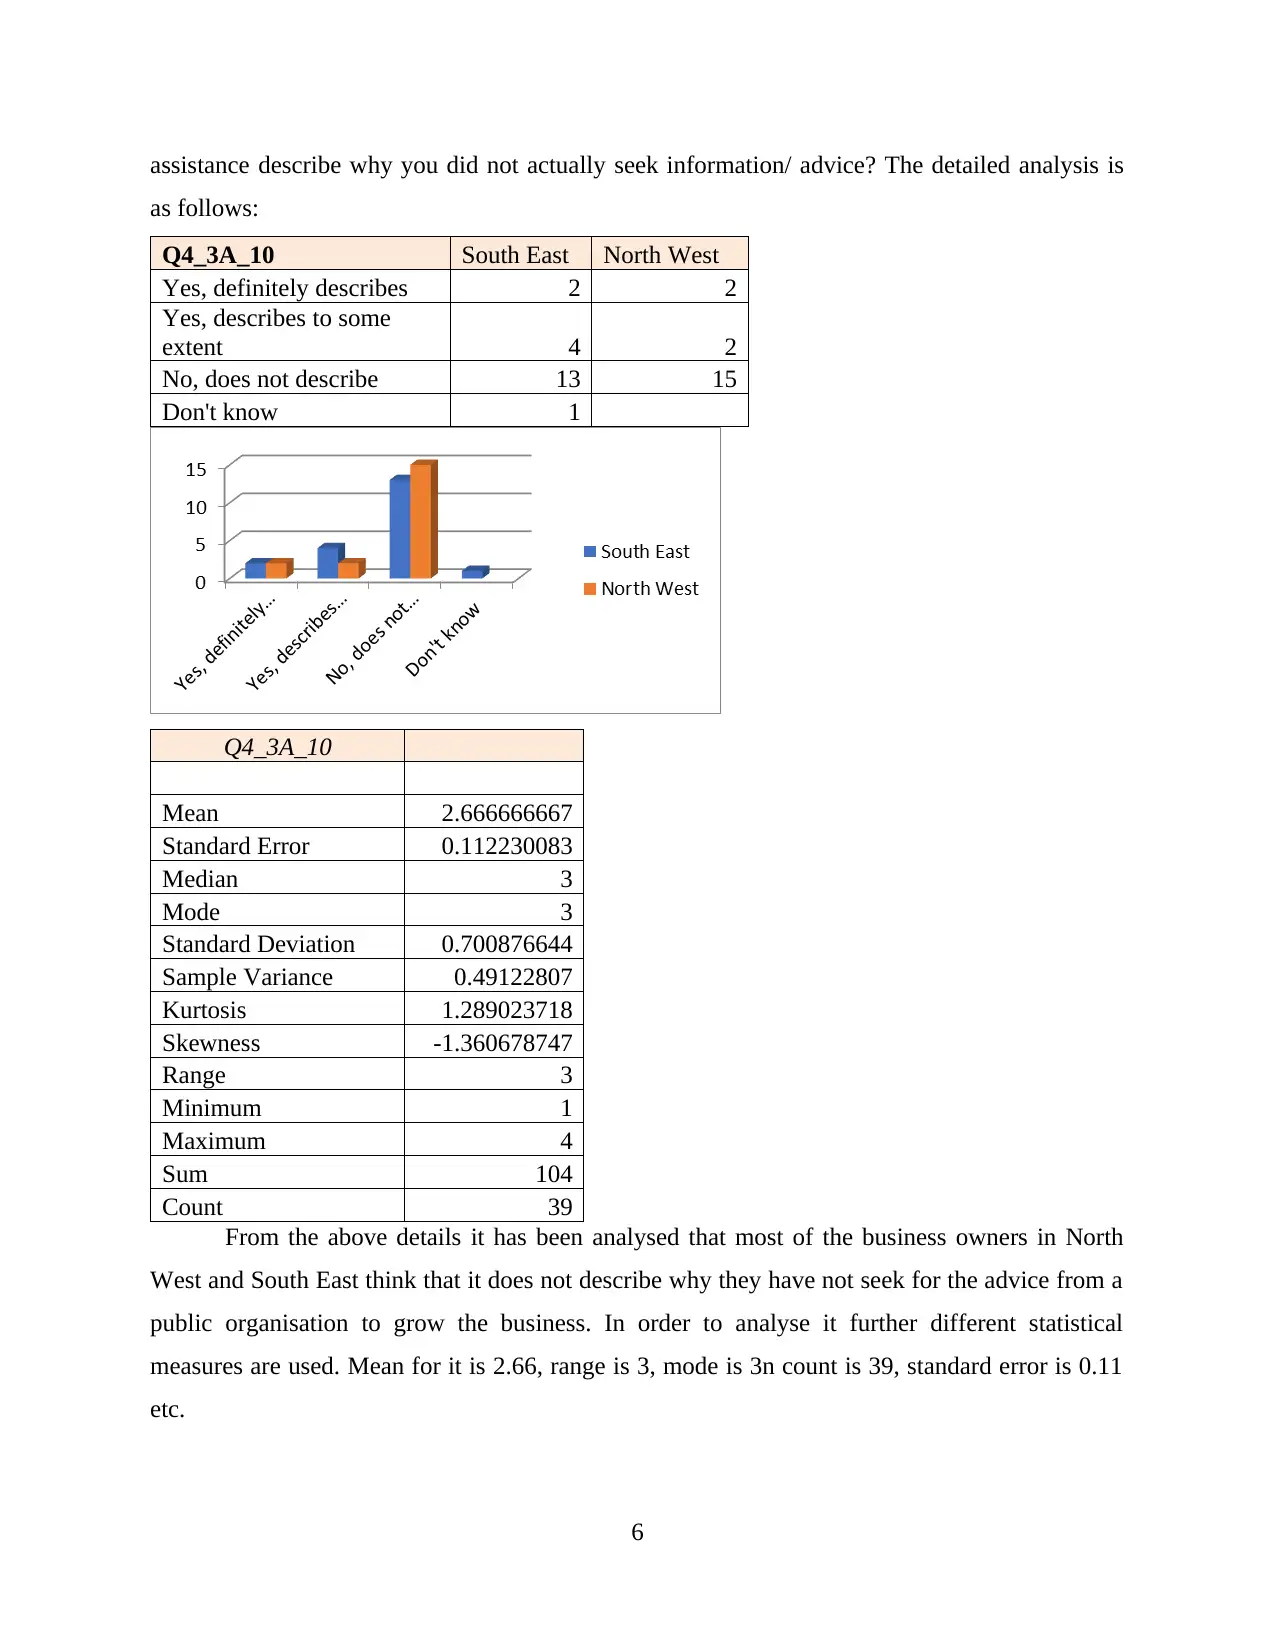
assistance describe why you did not actually seek information/ advice? The detailed analysis is
as follows:
Q4_3A_10 South East North West
Yes, definitely describes 2 2
Yes, describes to some
extent 4 2
No, does not describe 13 15
Don't know 1
Q4_3A_10
Mean 2.666666667
Standard Error 0.112230083
Median 3
Mode 3
Standard Deviation 0.700876644
Sample Variance 0.49122807
Kurtosis 1.289023718
Skewness -1.360678747
Range 3
Minimum 1
Maximum 4
Sum 104
Count 39
From the above details it has been analysed that most of the business owners in North
West and South East think that it does not describe why they have not seek for the advice from a
public organisation to grow the business. In order to analyse it further different statistical
measures are used. Mean for it is 2.66, range is 3, mode is 3n count is 39, standard error is 0.11
etc.
6
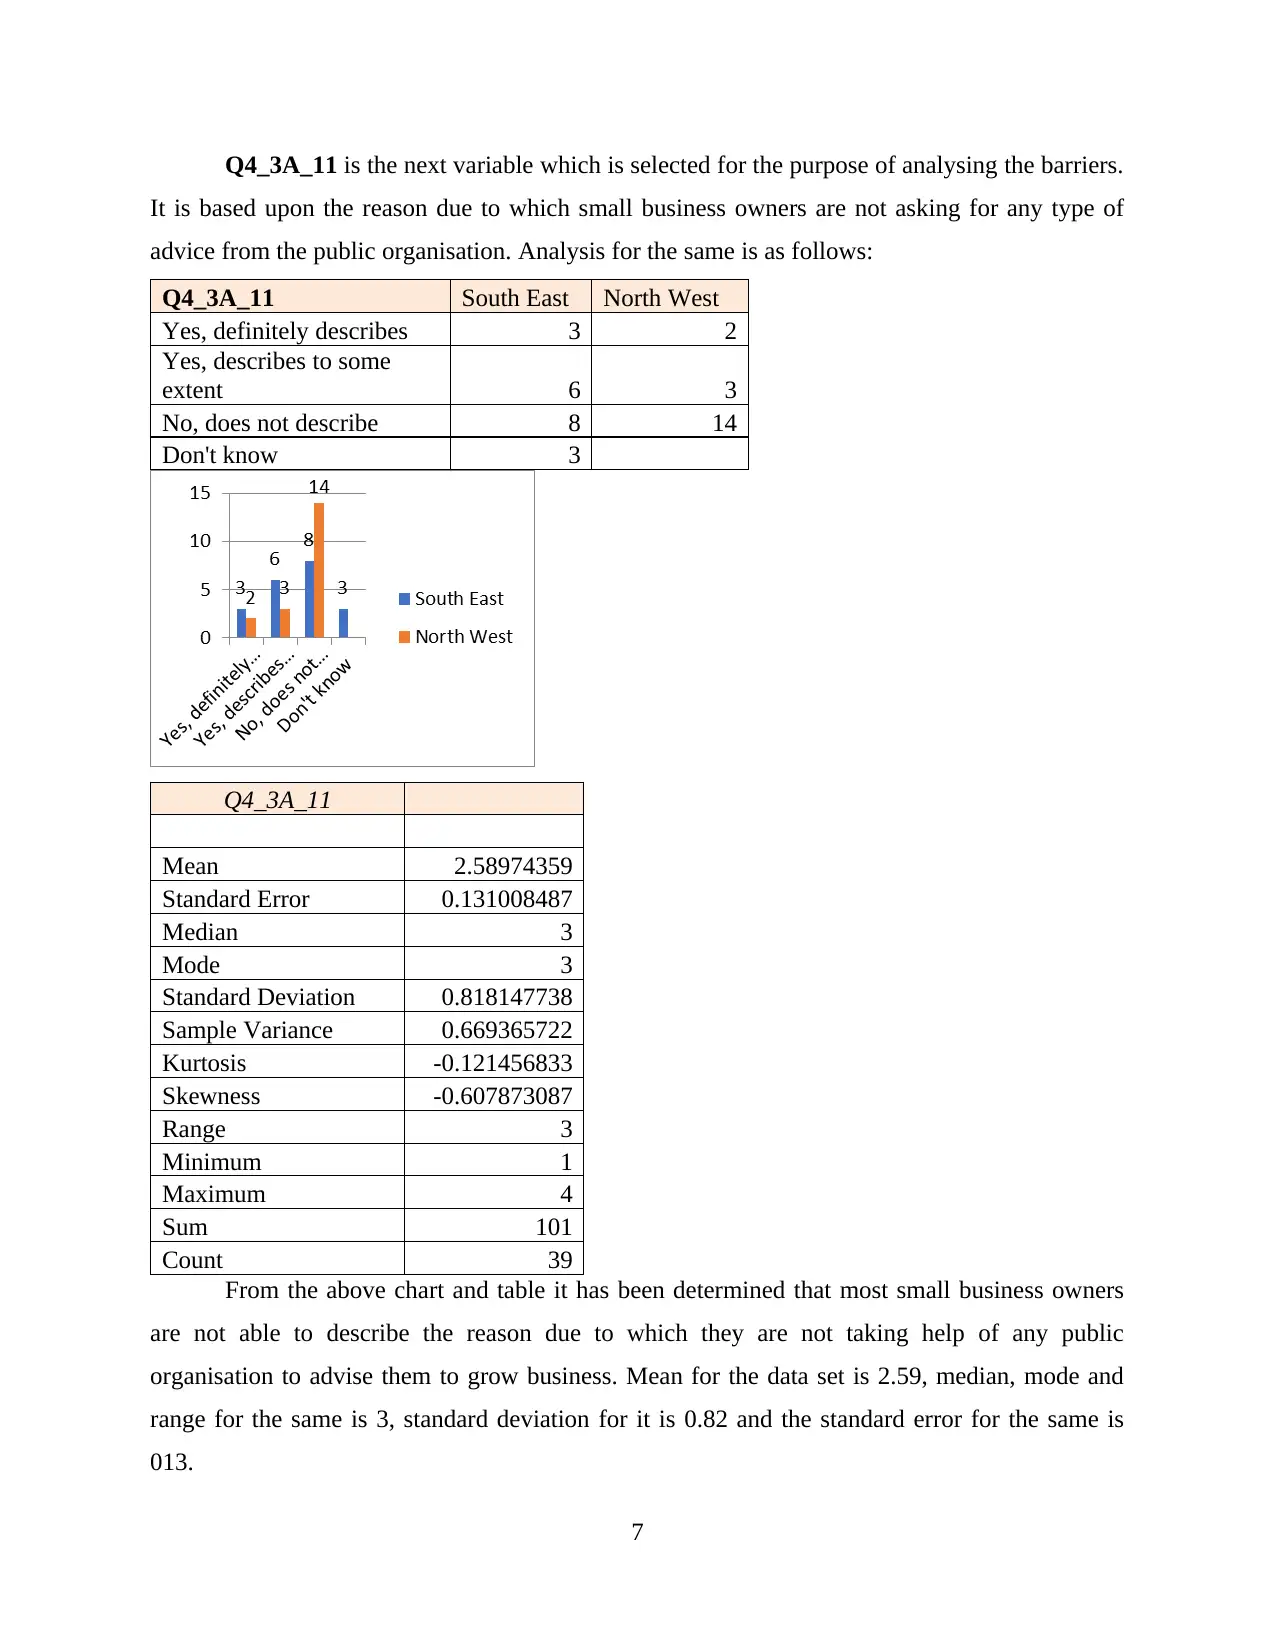
Q4_3A_11 is the next variable which is selected for the purpose of analysing the barriers.
It is based upon the reason due to which small business owners are not asking for any type of
advice from the public organisation. Analysis for the same is as follows:
Q4_3A_11 South East North West
Yes, definitely describes 3 2
Yes, describes to some
extent 6 3
No, does not describe 8 14
Don't know 3
Q4_3A_11
Mean 2.58974359
Standard Error 0.131008487
Median 3
Mode 3
Standard Deviation 0.818147738
Sample Variance 0.669365722
Kurtosis -0.121456833
Skewness -0.607873087
Range 3
Minimum 1
Maximum 4
Sum 101
Count 39
From the above chart and table it has been determined that most small business owners
are not able to describe the reason due to which they are not taking help of any public
organisation to advise them to grow business. Mean for the data set is 2.59, median, mode and
range for the same is 3, standard deviation for it is 0.82 and the standard error for the same is
013.
7
⊘ This is a preview!⊘
Do you want full access?
Subscribe today to unlock all pages.
Trusted by 1+ million students worldwide
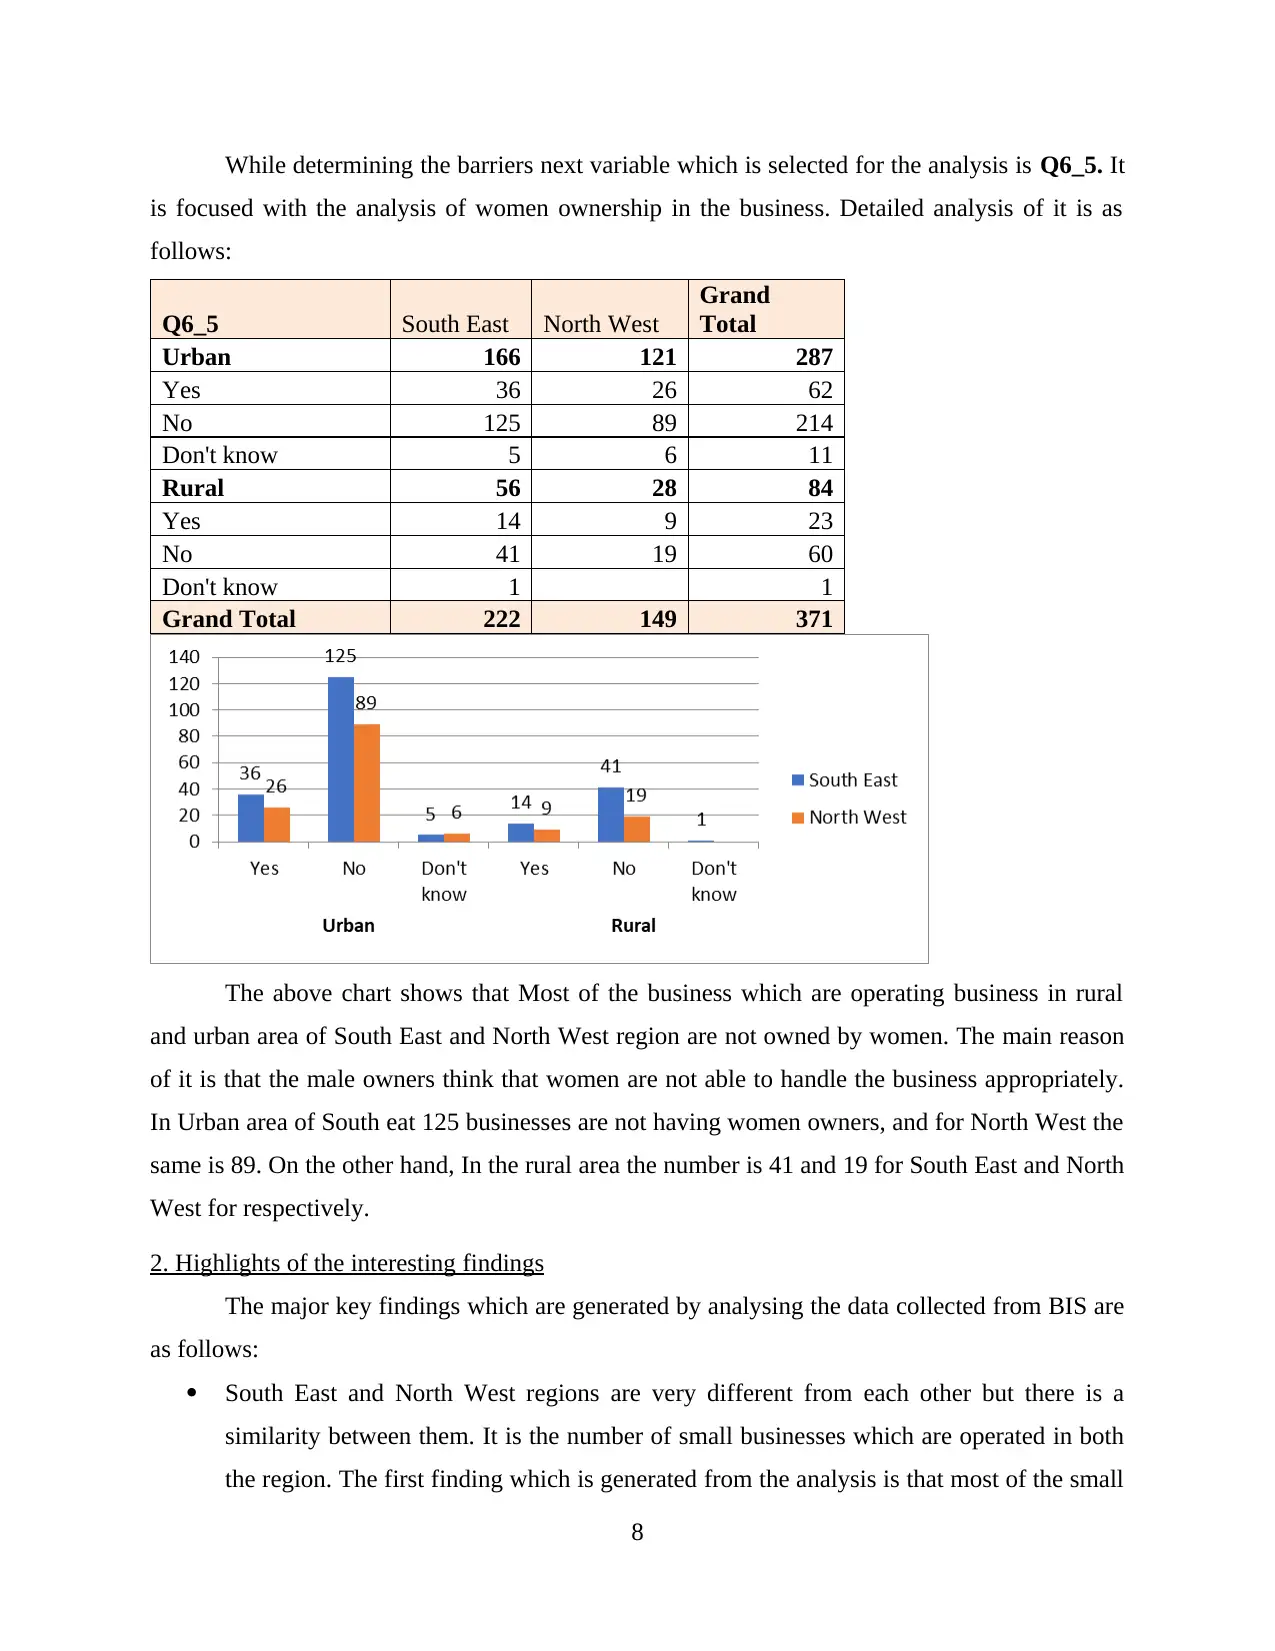
While determining the barriers next variable which is selected for the analysis is Q6_5. It
is focused with the analysis of women ownership in the business. Detailed analysis of it is as
follows:
Q6_5 South East North West
Grand
Total
Urban 166 121 287
Yes 36 26 62
No 125 89 214
Don't know 5 6 11
Rural 56 28 84
Yes 14 9 23
No 41 19 60
Don't know 1 1
Grand Total 222 149 371
The above chart shows that Most of the business which are operating business in rural
and urban area of South East and North West region are not owned by women. The main reason
of it is that the male owners think that women are not able to handle the business appropriately.
In Urban area of South eat 125 businesses are not having women owners, and for North West the
same is 89. On the other hand, In the rural area the number is 41 and 19 for South East and North
West for respectively.
2. Highlights of the interesting findings
The major key findings which are generated by analysing the data collected from BIS are
as follows:
South East and North West regions are very different from each other but there is a
similarity between them. It is the number of small businesses which are operated in both
the region. The first finding which is generated from the analysis is that most of the small
8
Paraphrase This Document
Need a fresh take? Get an instant paraphrase of this document with our AI Paraphraser
business which are operated in rural and urban area of the regions are not taking any type
of help from public organisations to carry out business.
Another finding which is generated form the data analysed is that most of the small
business owners in South East and North West region are not asking for any type of
advice from public organisations for advice.
Most of the small business owners in rural and urban area of both of the regions are
highly satisfied with the information which is obtained by them. They think that the
information is able to meet their expectations.
The information which is obtained by the small business in both the regions have
somewhat benefitted them by improving the business performance. Some of the
businesses think that it has not made any big difference and some of them also think that
it is too soon to pass any judgement for the same.
Most of the small business owners of rural and urban areas of South East and North West
are not able to describe the reason for which they are not able to take advice from the
public organisations for growing the business.
The last finding from the analysis is that most of the businesses are not owned by women
owners in both the region’s urban and rural areas. Main cause of it is, that the male
owners think that females are not able to handle the business properly and it has led the
male ownership.
3. Recommendations for the major areas where further support is required
Some of the key findings which are generated from the analysis have reflected that there
are various barriers which are restricting the businesses from taking support of public
organisation. Following are some of the major areas where further support is required and all of
them should be focused by all the small business owners:
Small businesses should take support of public organisations so that they can perform the
business in systematic manner. It can help them to carry out operational activities in
systematic manner.
It has been recommended to the small businesses of South East and North West regions
to make sure that they take advise from public organisation as it can help them to
formulate effective strategies for business execution.
9
The businesses in rural and urban areas of South East and North West Regions are
recommended to enhance the usefulness of the information which is obtained by them
from different sources as it will help them to carry out operations strategically.
The last recommendation which is provided to the businesses in both the region is that
the owners should enhance the ownership of women owners as they can take support of
public organisations so that all the goals could be accomplished successfully.
CONCLUSION
From the above project report, it can be concluded that data analysis if the process of
filtering the collected in formation so that appropriate conclusion could be drawn. It is very
important for all the business entities to collected information and analyse it with the help of data
analysis so that effective decisions for future could be formulated. In order to complete the whole
report BIS data is used and interesting findings were assessed by analysing the gathered
information. When the raw data is analysed and observed properly then it can guide to develop
proper details and help to form effective strategies for future.
10
⊘ This is a preview!⊘
Do you want full access?
Subscribe today to unlock all pages.
Trusted by 1+ million students worldwide
1 out of 12
Related Documents


Your All-in-One AI-Powered Toolkit for Academic Success.
+13062052269
info@desklib.com
Available 24*7 on WhatsApp / Email
![[object Object]](/_next/static/media/star-bottom.7253800d.svg)
Unlock your academic potential
Copyright © 2020–2026 A2Z Services. All Rights Reserved. Developed and managed by ZUCOL.