Analysis of Bitcoin Weekly Returns and Price Fluctuations Project
VerifiedAdded on 2021/02/20
|35
|4409
|130
Project
AI Summary
This project provides an in-depth analysis of Bitcoin's weekly closing prices and returns from 2013 to 2019. The analysis includes the construction of line graphs and histograms to visualize price trends and weekly returns. Descriptive statistics, including mean, median, mode, standard deviation, and confidence intervals, are calculated and interpreted for both Bitcoin and Macquarie Group Limited (MAC) returns. The project explores the location, shape, and spread of the data, along with the construction of 95% confidence intervals. A contingency table is used to analyze the relationship between positive returns for Bitcoin and MAC. The project concludes with a summary of the findings and references relevant sources.

Project about Bitcoin
Paraphrase This Document
Need a fresh take? Get an instant paraphrase of this document with our AI Paraphraser

EXECUTIVE SUMMARY
From the present report assessement has been done about Bitcoin which is one of the famous and
well known cryptocurrency. This report has defined about different calculations which has been
done for determining the weekly closing prices of Bitcoin along with the help of line graph and
histograph. Also, with the help of descriptive statistics analysis has been done about Bitcoin
weekly return in respect of three aspects viz. Location, Shape and Spread.
TABLE OF CONTENTS
EXECUTIVE SUMMARY.........................................................................................................................2
INTRODUCTION.......................................................................................................................................4
ANALYSIS – PART A................................................................................................................................4
1. Line graph presenting the weekly closing price of Bitcoin................................................................4
2. Calculating weekly return for BIT and constructing histogram.........................................................5
3. Calculating & interpreting three aspects of Descriptive Analysis for weekly return: Location, Shape
and Spread.................................................................................................................................................5
4. Constructing 95% confidence interval for BIT return.......................................................................6
5. Reasoning..........................................................................................................................................7
6. Macquarie Group Limited.................................................................................................................7
1. Line graph.....................................................................................................................................8
2. Calculating weekly return for MAC..................................................................................................8
3. Calculating & interpreting Descriptive Analysis for weekly return...................................................9
4. Constructing 95% confidence interval for MAC return.................................................................9
5. Reasoning....................................................................................................................................10
7. Contingency table............................................................................................................................10
CONCLUSION..........................................................................................................................................11
REFERENCES..........................................................................................................................................12
APPENDIX.................................................................................................................................................13
⊘ This is a preview!⊘
Do you want full access?
Subscribe today to unlock all pages.
Trusted by 1+ million students worldwide
INTRODUCTION
Bitcoin in todays world is known as one of the best as well as popular cryptocurrency which has
become part of most the companies and businesses. For its effective and better use, many
invention has been done in relation to technological advancement. Blockchain technology has
been invented for assisting the functioning of such cryptocurrency which is a form of
decentralized legder depicting about all the transactions through peer to peer network. The
present report is about evaluating the recent prices of Bitcoin. Also, it will form basis on such
pricing evidence of weekly returns that whether individuals should adopt for making investment
in such cryptocurrency i.e. Bitcoin.
ANALYSIS – PART A
1. Line graph presenting the weekly closing price of Bitcoin.
3/11/2013
6/24/2013
10/7/2013
1/20/2014
5/5/2014
8/18/2014
12/1/2014
3/16/2015
6/29/2015
10/12/2015
1/25/2016
5/9/2016
8/22/2016
12/5/2016
3/20/2017
7/3/2017
10/16/2017
1/29/2018
5/14/2018
8/27/2018
12/10/2018
3/25/2019
7/8/2019
0
5000
10000
15000
20000
25000
30000
BIT
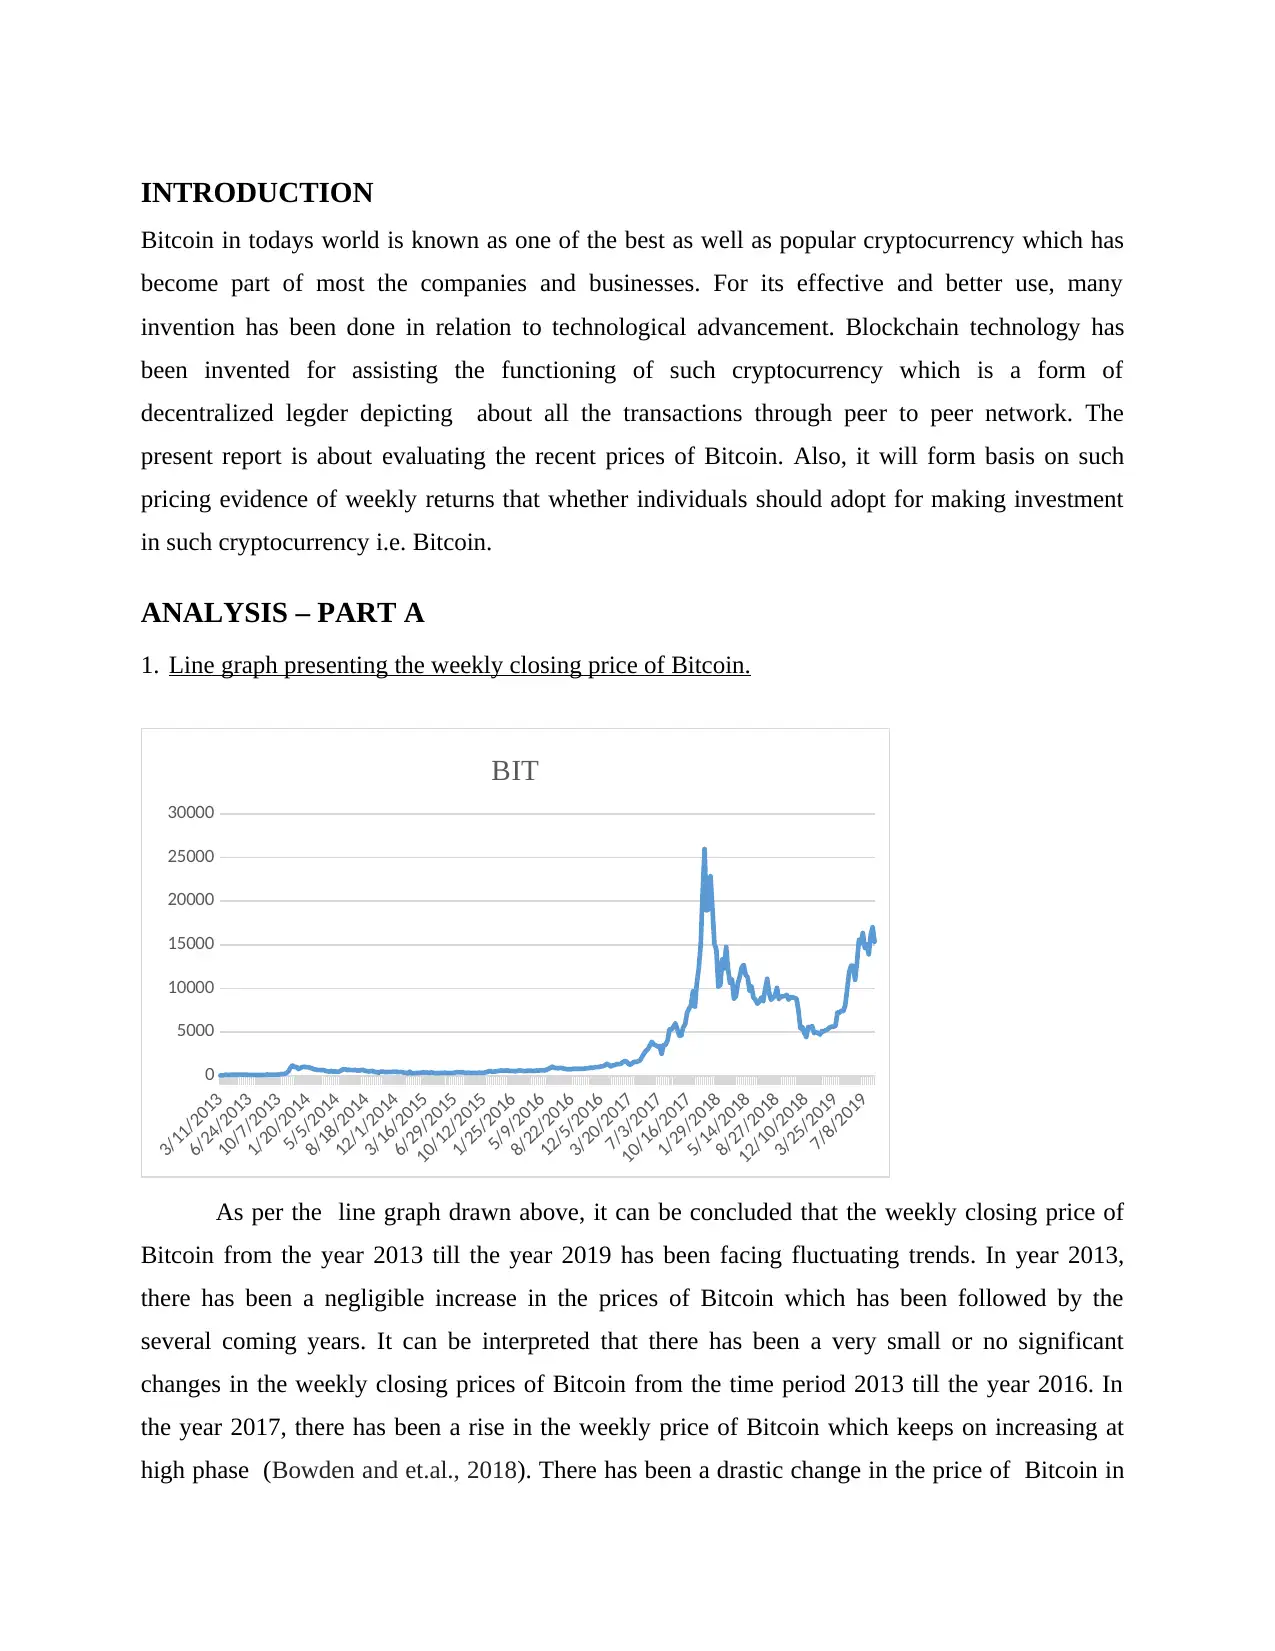
As per the line graph drawn above, it can be concluded that the weekly closing price of
Bitcoin from the year 2013 till the year 2019 has been facing fluctuating trends. In year 2013,
there has been a negligible increase in the prices of Bitcoin which has been followed by the
several coming years. It can be interpreted that there has been a very small or no significant
changes in the weekly closing prices of Bitcoin from the time period 2013 till the year 2016. In
the year 2017, there has been a rise in the weekly price of Bitcoin which keeps on increasing at
high phase (Bowden and et.al., 2018). There has been a drastic change in the price of Bitcoin in
Bitcoin in todays world is known as one of the best as well as popular cryptocurrency which has
become part of most the companies and businesses. For its effective and better use, many
invention has been done in relation to technological advancement. Blockchain technology has
been invented for assisting the functioning of such cryptocurrency which is a form of
decentralized legder depicting about all the transactions through peer to peer network. The
present report is about evaluating the recent prices of Bitcoin. Also, it will form basis on such
pricing evidence of weekly returns that whether individuals should adopt for making investment
in such cryptocurrency i.e. Bitcoin.
ANALYSIS – PART A
1. Line graph presenting the weekly closing price of Bitcoin.
3/11/2013
6/24/2013
10/7/2013
1/20/2014
5/5/2014
8/18/2014
12/1/2014
3/16/2015
6/29/2015
10/12/2015
1/25/2016
5/9/2016
8/22/2016
12/5/2016
3/20/2017
7/3/2017
10/16/2017
1/29/2018
5/14/2018
8/27/2018
12/10/2018
3/25/2019
7/8/2019
0
5000
10000
15000
20000
25000
30000
BIT
As per the line graph drawn above, it can be concluded that the weekly closing price of
Bitcoin from the year 2013 till the year 2019 has been facing fluctuating trends. In year 2013,
there has been a negligible increase in the prices of Bitcoin which has been followed by the
several coming years. It can be interpreted that there has been a very small or no significant
changes in the weekly closing prices of Bitcoin from the time period 2013 till the year 2016. In
the year 2017, there has been a rise in the weekly price of Bitcoin which keeps on increasing at
high phase (Bowden and et.al., 2018). There has been a drastic change in the price of Bitcoin in
Paraphrase This Document
Need a fresh take? Get an instant paraphrase of this document with our AI Paraphraser
2018 as compared to the previous year closing prices when calculated on weekly basis. In 2019, it
can be noticed that a declining trend has come in the price of Bitcoin which again rises with
increasing rate in the coming year.
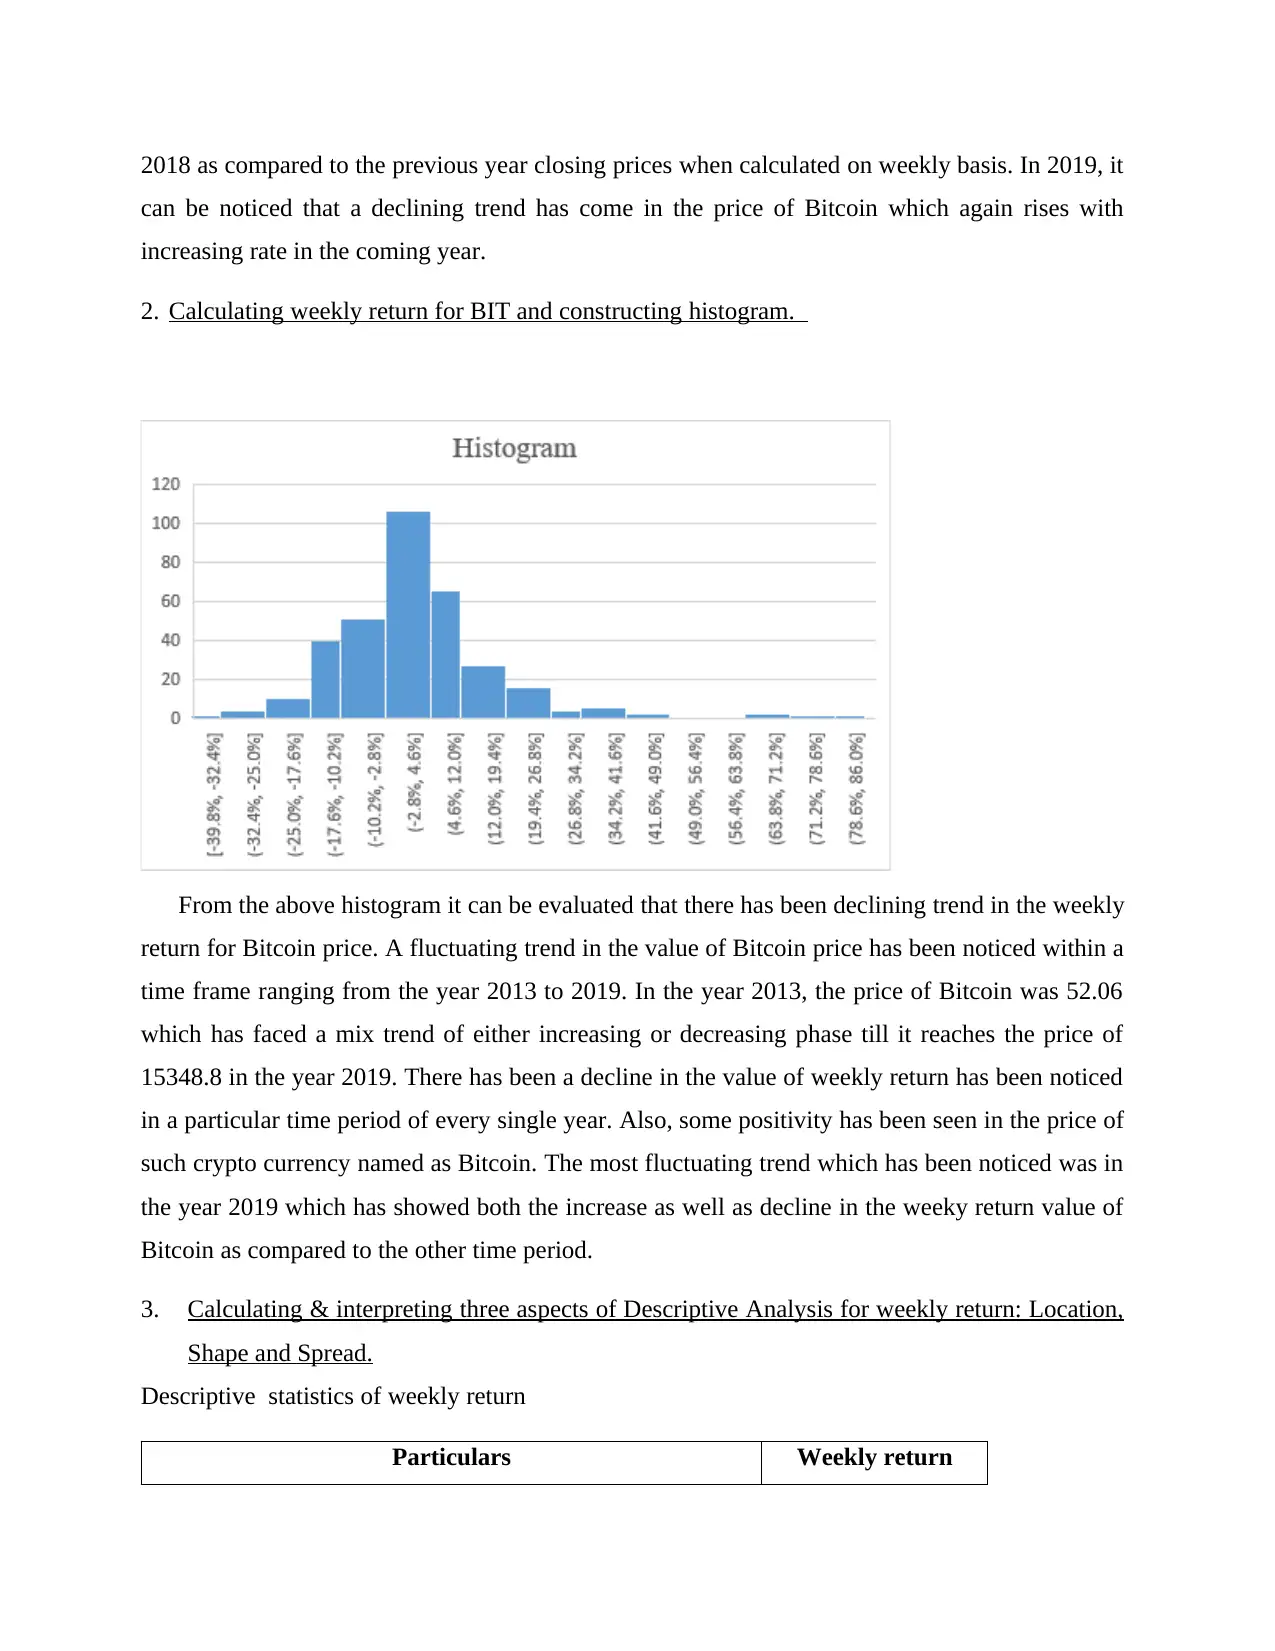
2. Calculating weekly return for BIT and constructing histogram.
From the above histogram it can be evaluated that there has been declining trend in the weekly
return for Bitcoin price. A fluctuating trend in the value of Bitcoin price has been noticed within a
time frame ranging from the year 2013 to 2019. In the year 2013, the price of Bitcoin was 52.06
which has faced a mix trend of either increasing or decreasing phase till it reaches the price of
15348.8 in the year 2019. There has been a decline in the value of weekly return has been noticed
in a particular time period of every single year. Also, some positivity has been seen in the price of
such crypto currency named as Bitcoin. The most fluctuating trend which has been noticed was in
the year 2019 which has showed both the increase as well as decline in the weeky return value of
Bitcoin as compared to the other time period.
3. Calculating & interpreting three aspects of Descriptive Analysis for weekly return: Location,
Shape and Spread.
Descriptive statistics of weekly return
Particulars Weekly return
can be noticed that a declining trend has come in the price of Bitcoin which again rises with
increasing rate in the coming year.
2. Calculating weekly return for BIT and constructing histogram.
From the above histogram it can be evaluated that there has been declining trend in the weekly
return for Bitcoin price. A fluctuating trend in the value of Bitcoin price has been noticed within a
time frame ranging from the year 2013 to 2019. In the year 2013, the price of Bitcoin was 52.06
which has faced a mix trend of either increasing or decreasing phase till it reaches the price of
15348.8 in the year 2019. There has been a decline in the value of weekly return has been noticed
in a particular time period of every single year. Also, some positivity has been seen in the price of
such crypto currency named as Bitcoin. The most fluctuating trend which has been noticed was in
the year 2019 which has showed both the increase as well as decline in the weeky return value of
Bitcoin as compared to the other time period.
3. Calculating & interpreting three aspects of Descriptive Analysis for weekly return: Location,
Shape and Spread.
Descriptive statistics of weekly return
Particulars Weekly return
Mean 0.027
Standard Error 0.008
Median 0.014
Mode #N/A
Standard Deviation 0.147
Sample Variance 0.022
Kurtosis 6.297
Skewness 1.514
Range 1.255
Minimum -0.398
Maximum 0.857
Sum 8.974
Count 335
Confidence Level (95.0%) 0.016
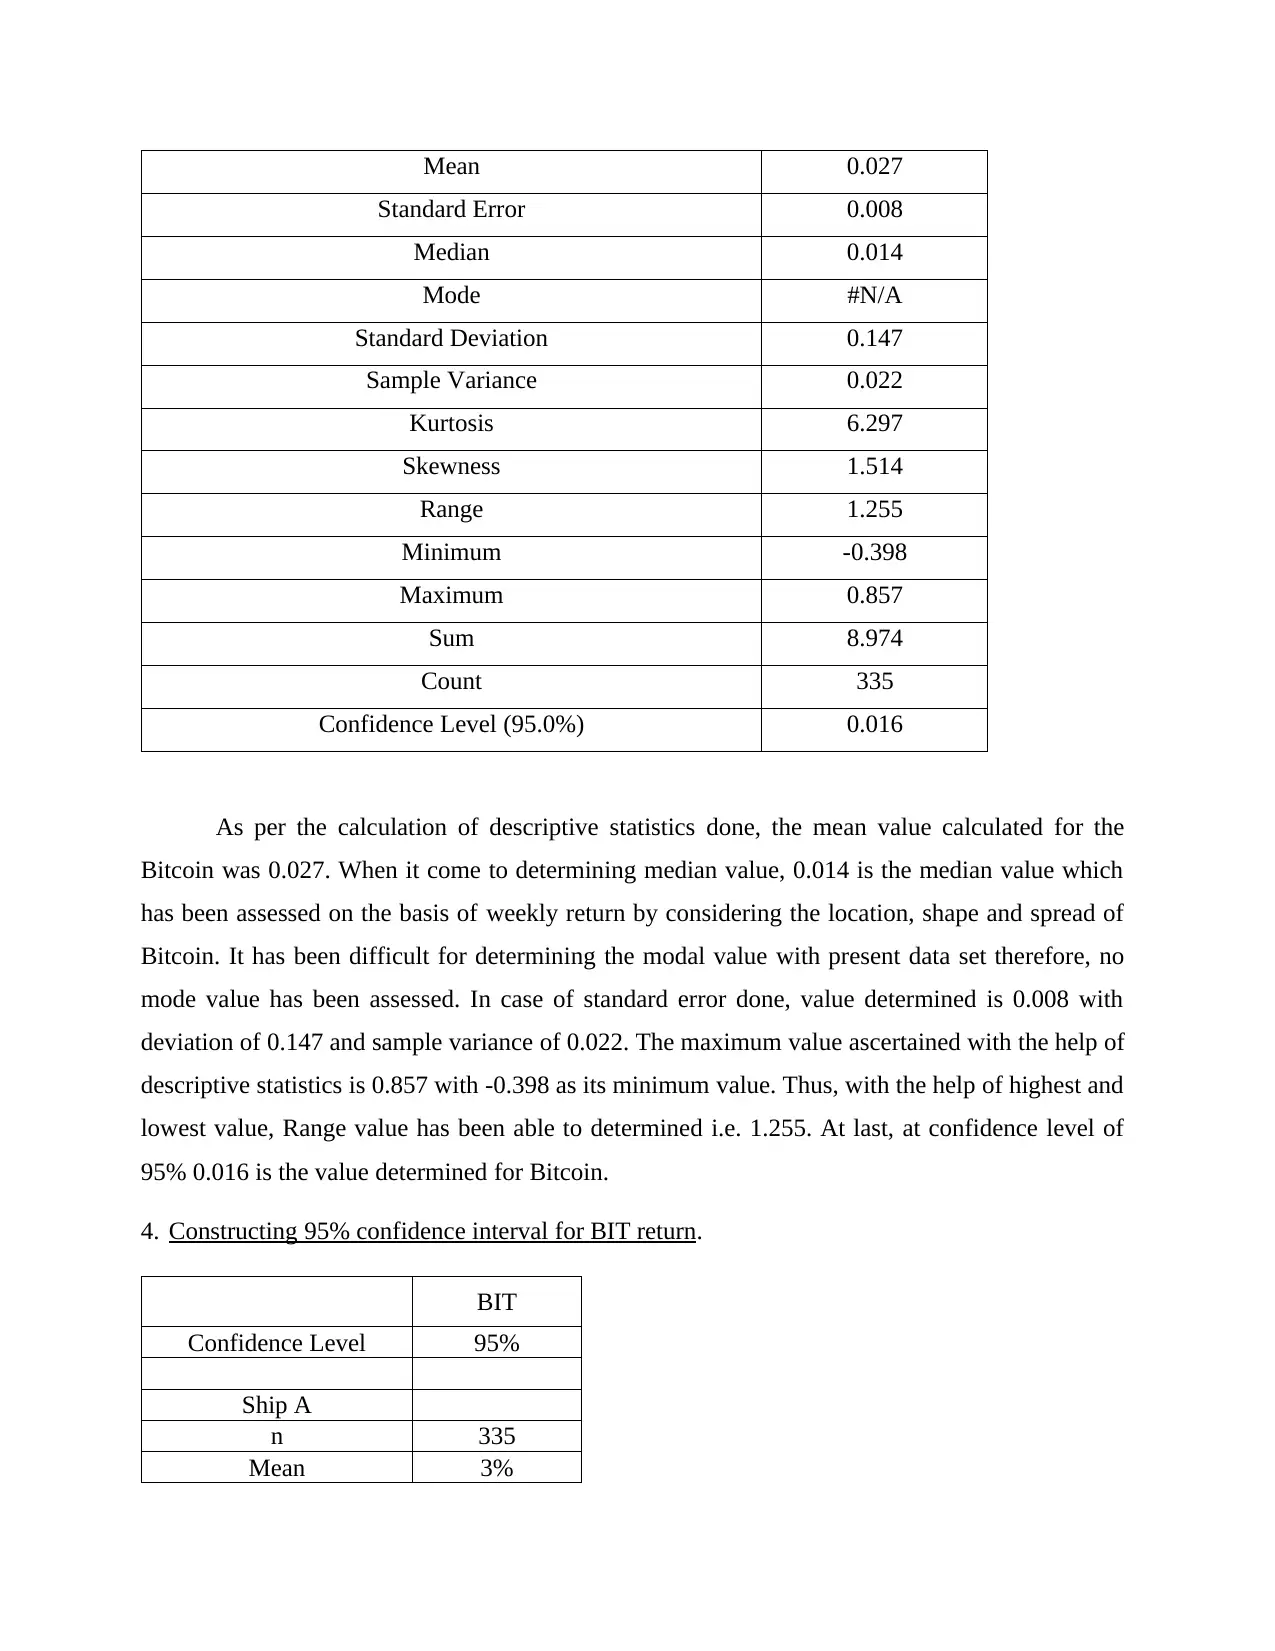
As per the calculation of descriptive statistics done, the mean value calculated for the
Bitcoin was 0.027. When it come to determining median value, 0.014 is the median value which
has been assessed on the basis of weekly return by considering the location, shape and spread of
Bitcoin. It has been difficult for determining the modal value with present data set therefore, no
mode value has been assessed. In case of standard error done, value determined is 0.008 with
deviation of 0.147 and sample variance of 0.022. The maximum value ascertained with the help of
descriptive statistics is 0.857 with -0.398 as its minimum value. Thus, with the help of highest and
lowest value, Range value has been able to determined i.e. 1.255. At last, at confidence level of
95% 0.016 is the value determined for Bitcoin.
4. Constructing 95% confidence interval for BIT return.
BIT
Confidence Level 95%
Ship A
n 335
Mean 3%
Standard Error 0.008
Median 0.014
Mode #N/A
Standard Deviation 0.147
Sample Variance 0.022
Kurtosis 6.297
Skewness 1.514
Range 1.255
Minimum -0.398
Maximum 0.857
Sum 8.974
Count 335
Confidence Level (95.0%) 0.016
As per the calculation of descriptive statistics done, the mean value calculated for the
Bitcoin was 0.027. When it come to determining median value, 0.014 is the median value which
has been assessed on the basis of weekly return by considering the location, shape and spread of
Bitcoin. It has been difficult for determining the modal value with present data set therefore, no
mode value has been assessed. In case of standard error done, value determined is 0.008 with
deviation of 0.147 and sample variance of 0.022. The maximum value ascertained with the help of
descriptive statistics is 0.857 with -0.398 as its minimum value. Thus, with the help of highest and
lowest value, Range value has been able to determined i.e. 1.255. At last, at confidence level of
95% 0.016 is the value determined for Bitcoin.
4. Constructing 95% confidence interval for BIT return.
BIT
Confidence Level 95%
Ship A
n 335
Mean 3%
⊘ This is a preview!⊘
Do you want full access?
Subscribe today to unlock all pages.
Trusted by 1+ million students worldwide
Std Dev 0.147176168
RESULTS
SE 0.008
Z 1.960
Margin of Error 0.016
Lower Limit 1%
Upper Limit 4%
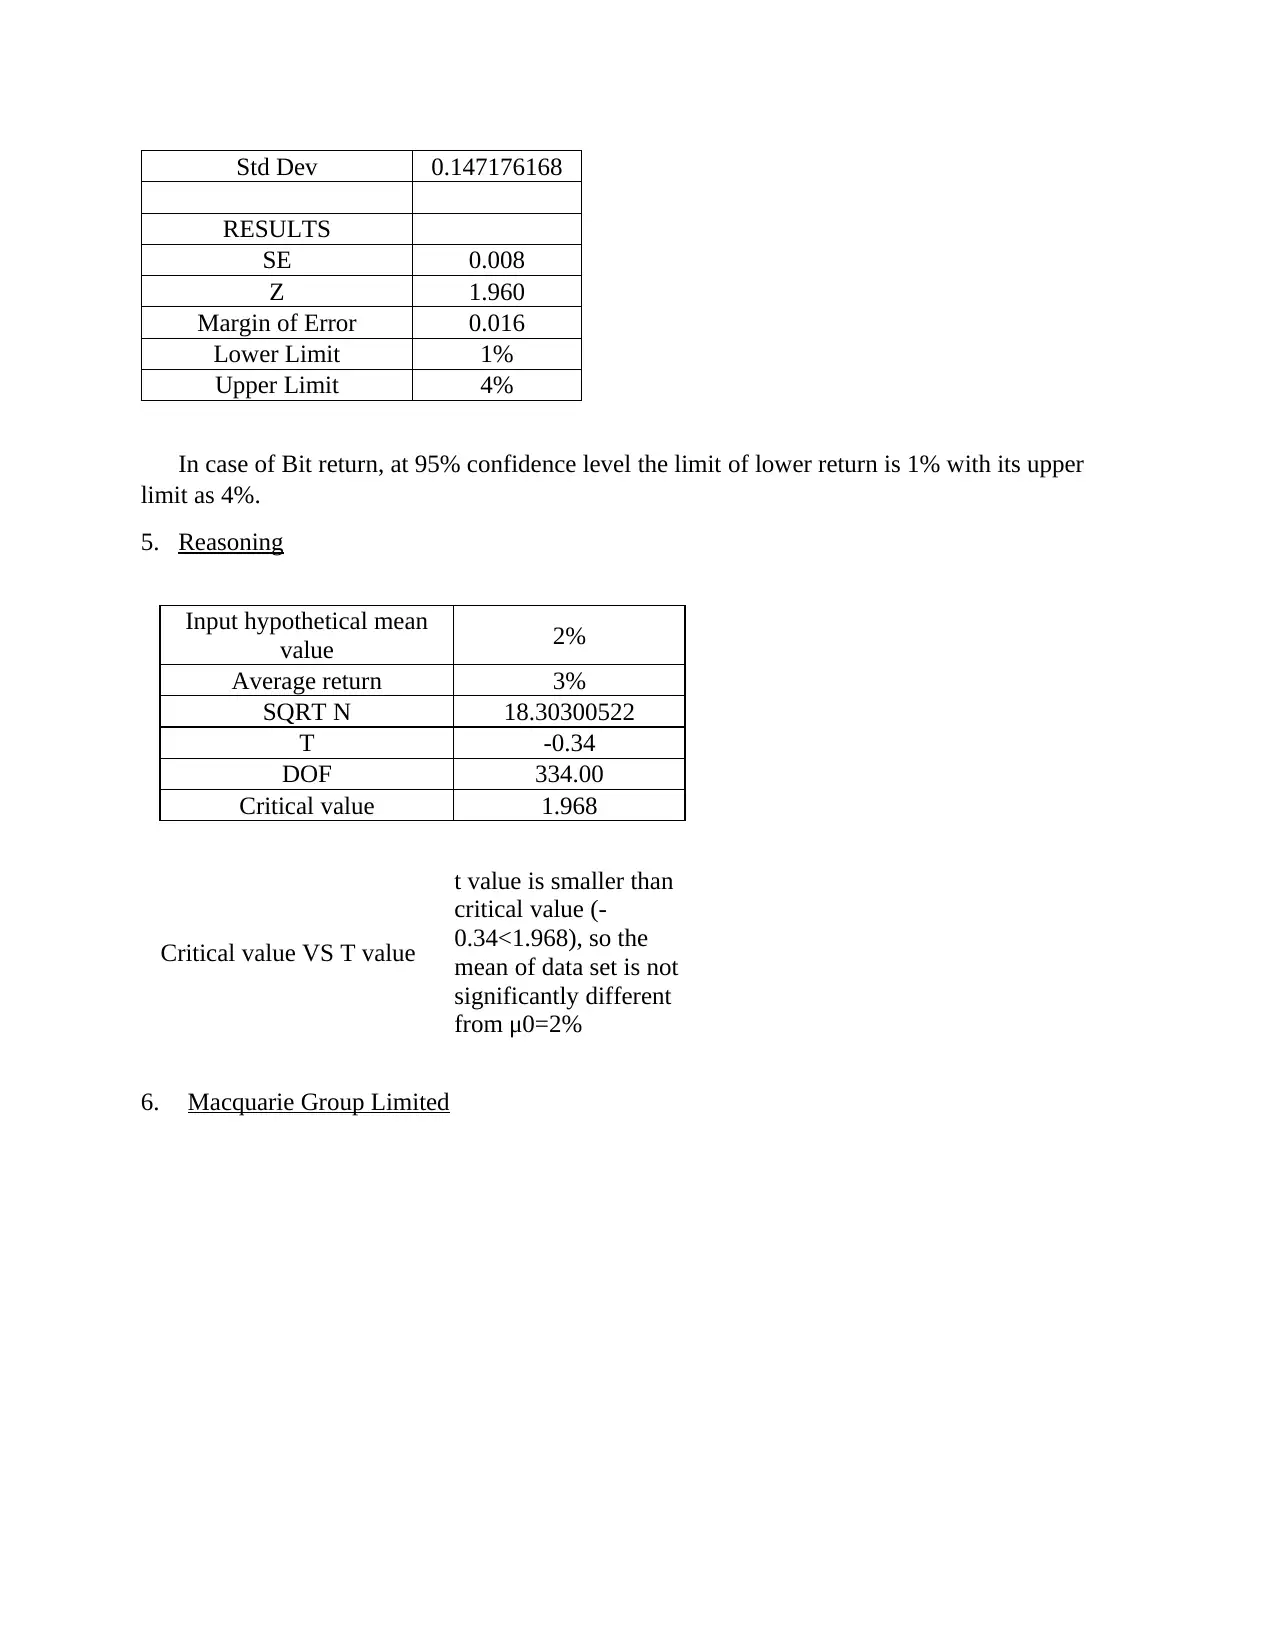
In case of Bit return, at 95% confidence level the limit of lower return is 1% with its upper
limit as 4%.
5. Reasoning
Input hypothetical mean
value 2%
Average return 3%
SQRT N 18.30300522
T -0.34
DOF 334.00
Critical value 1.968
Critical value VS T value
t value is smaller than
critical value (-
0.34<1.968), so the
mean of data set is not
significantly different
from μ0=2%
6. Macquarie Group Limited
RESULTS
SE 0.008
Z 1.960
Margin of Error 0.016
Lower Limit 1%
Upper Limit 4%
In case of Bit return, at 95% confidence level the limit of lower return is 1% with its upper
limit as 4%.
5. Reasoning
Input hypothetical mean
value 2%
Average return 3%
SQRT N 18.30300522
T -0.34
DOF 334.00
Critical value 1.968
Critical value VS T value
t value is smaller than
critical value (-
0.34<1.968), so the
mean of data set is not
significantly different
from μ0=2%
6. Macquarie Group Limited
Paraphrase This Document
Need a fresh take? Get an instant paraphrase of this document with our AI Paraphraser
1. Line graph
3/11/2013
6/17/2013
9/23/2013
12/30/2013
4/7/2014
7/14/2014
10/20/2014
1/26/2015
5/4/2015
8/10/2015
11/16/2015
2/22/2016
5/30/2016
9/5/2016
12/12/2016
3/20/2017
6/26/2017
10/2/2017
1/8/2018
4/16/2018
7/23/2018
10/29/2018
2/4/2019
5/13/2019
0
20
40
60
80
100
120
140
160
MAC
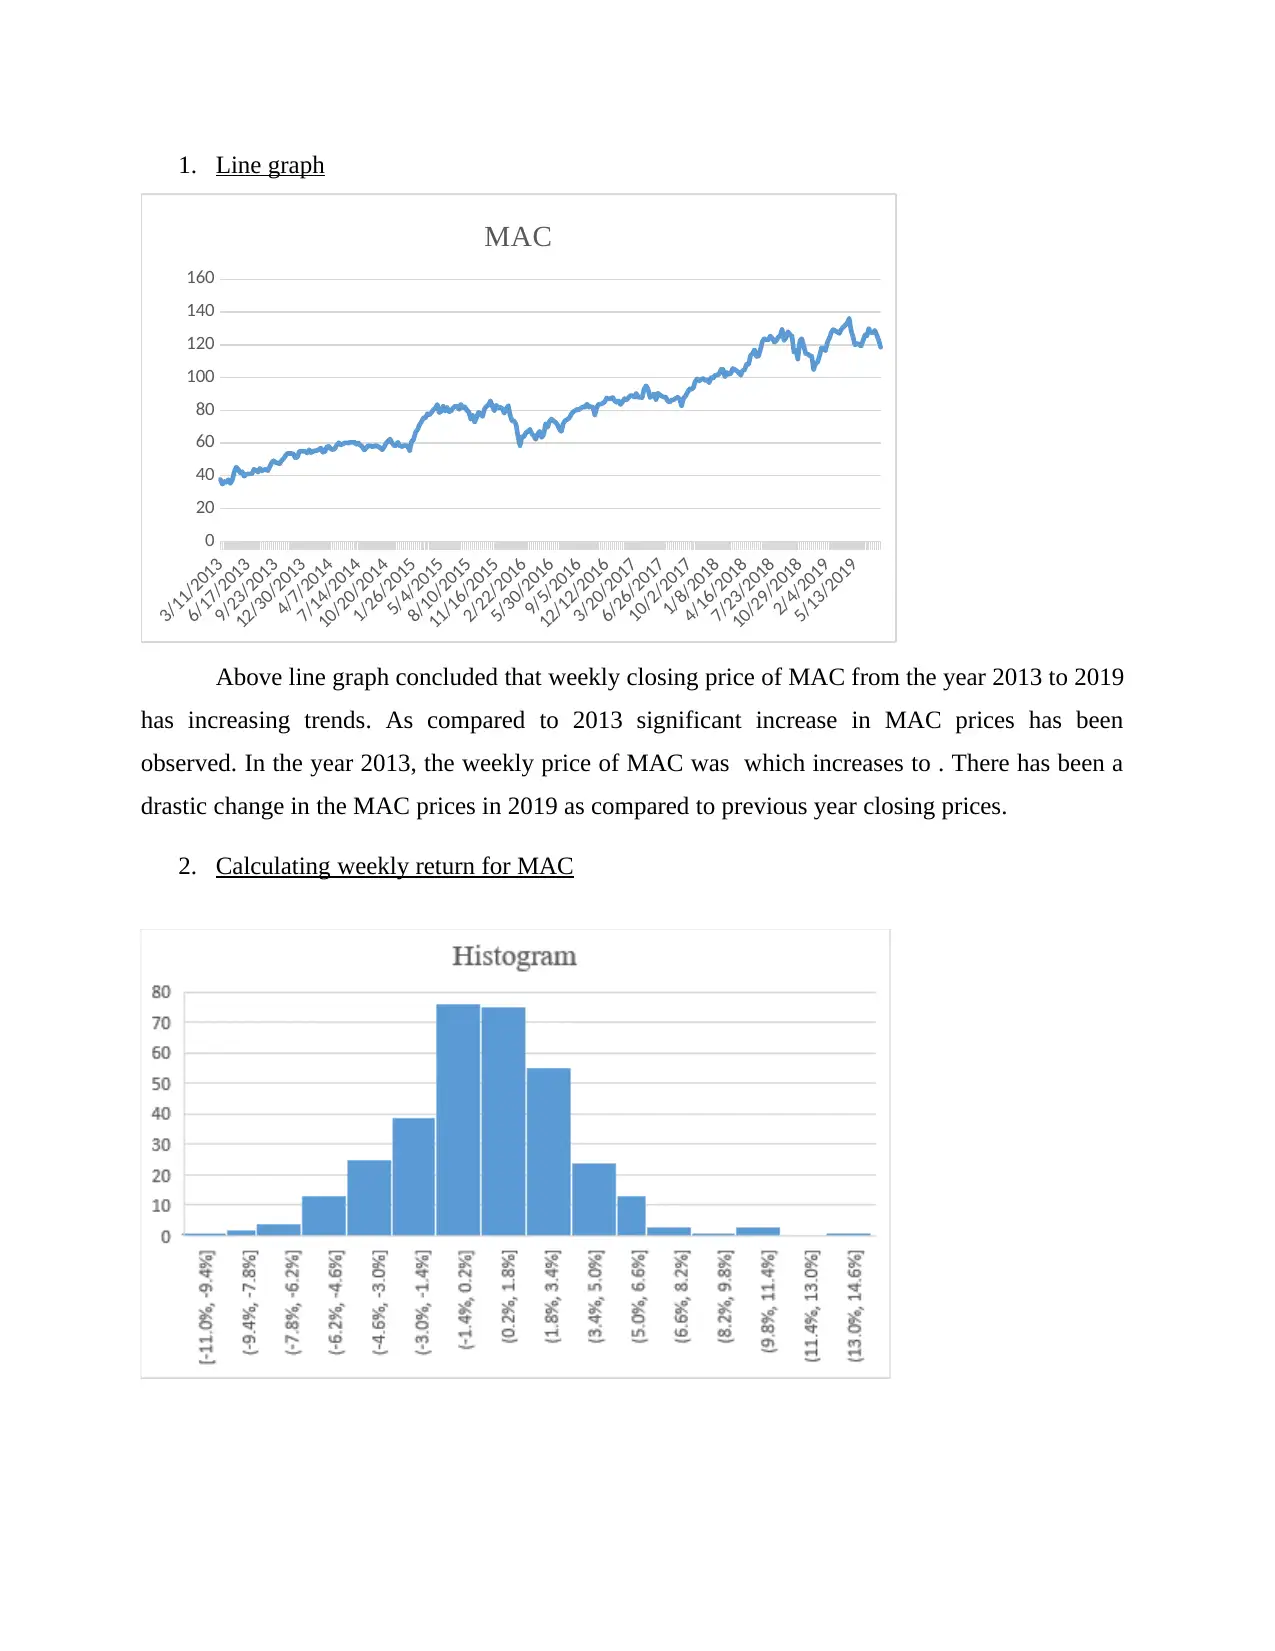
Above line graph concluded that weekly closing price of MAC from the year 2013 to 2019
has increasing trends. As compared to 2013 significant increase in MAC prices has been
observed. In the year 2013, the weekly price of MAC was which increases to . There has been a
drastic change in the MAC prices in 2019 as compared to previous year closing prices.
2. Calculating weekly return for MAC
3/11/2013
6/17/2013
9/23/2013
12/30/2013
4/7/2014
7/14/2014
10/20/2014
1/26/2015
5/4/2015
8/10/2015
11/16/2015
2/22/2016
5/30/2016
9/5/2016
12/12/2016
3/20/2017
6/26/2017
10/2/2017
1/8/2018
4/16/2018
7/23/2018
10/29/2018
2/4/2019
5/13/2019
0
20
40
60
80
100
120
140
160
MAC
Above line graph concluded that weekly closing price of MAC from the year 2013 to 2019
has increasing trends. As compared to 2013 significant increase in MAC prices has been
observed. In the year 2013, the weekly price of MAC was which increases to . There has been a
drastic change in the MAC prices in 2019 as compared to previous year closing prices.
2. Calculating weekly return for MAC
From the above histogram it can be interpreted that there is mixed trend in the weekly return
among MAC prices from the year 2013 to 2019. In the year 2013, the price was 37.715 which has
increases to 118.54 in the year 2019. Also, a decline in the value of weekly return has been
noticed in prices of MAC.
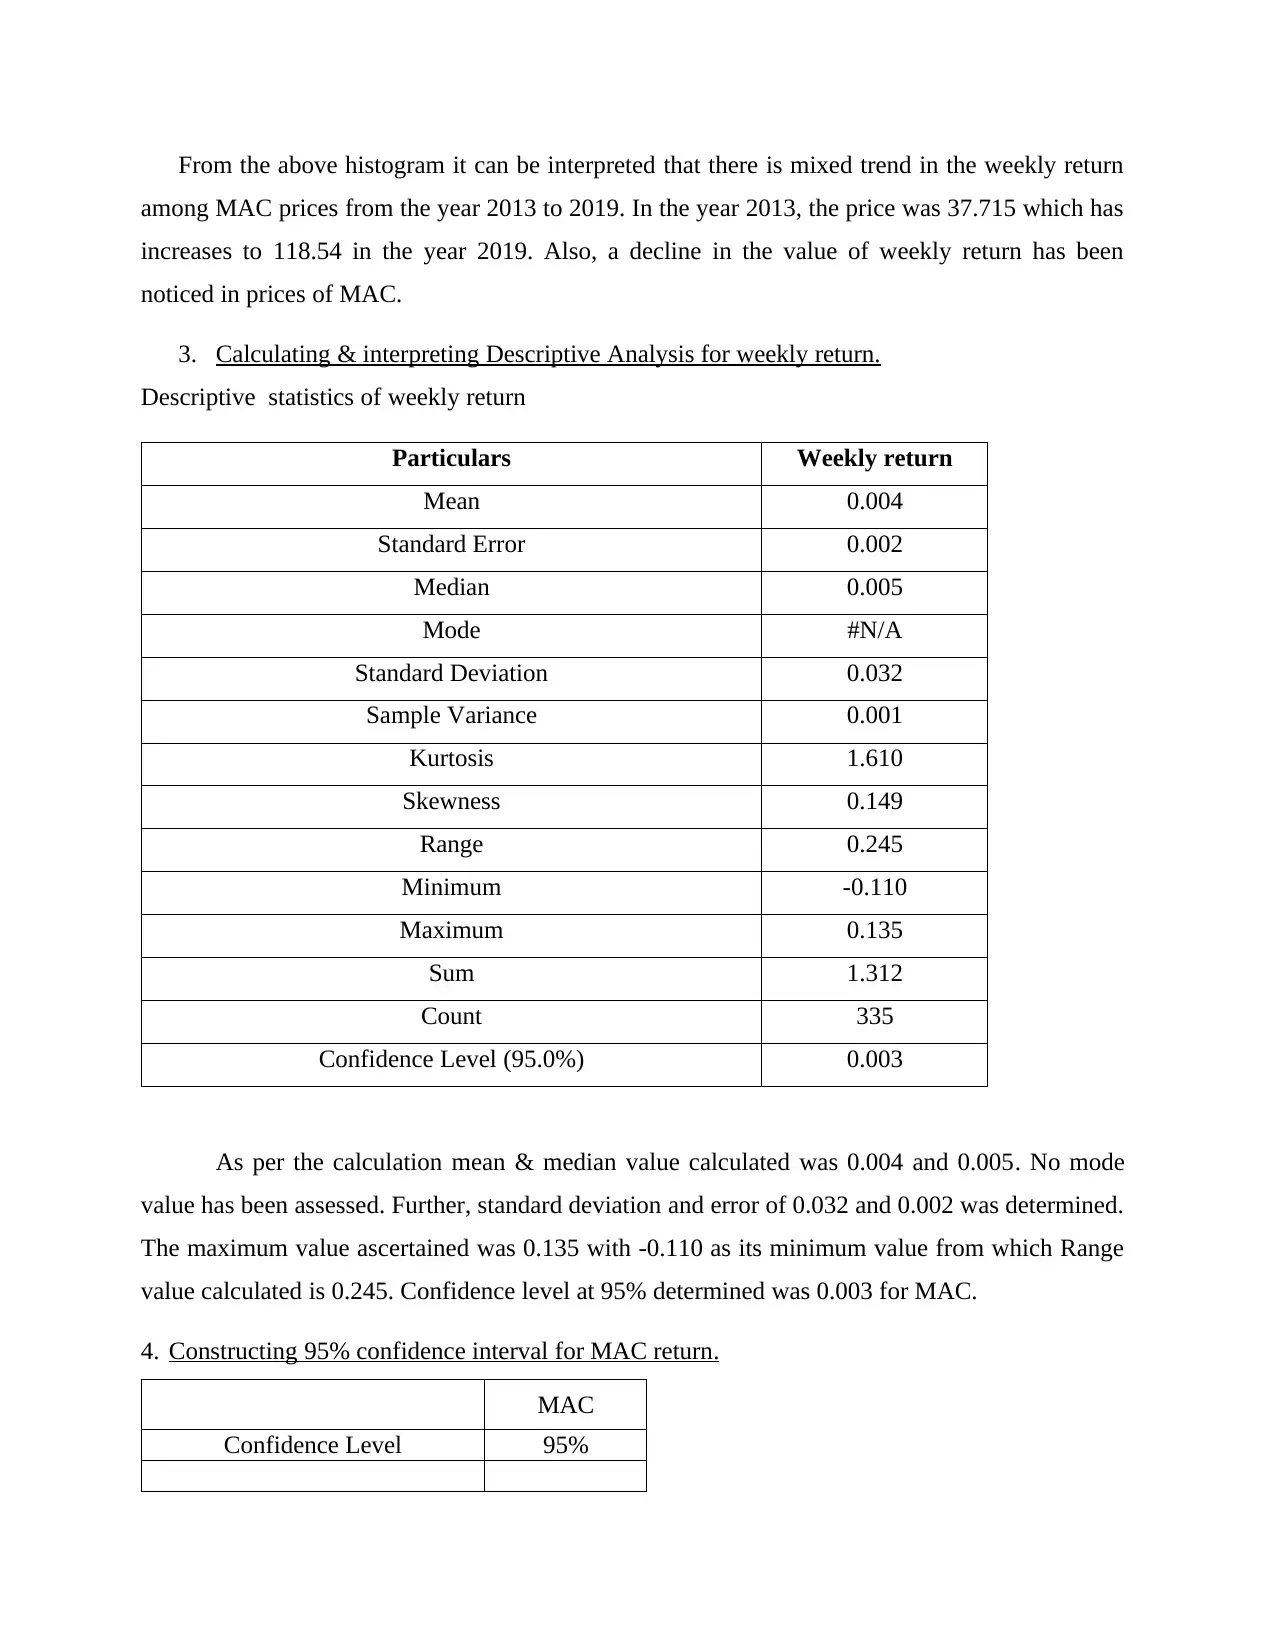
3. Calculating & interpreting Descriptive Analysis for weekly return.
Descriptive statistics of weekly return
Particulars Weekly return
Mean 0.004
Standard Error 0.002
Median 0.005
Mode #N/A
Standard Deviation 0.032
Sample Variance 0.001
Kurtosis 1.610
Skewness 0.149
Range 0.245
Minimum -0.110
Maximum 0.135
Sum 1.312
Count 335
Confidence Level (95.0%) 0.003
As per the calculation mean & median value calculated was 0.004 and 0.005. No mode
value has been assessed. Further, standard deviation and error of 0.032 and 0.002 was determined.
The maximum value ascertained was 0.135 with -0.110 as its minimum value from which Range
value calculated is 0.245. Confidence level at 95% determined was 0.003 for MAC.
4. Constructing 95% confidence interval for MAC return.
MAC
Confidence Level 95%
among MAC prices from the year 2013 to 2019. In the year 2013, the price was 37.715 which has
increases to 118.54 in the year 2019. Also, a decline in the value of weekly return has been
noticed in prices of MAC.
3. Calculating & interpreting Descriptive Analysis for weekly return.
Descriptive statistics of weekly return
Particulars Weekly return
Mean 0.004
Standard Error 0.002
Median 0.005
Mode #N/A
Standard Deviation 0.032
Sample Variance 0.001
Kurtosis 1.610
Skewness 0.149
Range 0.245
Minimum -0.110
Maximum 0.135
Sum 1.312
Count 335
Confidence Level (95.0%) 0.003
As per the calculation mean & median value calculated was 0.004 and 0.005. No mode
value has been assessed. Further, standard deviation and error of 0.032 and 0.002 was determined.
The maximum value ascertained was 0.135 with -0.110 as its minimum value from which Range
value calculated is 0.245. Confidence level at 95% determined was 0.003 for MAC.
4. Constructing 95% confidence interval for MAC return.
MAC
Confidence Level 95%
⊘ This is a preview!⊘
Do you want full access?
Subscribe today to unlock all pages.
Trusted by 1+ million students worldwide
Ship A
n 334
Mean 0.39%
Std Dev 0.03151
RESULTS
SE 0.002
Z 1.960
Margin of Error 0.003
Lower Limit 0.05%
Upper Limit 0.73%
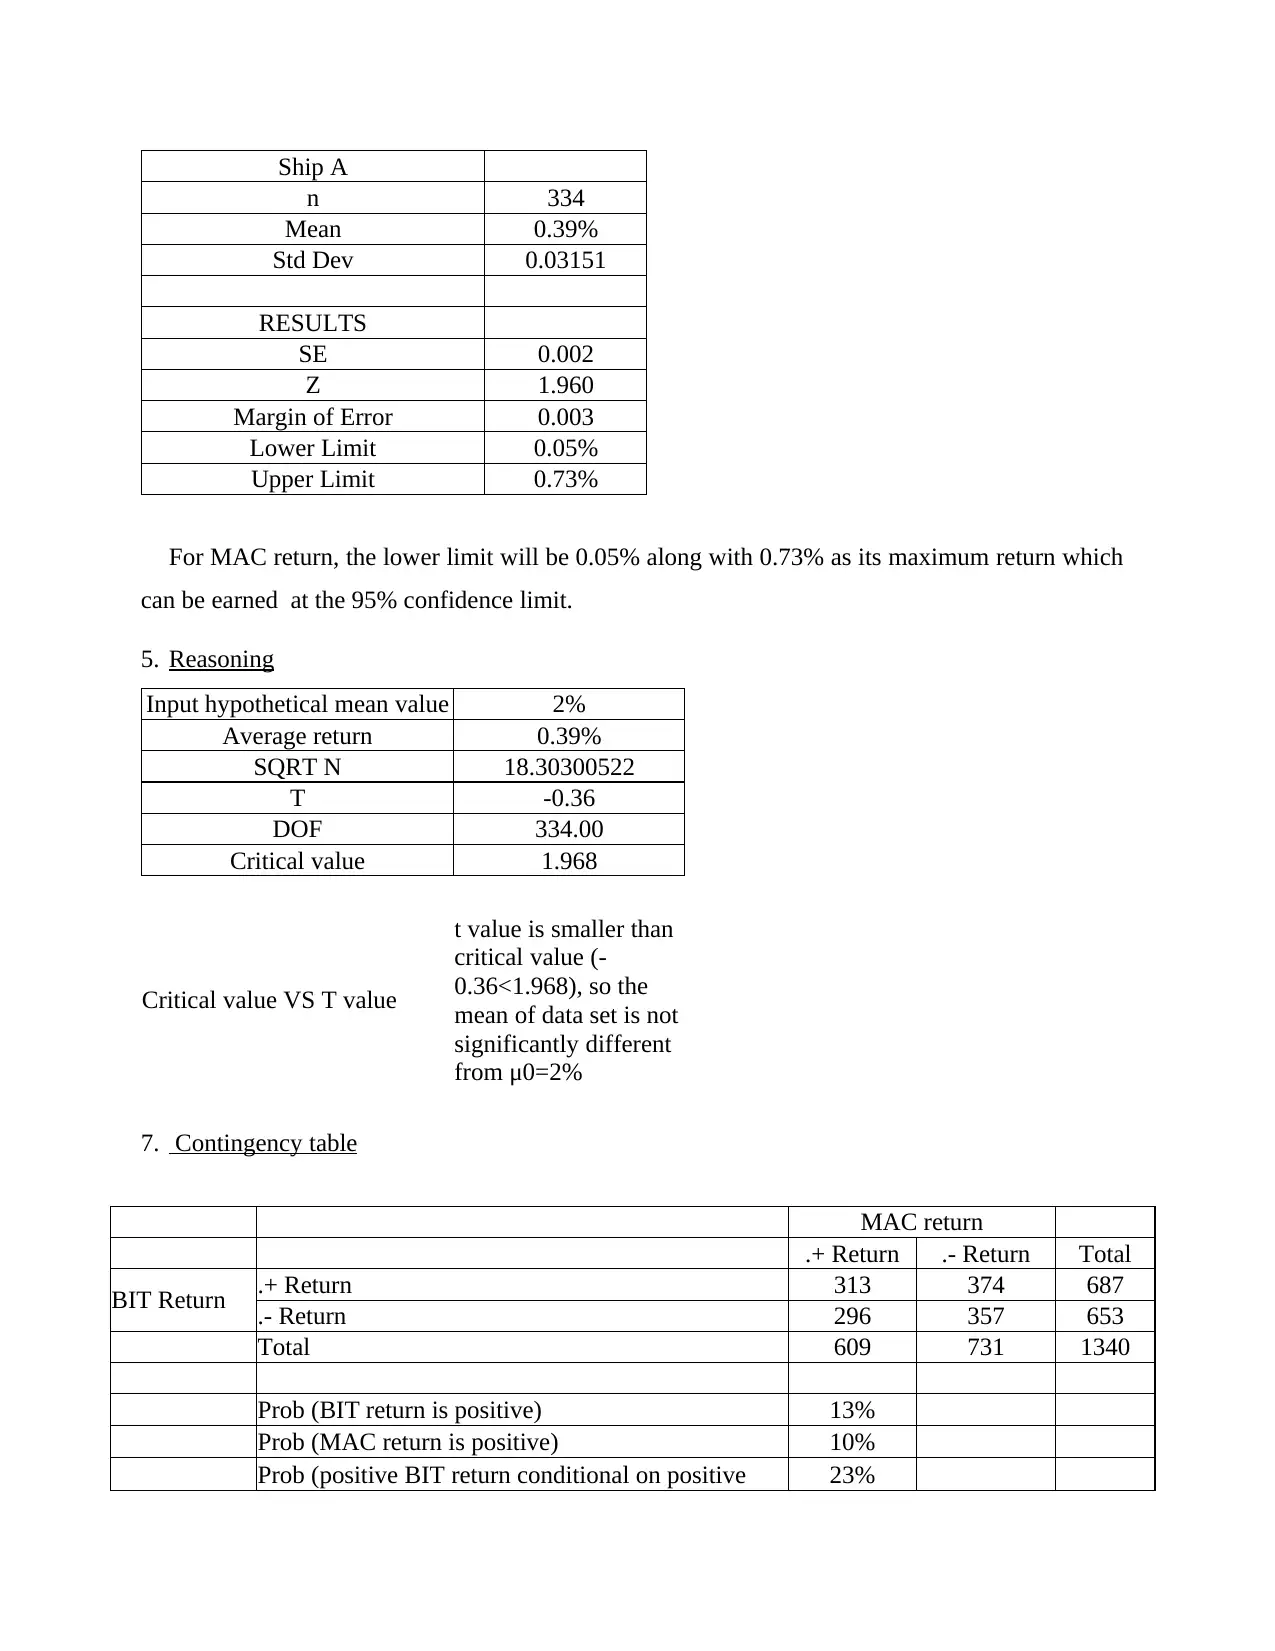
For MAC return, the lower limit will be 0.05% along with 0.73% as its maximum return which
can be earned at the 95% confidence limit.
5. Reasoning
Input hypothetical mean value 2%
Average return 0.39%
SQRT N 18.30300522
T -0.36
DOF 334.00
Critical value 1.968
Critical value VS T value
t value is smaller than
critical value (-
0.36<1.968), so the
mean of data set is not
significantly different
from μ0=2%
7. Contingency table
MAC return
.+ Return .- Return Total
BIT Return .+ Return 313 374 687
.- Return 296 357 653
Total 609 731 1340
Prob (BIT return is positive) 13%
Prob (MAC return is positive) 10%
Prob (positive BIT return conditional on positive 23%
n 334
Mean 0.39%
Std Dev 0.03151
RESULTS
SE 0.002
Z 1.960
Margin of Error 0.003
Lower Limit 0.05%
Upper Limit 0.73%
For MAC return, the lower limit will be 0.05% along with 0.73% as its maximum return which
can be earned at the 95% confidence limit.
5. Reasoning
Input hypothetical mean value 2%
Average return 0.39%
SQRT N 18.30300522
T -0.36
DOF 334.00
Critical value 1.968
Critical value VS T value
t value is smaller than
critical value (-
0.36<1.968), so the
mean of data set is not
significantly different
from μ0=2%
7. Contingency table
MAC return
.+ Return .- Return Total
BIT Return .+ Return 313 374 687
.- Return 296 357 653
Total 609 731 1340
Prob (BIT return is positive) 13%
Prob (MAC return is positive) 10%
Prob (positive BIT return conditional on positive 23%
Paraphrase This Document
Need a fresh take? Get an instant paraphrase of this document with our AI Paraphraser
MAC return)
CONCLUSION
From the above file it can be concluded that both the Bitcoin and MAC are having
minimum return of 1% and 0.05%. On the other hand, in case of maximum return the percentage
is 4% and 0.73% for Bitcoin and MAC respectively. Bitcoin has been faciong declining and
fluctuating trend in case of weekly return and weekly closing prices whereas in case of MAC
prices there has been noticed an increasing trend from the year 2013 to year 2019.
REFERENCES
Books and Journals
Bowden, R. and et.al., 2018. Block arrivals in the Bitcoin blockchain. arXiv preprint
arXiv:1801.07447.
Di Crescenzo, A., Martinucci, B. and Mulero, J., 2016. A quantile-based probabilistic mean value
theorem. Probability in the Engineering and Informational Sciences. 30(2). pp.261-280.
Lu, J., Microsoft Technology Licensing LLC, 2015. Iteratively calculating standard deviation for
streamed data. U.S. Patent 9,069,726.
Massmann, C., Woods, R. and Wagener, T., 2018, April. Reducing equifinality by carrying out a
multi-objective evaluation based on the bias, correlation and standard deviation errors.
In EGU General Assembly Conference Abstracts (Vol. 20, p. 11457).
Online
Blockchain technology. 2019. [Online]. Available through: <data61.csiro.au/en/our-work/safety-
and-security/secure-systems-and-platforms/blockchain>.
⊘ This is a preview!⊘
Do you want full access?
Subscribe today to unlock all pages.
Trusted by 1+ million students worldwide
1 out of 35
Related Documents


Your All-in-One AI-Powered Toolkit for Academic Success.
+13062052269
info@desklib.com
Available 24*7 on WhatsApp / Email
![[object Object]](/_next/static/media/star-bottom.7253800d.svg)
Unlock your academic potential
Copyright © 2020–2026 A2Z Services. All Rights Reserved. Developed and managed by ZUCOL.