Analysis of Bitcoin Investment Potential vs. Stock Market Performance
VerifiedAdded on 2022/11/01
|15
|3758
|238
Report
AI Summary
This report provides a comprehensive analysis of Bitcoin's investment potential, comparing its performance and risks to those of Macquarie Group Limited (MAC) stock. The study utilizes weekly price data from Yahoo Finance to evaluate the volatility, returns, and trends of both Bitcoin and MAC. The analysis reveals that Bitcoin exhibits significantly higher volatility compared to MAC, with substantial fluctuations in weekly returns and a non-normal distribution. Bitcoin shows a higher expected weekly return, but the high standard deviation indicates considerable investment risk. In contrast, MAC demonstrates relatively stable price increases and normally distributed returns, suggesting it as a safer investment option. The report concludes that Bitcoin is suitable for risk-takers due to its speculative nature, while MAC is recommended for risk-averse investors. The report includes detailed statistical analyses, including descriptive statistics, hypothesis testing, and confidence intervals, to support its conclusions. The report aims to assess the investment potential of bitcoin, its applications and drawbacks, and the relationship between bitcoin returns and those of Macquarie group limited.
BLOCKCHAIN TECHNOLOGY AND ITS INVESTMENT
POTENTIALITY
Executive Summary
Cryptocurrency is an application of blockchain technology that functions as an alternative currency.
The blockchain technology do operate outside government control and allows parties to have an
online interaction. The interaction can involve verifying transactions with no impact from third
parties. Lack of government supervision means reduced number of stakeholders hence low cost and
time involve in trading cryptocurrency. The lack of government control though brings about issues of
trust among the investors. In this report the objective is to analyse the investment potentiality of
bitcoin and compare it with other traded stocks such as MAC. The data was collected on weekly
prices of bitcoin and MAC from yahoo finance and thereafter analysed using excel. From the findings
of the analysis, it can be noted that the prices and returns of cryptocurrency is highly volatile
compared to MAC. Bitcoin has a higher expected weekly return rate though the high standard
deviation means investors are exposed to very high risks of losing their money in case of deviations.
On the other hand, the prices of MAC have been relatively stable from 2013 to date. The prices are
continuously increasing in a steady trend. Drawing a histogram, of returns from MAC gives a
normally distributed return. MAC is therefore a safer investment option that can be recommended for
risk averse decision makers. An investment in bitcoin can be treated as a form of speculation and
hence is only recommended for risk takers.
1
Paraphrase This Document
Need a fresh take? Get an instant paraphrase of this document with our AI Paraphraser
Introduction
Blockchain is a form of distributed ledger technology that allows for the interaction of
several different parties through the use of the internet. It avails a secure and trustworthy
platform to view transaction records with no control by third parties. Once in the blockchain
platform an individual is able to verify where a transition has come from and gone to
(Griswold, 2014). This makes the technology to possess the potentiality of opening up new
economic ventures in fields like regtech, financial services, government registries as well as
supply chains.
The blockchain technology can be applied to better the operations of businesses and
government services; In business, the technology’s removal of third party makes it useful in
cutting down the number of stakeholders that are involved in a transaction, this reduces the
time and cost of carrying out business activities (Gilpin, 2014). The blockchain technology
also enables transparency in information sharing which increases stakeholders’ confidence
and thus cut down costs and risks of business. In government agencies, blockchain can be
applied as a common reference point that brings together different levels of government to
host government registries and provide open data. Such application enhances reliable
integration of government services , improved the mobility and consistency of business
across states as well as gives regulators a better platform to effectively carry out their
mandate (Commonwealth Scientific and Industrial Research Organisation, 2017).
One of the applications of blockchain technology in finance is the cryptocurrency.
Bitcoin is the name given to the most popular cryptocurrency. This is the cryptocurrency for
which the blockchain technology was invented. Cryptocurrency by definition is a medium of
exchange just like the US dollar though it is digital and applies the encryption technique to
control the creation of monetary units and to verify fund transactions (Likens, 2017).
Background of the study
Virtual currency also known as cryptocurrency are digital means of exchange that
were invented and is being used by private individuals or groups. Since majority of the digital
currencies are not national government regulated, they are considered as alternative
currencies, that is medium of financial exchange that do exist outside the bounds of state
monetary policy. Bitcoin is the prominent virtual currency and was the first to be accepted
widely (Rose, 2015). Hundreds of cryptocurrencies do exist and others continue to emerge in
the market every month.
These digital currencies have advantages as well as drawbacks which have made their
legal application to remain a controversial issue in several nations. Their application outside
government domain means the currencies are rarely regulated and can easily be used to
finance terror and other illegal crimes (Jeffries, 2013). Being a new technology, it is relevant
for investors to have an extensive market research before investing in them. In this report, the
aim is to evaluate the development and progress of bitcoin so as to gauge the investment
return potentiality of the blockchain technology.
Objectives of the report
The study objectives include;
To evaluate the recent bitcoin prices so as to gauge its investment potentiality.
2
To shed light into the applications and drawbacks of investing in bitcoins
To investigate the relationship between returns of bitcoin with those of Macquarie group
limited
Methodology
So as to achieve the mentioned objectives Yahoo finance was used to collect the
weekly closing prices of BIT and MAC. The obtained data was recorded in Microsoft excel
and analysis carried out.
Scope and structure of the report
The report covers introduction to the blockchain technology which entails
familiarizing with the new technology and its applications. In addition, the report will contain
the response to the data collected and analysed regarding the investment potentiality of the
virtual currencies. Afterwards, a conclusion will be drawn that summarizes the findings and
gives the necessary individuals and investment advice regarding whether to invest on
blockchain or not.
Part A
1. Bitcoin trend description
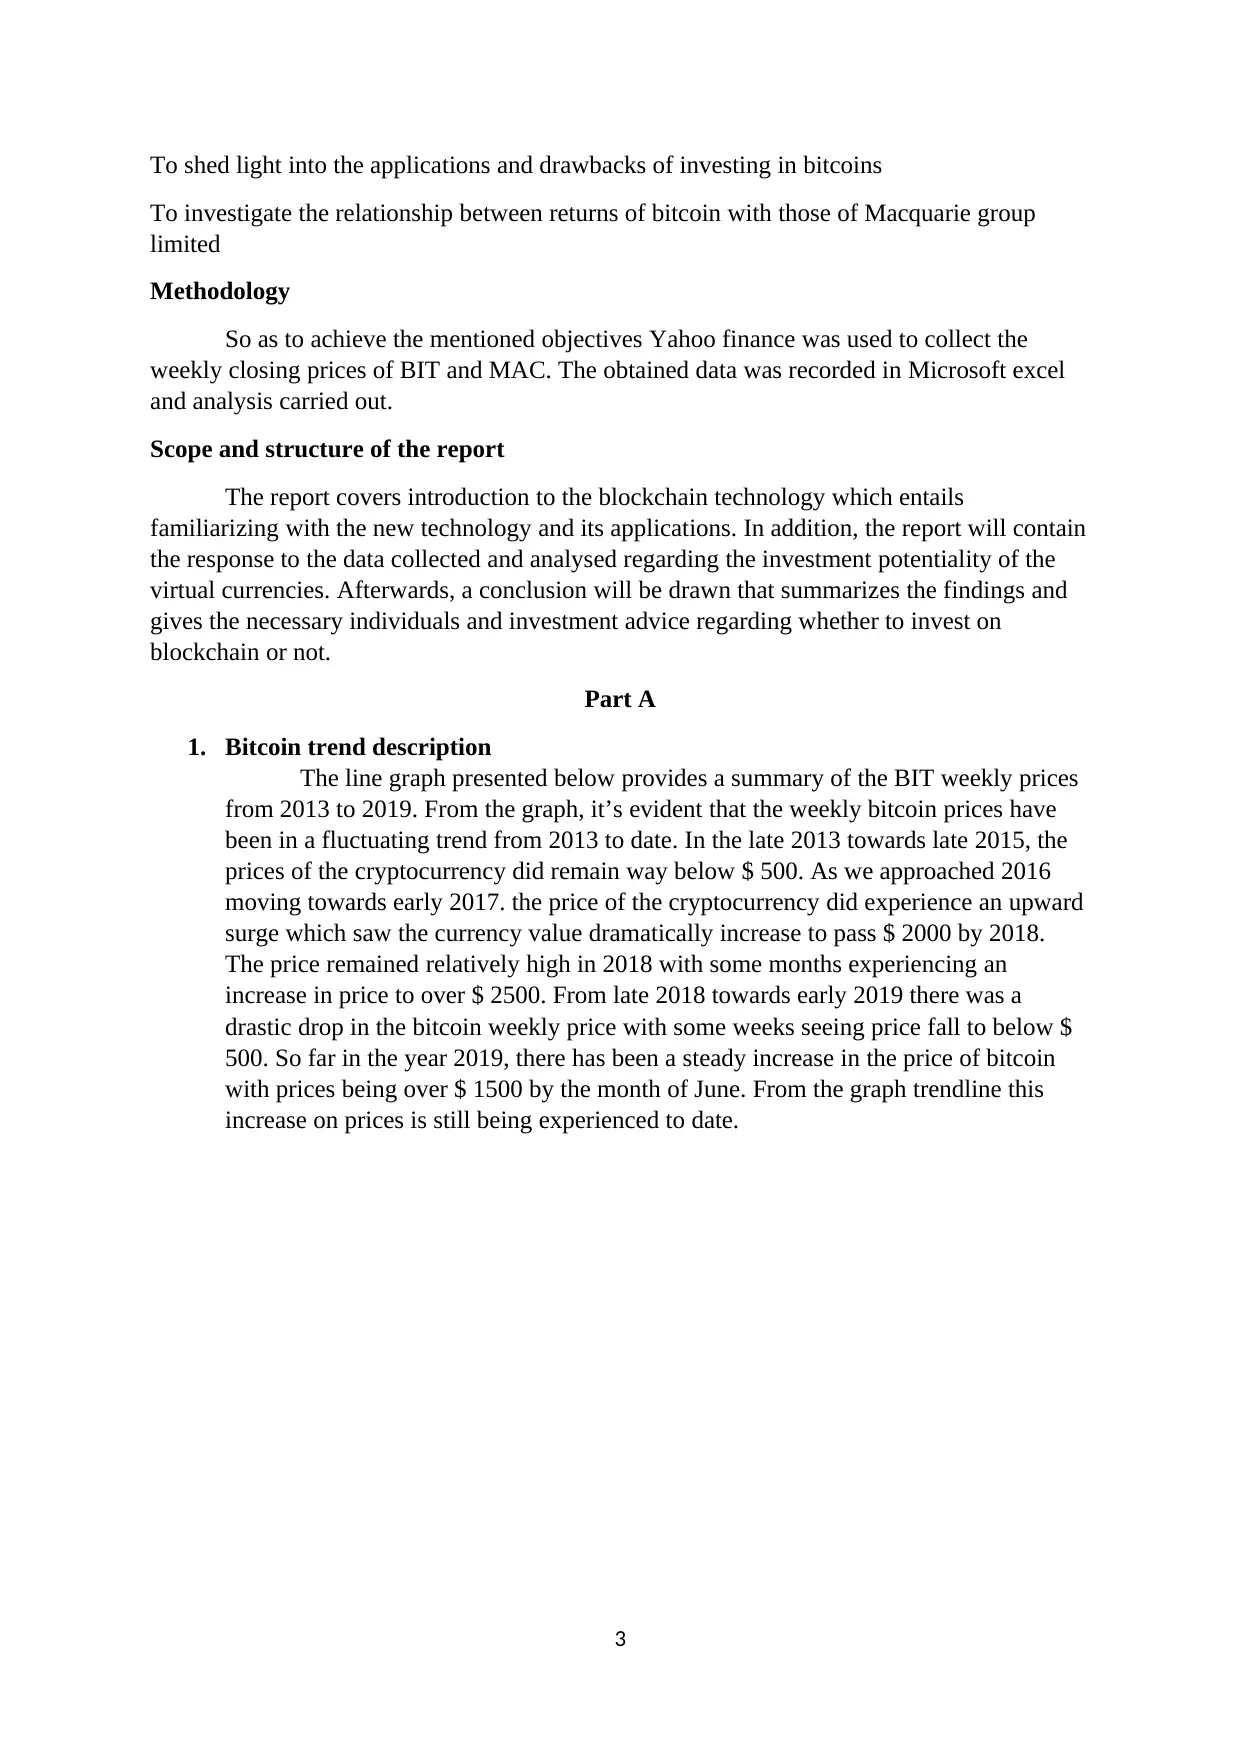
The line graph presented below provides a summary of the BIT weekly prices
from 2013 to 2019. From the graph, it’s evident that the weekly bitcoin prices have
been in a fluctuating trend from 2013 to date. In the late 2013 towards late 2015, the
prices of the cryptocurrency did remain way below $ 500. As we approached 2016
moving towards early 2017. the price of the cryptocurrency did experience an upward
surge which saw the currency value dramatically increase to pass $ 2000 by 2018.
The price remained relatively high in 2018 with some months experiencing an
increase in price to over $ 2500. From late 2018 towards early 2019 there was a
drastic drop in the bitcoin weekly price with some weeks seeing price fall to below $
500. So far in the year 2019, there has been a steady increase in the price of bitcoin
with prices being over $ 1500 by the month of June. From the graph trendline this
increase on prices is still being experienced to date.
3
To investigate the relationship between returns of bitcoin with those of Macquarie group
limited
Methodology
So as to achieve the mentioned objectives Yahoo finance was used to collect the
weekly closing prices of BIT and MAC. The obtained data was recorded in Microsoft excel
and analysis carried out.
Scope and structure of the report
The report covers introduction to the blockchain technology which entails
familiarizing with the new technology and its applications. In addition, the report will contain
the response to the data collected and analysed regarding the investment potentiality of the
virtual currencies. Afterwards, a conclusion will be drawn that summarizes the findings and
gives the necessary individuals and investment advice regarding whether to invest on
blockchain or not.
Part A
1. Bitcoin trend description
The line graph presented below provides a summary of the BIT weekly prices
from 2013 to 2019. From the graph, it’s evident that the weekly bitcoin prices have
been in a fluctuating trend from 2013 to date. In the late 2013 towards late 2015, the
prices of the cryptocurrency did remain way below $ 500. As we approached 2016
moving towards early 2017. the price of the cryptocurrency did experience an upward
surge which saw the currency value dramatically increase to pass $ 2000 by 2018.
The price remained relatively high in 2018 with some months experiencing an
increase in price to over $ 2500. From late 2018 towards early 2019 there was a
drastic drop in the bitcoin weekly price with some weeks seeing price fall to below $
500. So far in the year 2019, there has been a steady increase in the price of bitcoin
with prices being over $ 1500 by the month of June. From the graph trendline this
increase on prices is still being experienced to date.
3
⊘ This is a preview!⊘
Do you want full access?
Subscribe today to unlock all pages.
Trusted by 1+ million students worldwide
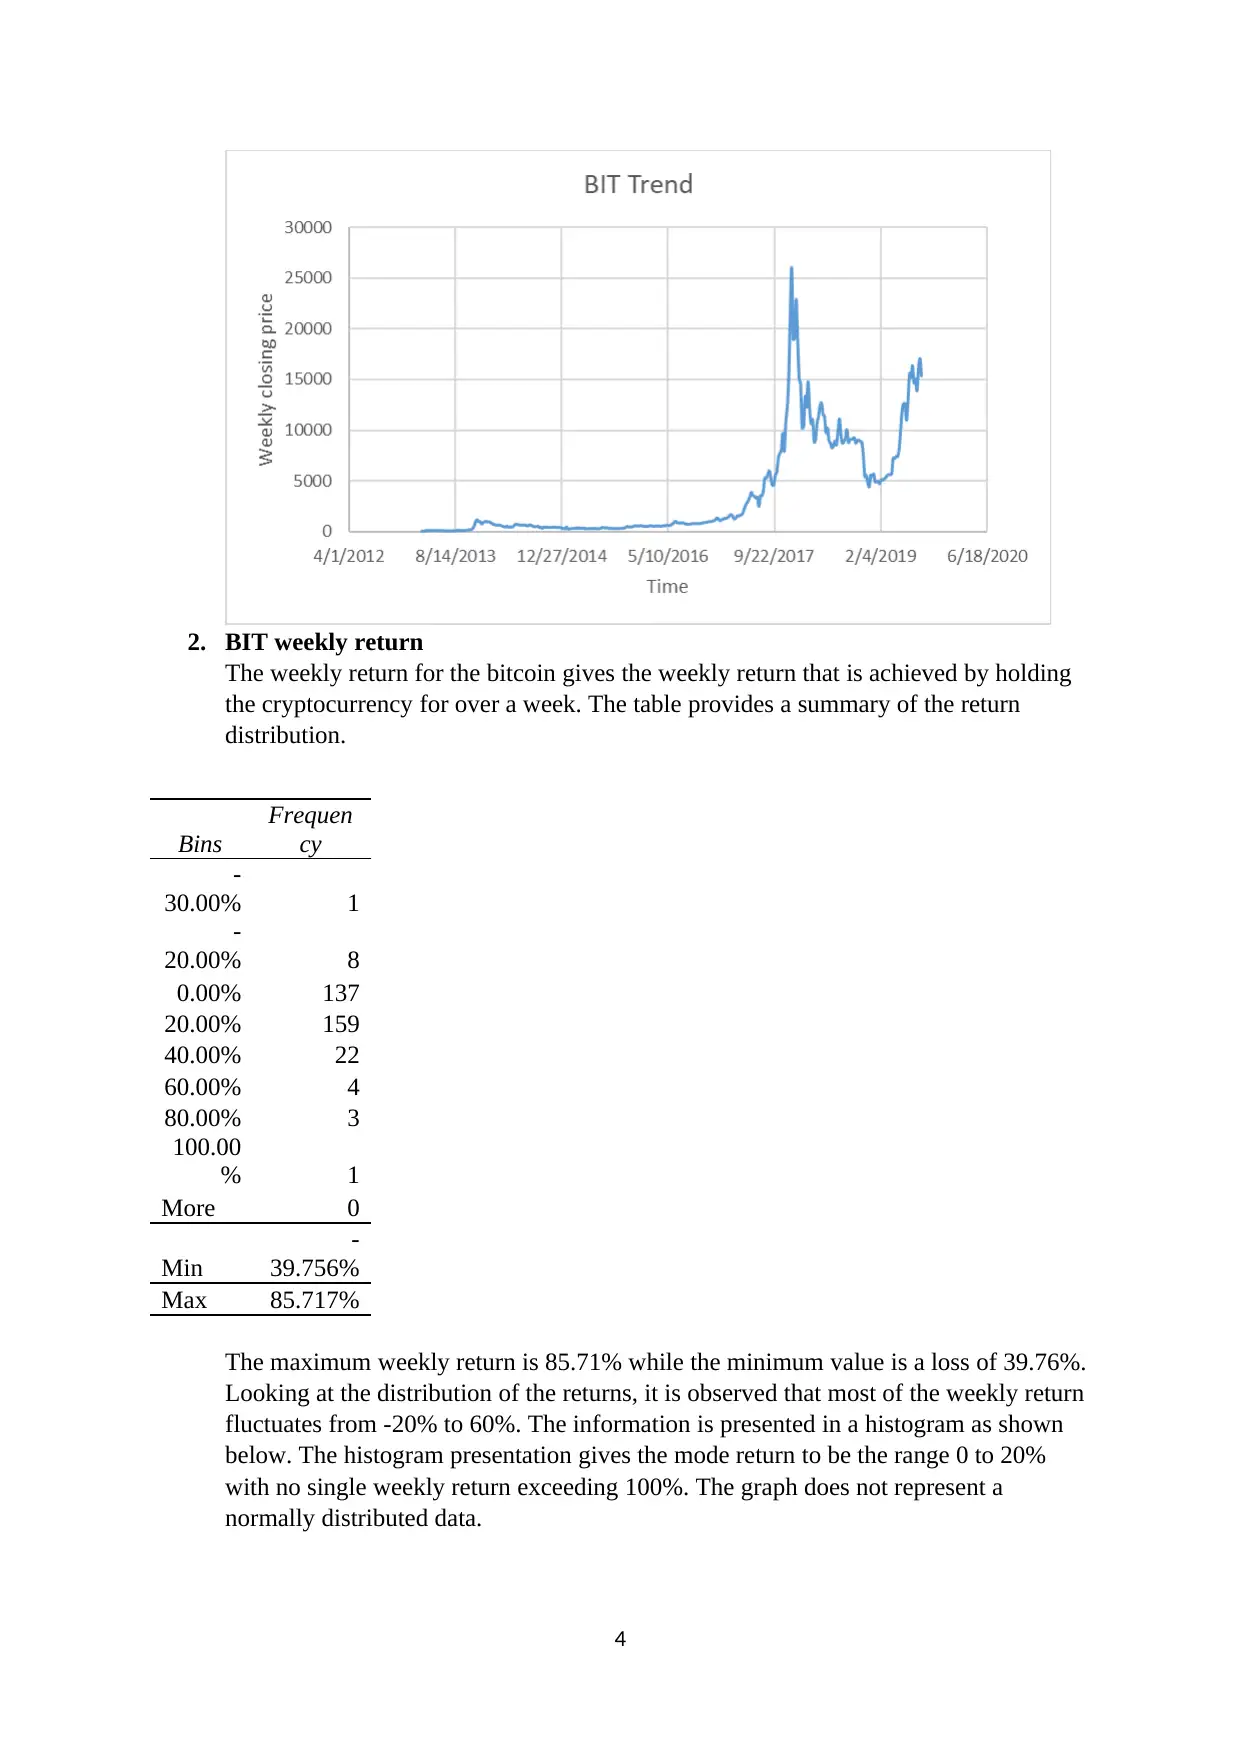
2. BIT weekly return
The weekly return for the bitcoin gives the weekly return that is achieved by holding
the cryptocurrency for over a week. The table provides a summary of the return
distribution.
Bins
Frequen
cy
-
30.00% 1
-
20.00% 8
0.00% 137
20.00% 159
40.00% 22
60.00% 4
80.00% 3
100.00
% 1
More 0
Min
-
39.756%
Max 85.717%
The maximum weekly return is 85.71% while the minimum value is a loss of 39.76%.
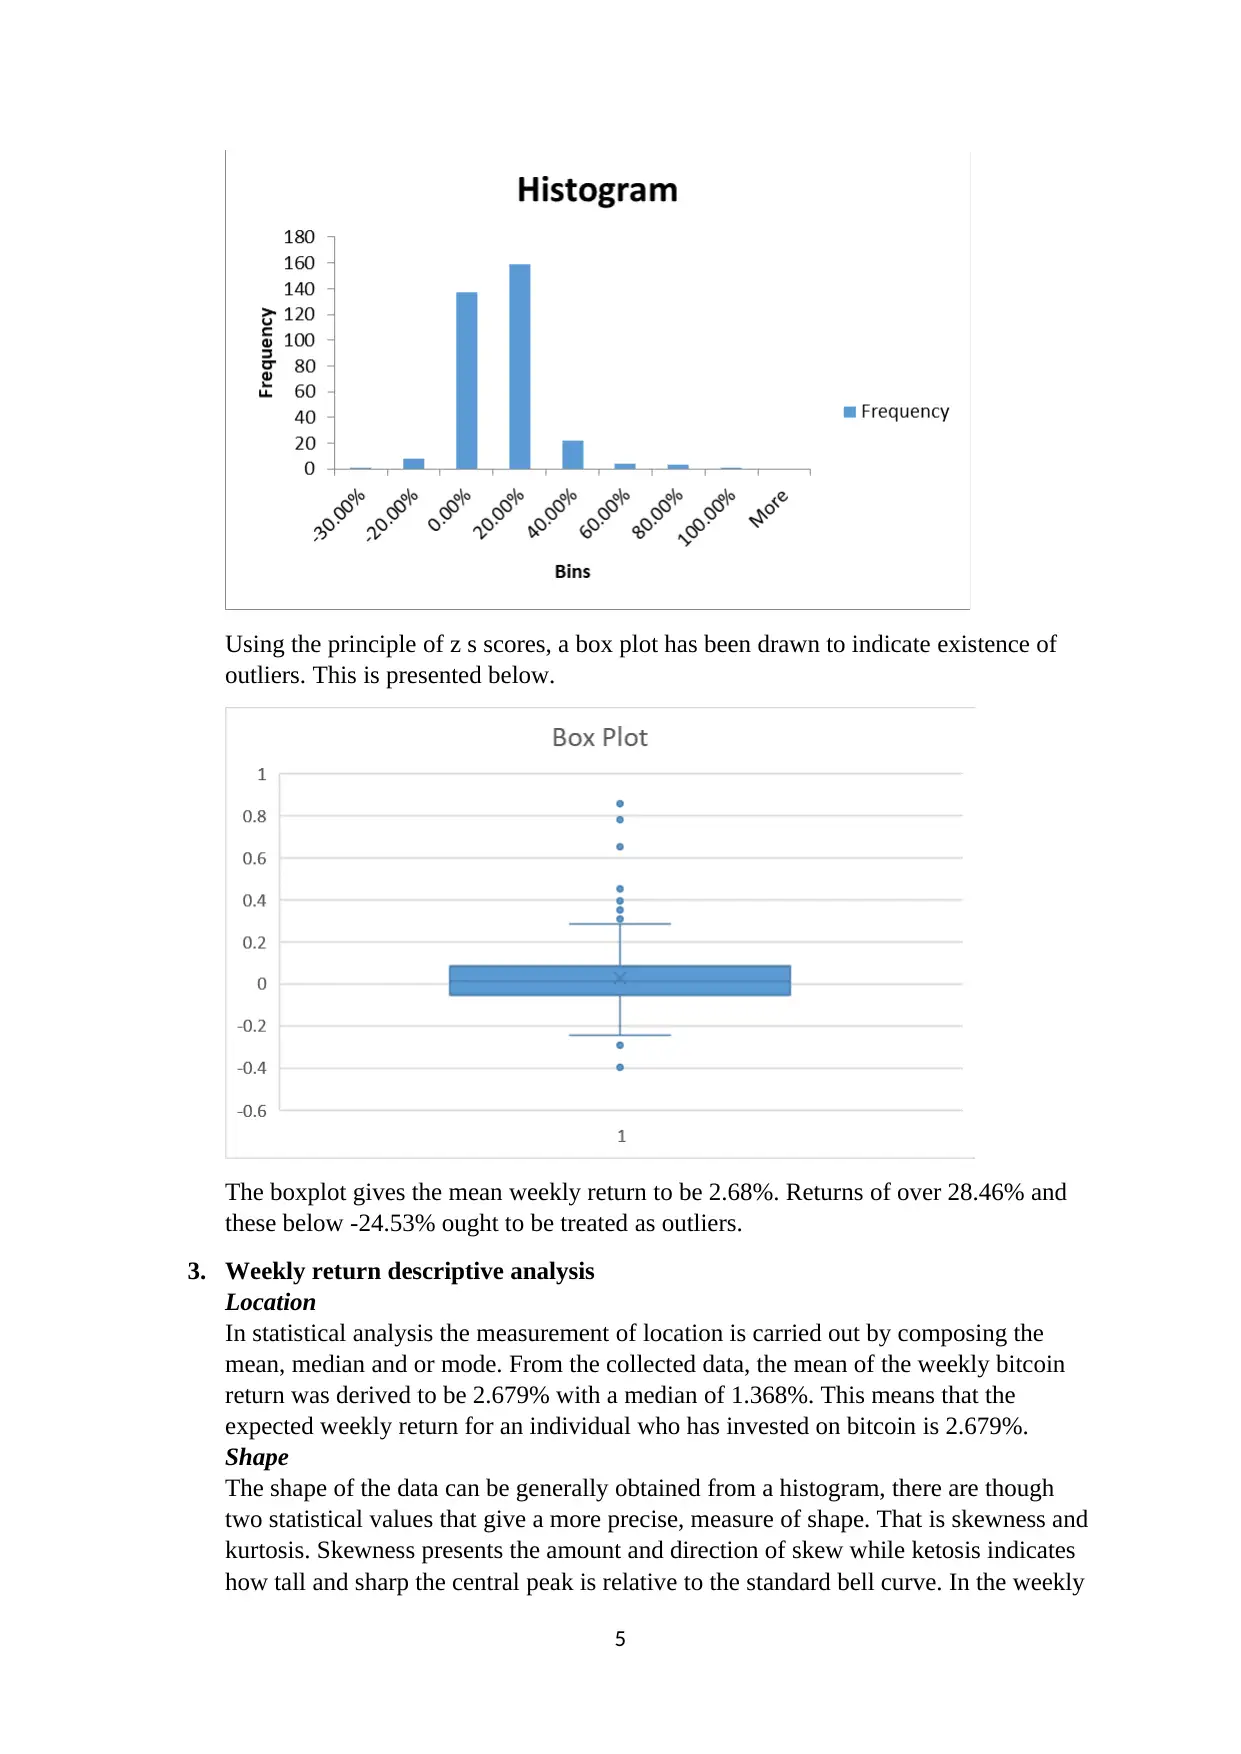
Looking at the distribution of the returns, it is observed that most of the weekly return
fluctuates from -20% to 60%. The information is presented in a histogram as shown
below. The histogram presentation gives the mode return to be the range 0 to 20%
with no single weekly return exceeding 100%. The graph does not represent a
normally distributed data.
4
The weekly return for the bitcoin gives the weekly return that is achieved by holding
the cryptocurrency for over a week. The table provides a summary of the return
distribution.
Bins
Frequen
cy
-
30.00% 1
-
20.00% 8
0.00% 137
20.00% 159
40.00% 22
60.00% 4
80.00% 3
100.00
% 1
More 0
Min
-
39.756%
Max 85.717%
The maximum weekly return is 85.71% while the minimum value is a loss of 39.76%.
Looking at the distribution of the returns, it is observed that most of the weekly return
fluctuates from -20% to 60%. The information is presented in a histogram as shown
below. The histogram presentation gives the mode return to be the range 0 to 20%
with no single weekly return exceeding 100%. The graph does not represent a
normally distributed data.
4
Paraphrase This Document
Need a fresh take? Get an instant paraphrase of this document with our AI Paraphraser
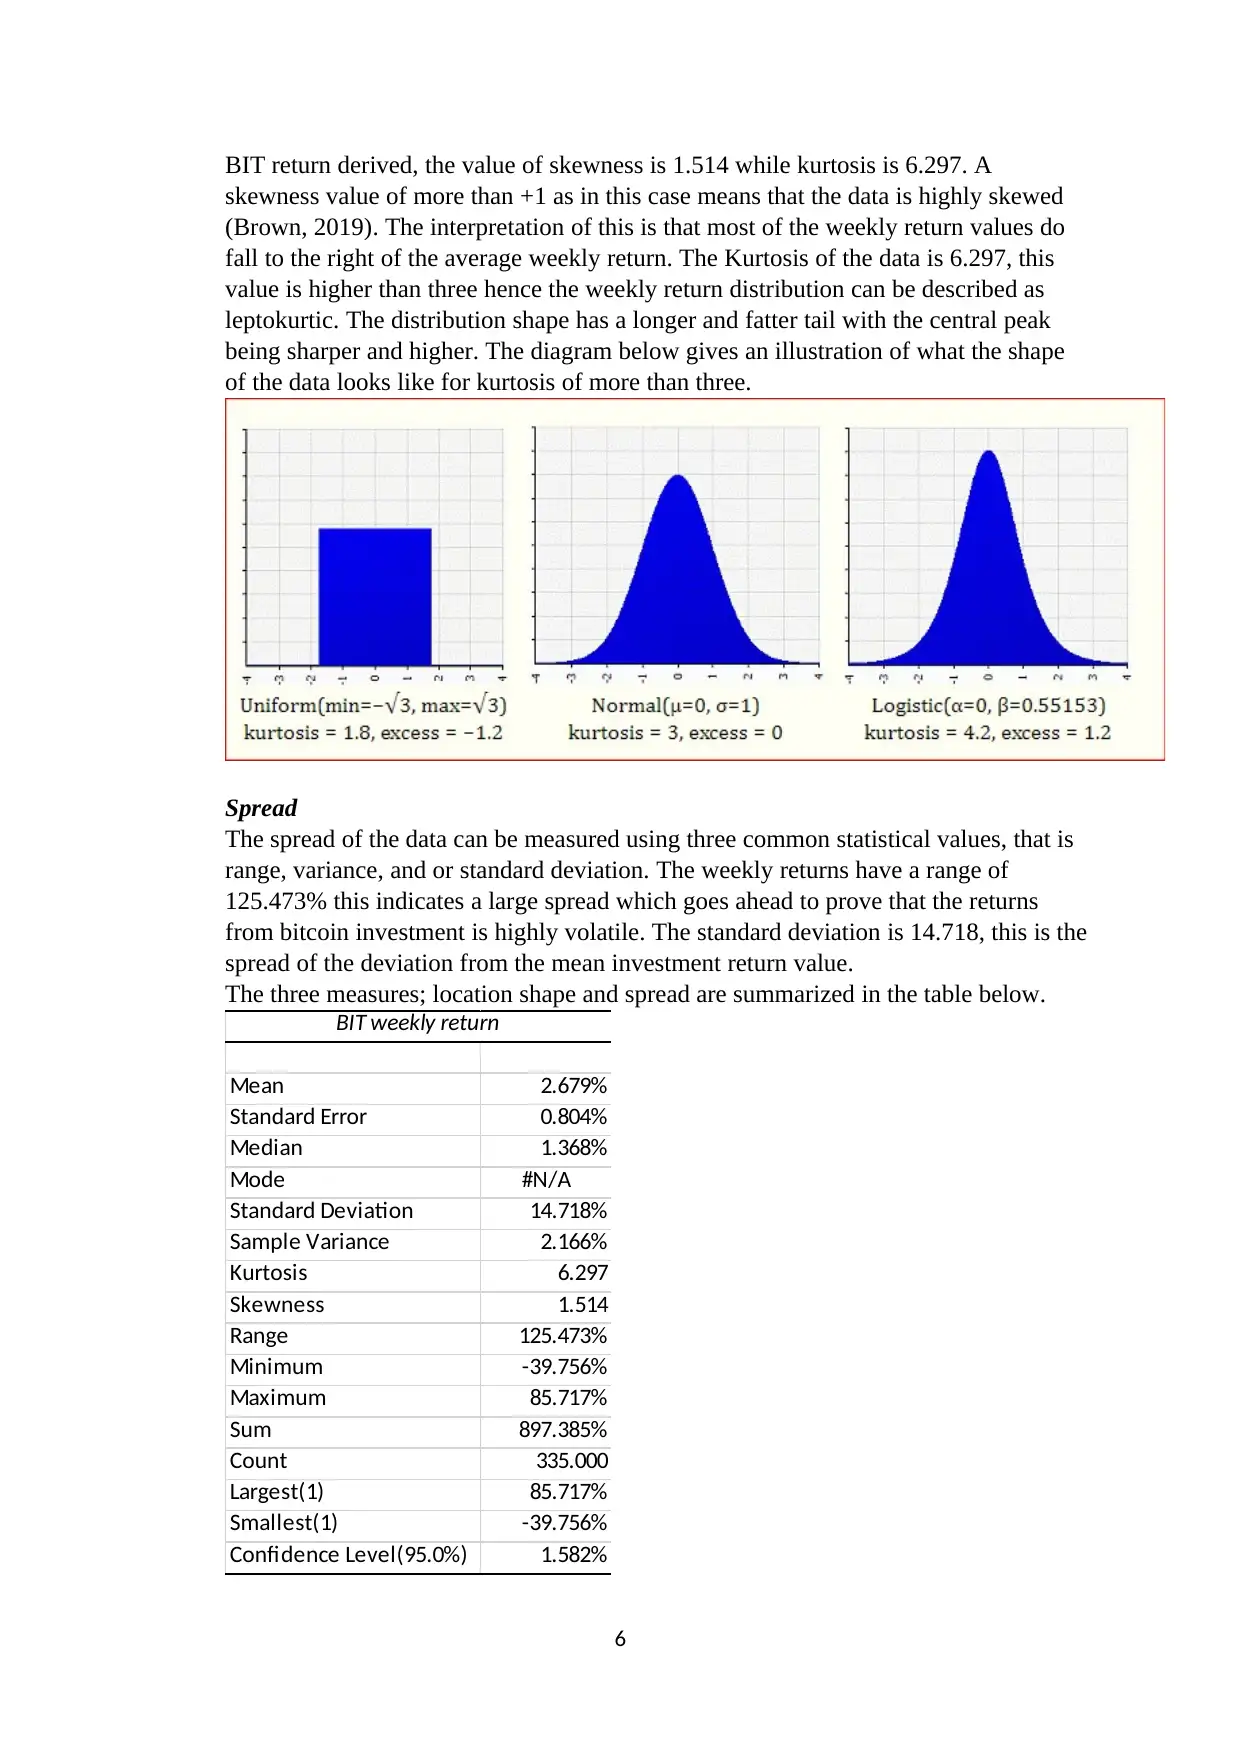
Using the principle of z s scores, a box plot has been drawn to indicate existence of
outliers. This is presented below.
The boxplot gives the mean weekly return to be 2.68%. Returns of over 28.46% and
these below -24.53% ought to be treated as outliers.
3. Weekly return descriptive analysis
Location
In statistical analysis the measurement of location is carried out by composing the
mean, median and or mode. From the collected data, the mean of the weekly bitcoin
return was derived to be 2.679% with a median of 1.368%. This means that the
expected weekly return for an individual who has invested on bitcoin is 2.679%.
Shape
The shape of the data can be generally obtained from a histogram, there are though
two statistical values that give a more precise, measure of shape. That is skewness and
kurtosis. Skewness presents the amount and direction of skew while ketosis indicates
how tall and sharp the central peak is relative to the standard bell curve. In the weekly
5
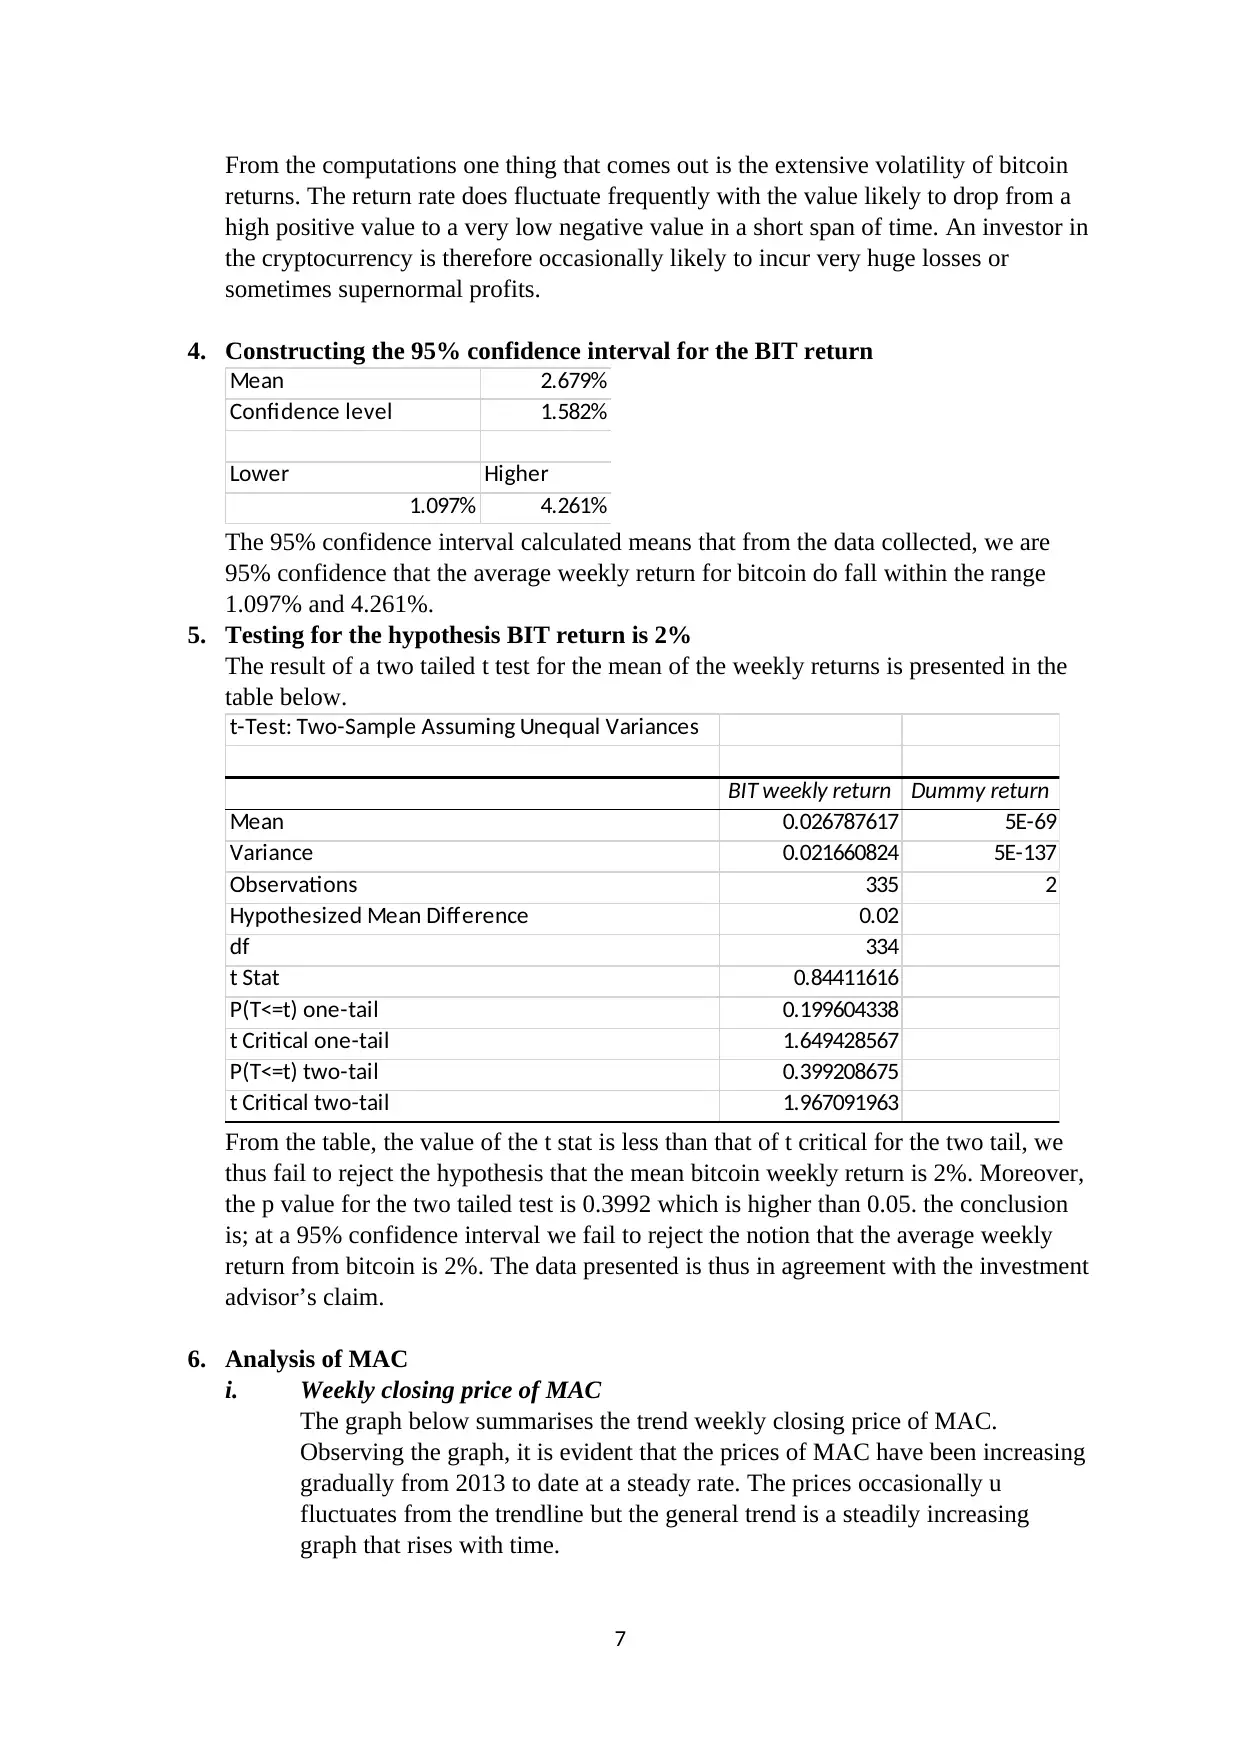
BIT return derived, the value of skewness is 1.514 while kurtosis is 6.297. A
skewness value of more than +1 as in this case means that the data is highly skewed
(Brown, 2019). The interpretation of this is that most of the weekly return values do
fall to the right of the average weekly return. The Kurtosis of the data is 6.297, this
value is higher than three hence the weekly return distribution can be described as
leptokurtic. The distribution shape has a longer and fatter tail with the central peak
being sharper and higher. The diagram below gives an illustration of what the shape
of the data looks like for kurtosis of more than three.
Spread
The spread of the data can be measured using three common statistical values, that is
range, variance, and or standard deviation. The weekly returns have a range of
125.473% this indicates a large spread which goes ahead to prove that the returns
from bitcoin investment is highly volatile. The standard deviation is 14.718, this is the
spread of the deviation from the mean investment return value.
The three measures; location shape and spread are summarized in the table below.
BIT weekly return
Mean 2.679%
Standard Error 0.804%
Median 1.368%
Mode #N/A
Standard Deviation 14.718%
Sample Variance 2.166%
Kurtosis 6.297
Skewness 1.514
Range 125.473%
Minimum -39.756%
Maximum 85.717%
Sum 897.385%
Count 335.000
Largest(1) 85.717%
Smallest(1) -39.756%
Confidence Level(95.0%) 1.582%
6
⊘ This is a preview!⊘
Do you want full access?
Subscribe today to unlock all pages.
Trusted by 1+ million students worldwide
From the computations one thing that comes out is the extensive volatility of bitcoin
returns. The return rate does fluctuate frequently with the value likely to drop from a
high positive value to a very low negative value in a short span of time. An investor in
the cryptocurrency is therefore occasionally likely to incur very huge losses or
sometimes supernormal profits.
4. Constructing the 95% confidence interval for the BIT return
Mean 2.679%
Confidence level 1.582%
Lower Higher
1.097% 4.261%
The 95% confidence interval calculated means that from the data collected, we are
95% confidence that the average weekly return for bitcoin do fall within the range
1.097% and 4.261%.
5. Testing for the hypothesis BIT return is 2%
The result of a two tailed t test for the mean of the weekly returns is presented in the
table below.
t-Test: Two-Sample Assuming Unequal Variances
BIT weekly return Dummy return
Mean 0.026787617 5E-69
Variance 0.021660824 5E-137
Observations 335 2
Hypothesized Mean Difference 0.02
df 334
t Stat 0.84411616
P(T<=t) one-tail 0.199604338
t Critical one-tail 1.649428567
P(T<=t) two-tail 0.399208675
t Critical two-tail 1.967091963
From the table, the value of the t stat is less than that of t critical for the two tail, we
thus fail to reject the hypothesis that the mean bitcoin weekly return is 2%. Moreover,
the p value for the two tailed test is 0.3992 which is higher than 0.05. the conclusion
is; at a 95% confidence interval we fail to reject the notion that the average weekly
return from bitcoin is 2%. The data presented is thus in agreement with the investment
advisor’s claim.
6. Analysis of MAC
i. Weekly closing price of MAC
The graph below summarises the trend weekly closing price of MAC.
Observing the graph, it is evident that the prices of MAC have been increasing
gradually from 2013 to date at a steady rate. The prices occasionally u
fluctuates from the trendline but the general trend is a steadily increasing
graph that rises with time.
7
Paraphrase This Document
Need a fresh take? Get an instant paraphrase of this document with our AI Paraphraser
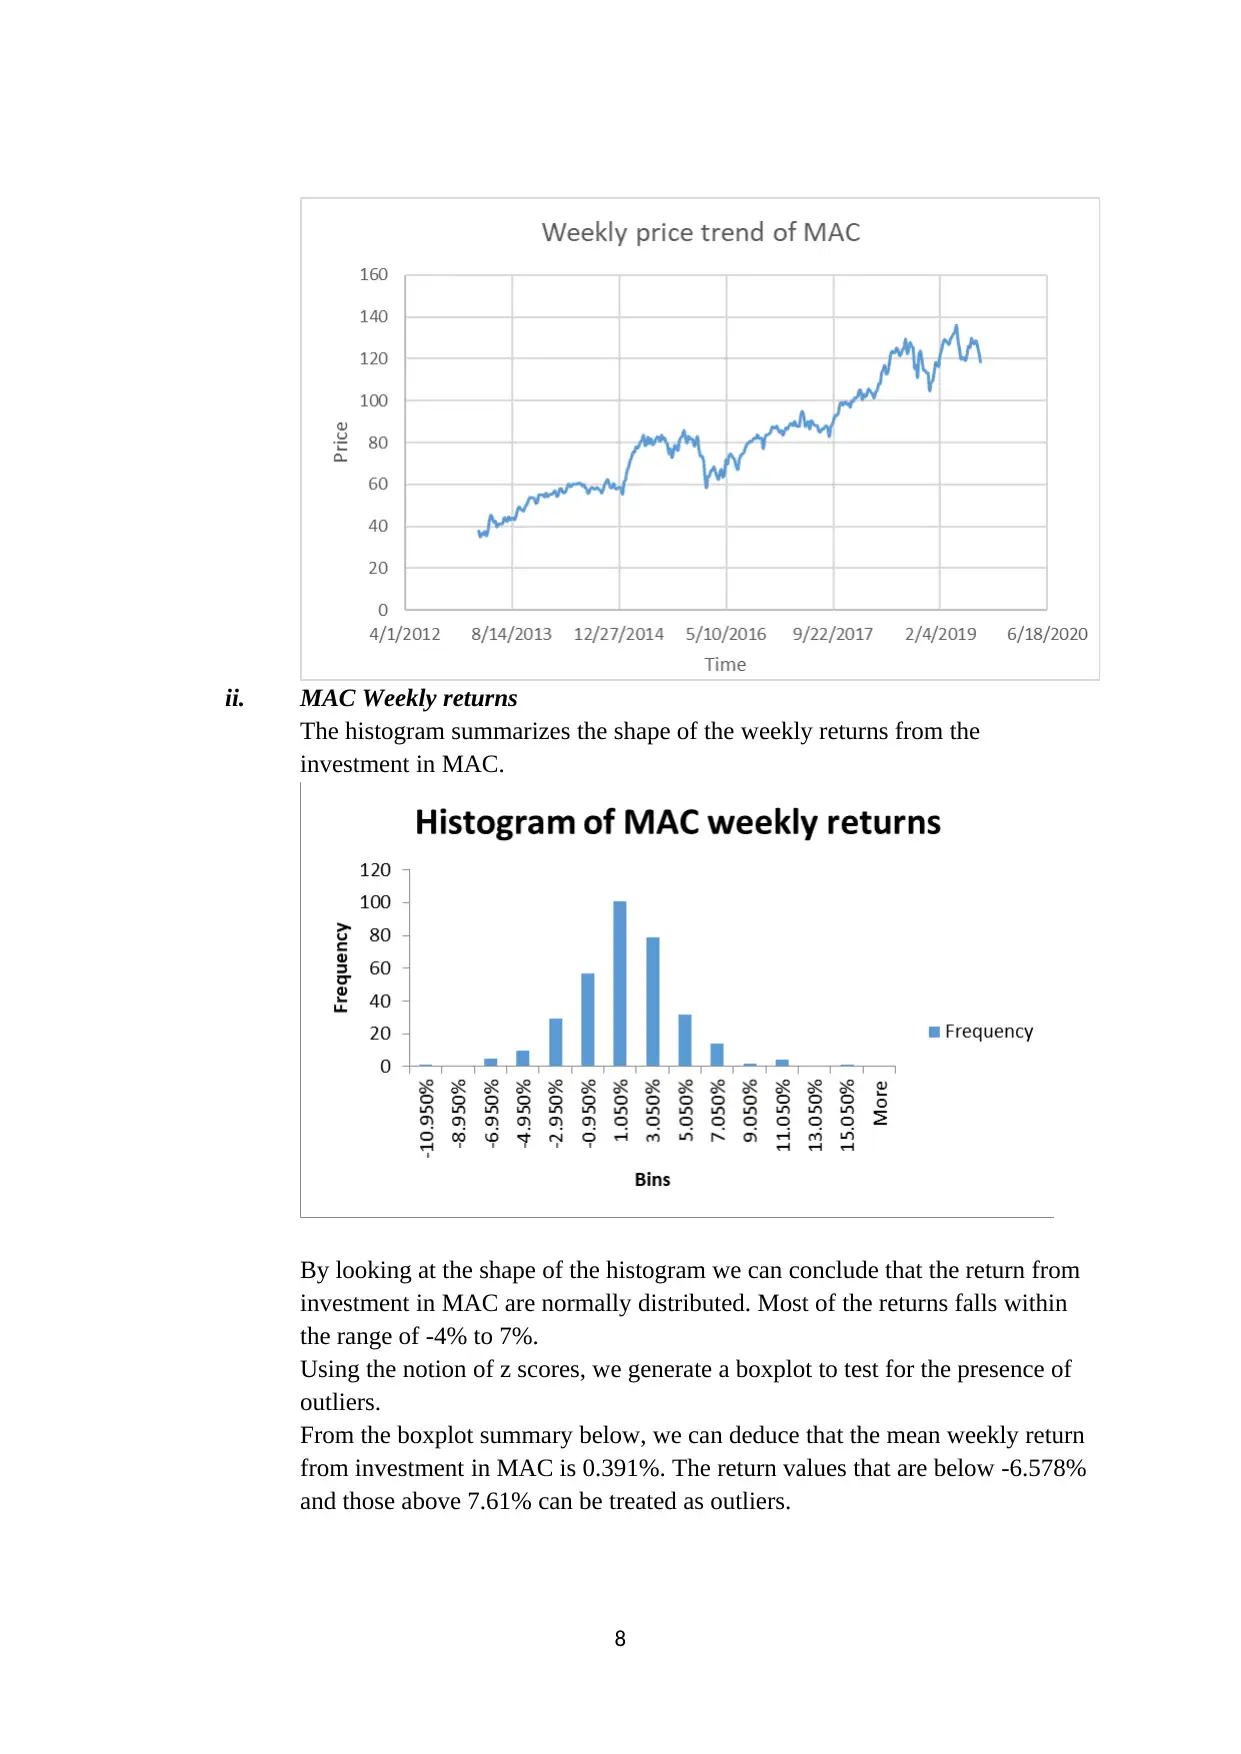
ii. MAC Weekly returns
The histogram summarizes the shape of the weekly returns from the
investment in MAC.
By looking at the shape of the histogram we can conclude that the return from
investment in MAC are normally distributed. Most of the returns falls within
the range of -4% to 7%.
Using the notion of z scores, we generate a boxplot to test for the presence of
outliers.
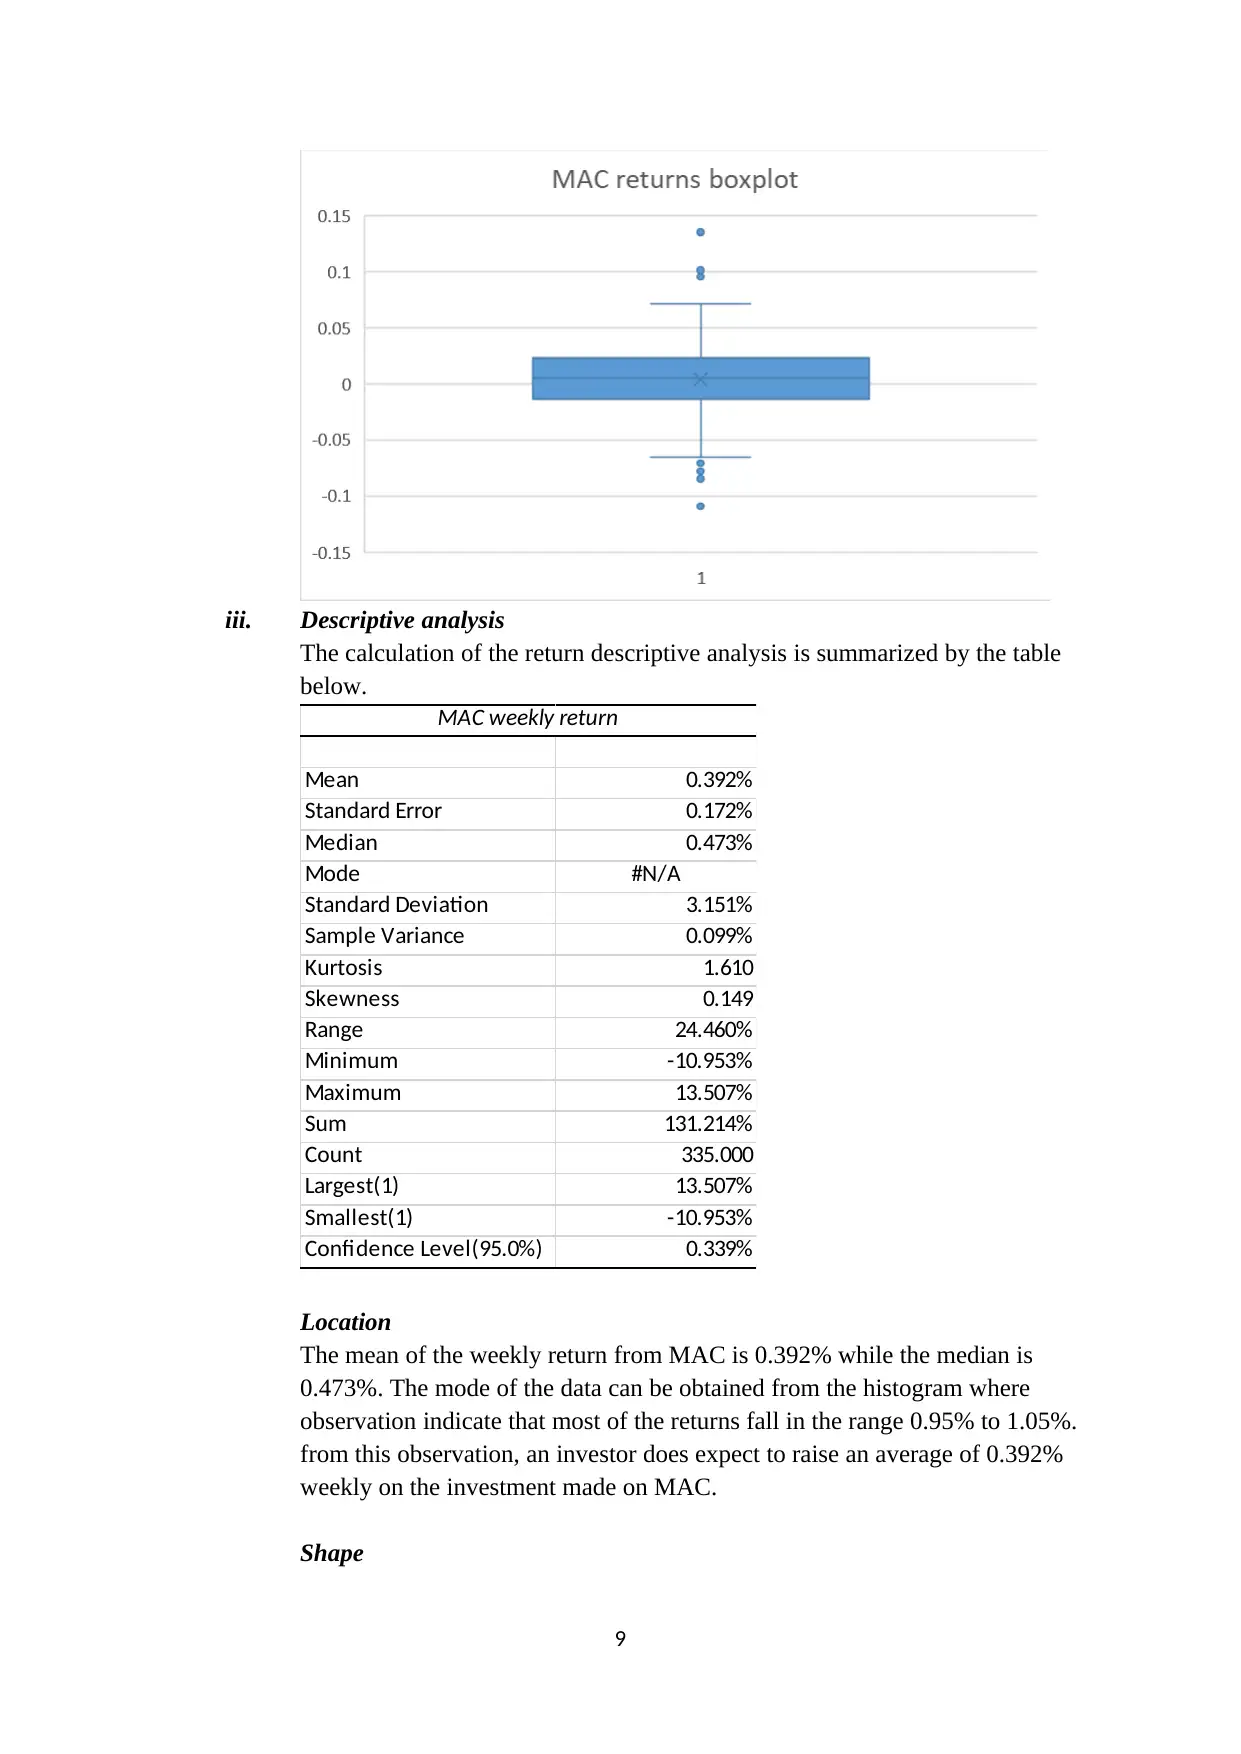
From the boxplot summary below, we can deduce that the mean weekly return
from investment in MAC is 0.391%. The return values that are below -6.578%
and those above 7.61% can be treated as outliers.
8
The histogram summarizes the shape of the weekly returns from the
investment in MAC.
By looking at the shape of the histogram we can conclude that the return from
investment in MAC are normally distributed. Most of the returns falls within
the range of -4% to 7%.
Using the notion of z scores, we generate a boxplot to test for the presence of
outliers.
From the boxplot summary below, we can deduce that the mean weekly return
from investment in MAC is 0.391%. The return values that are below -6.578%
and those above 7.61% can be treated as outliers.
8
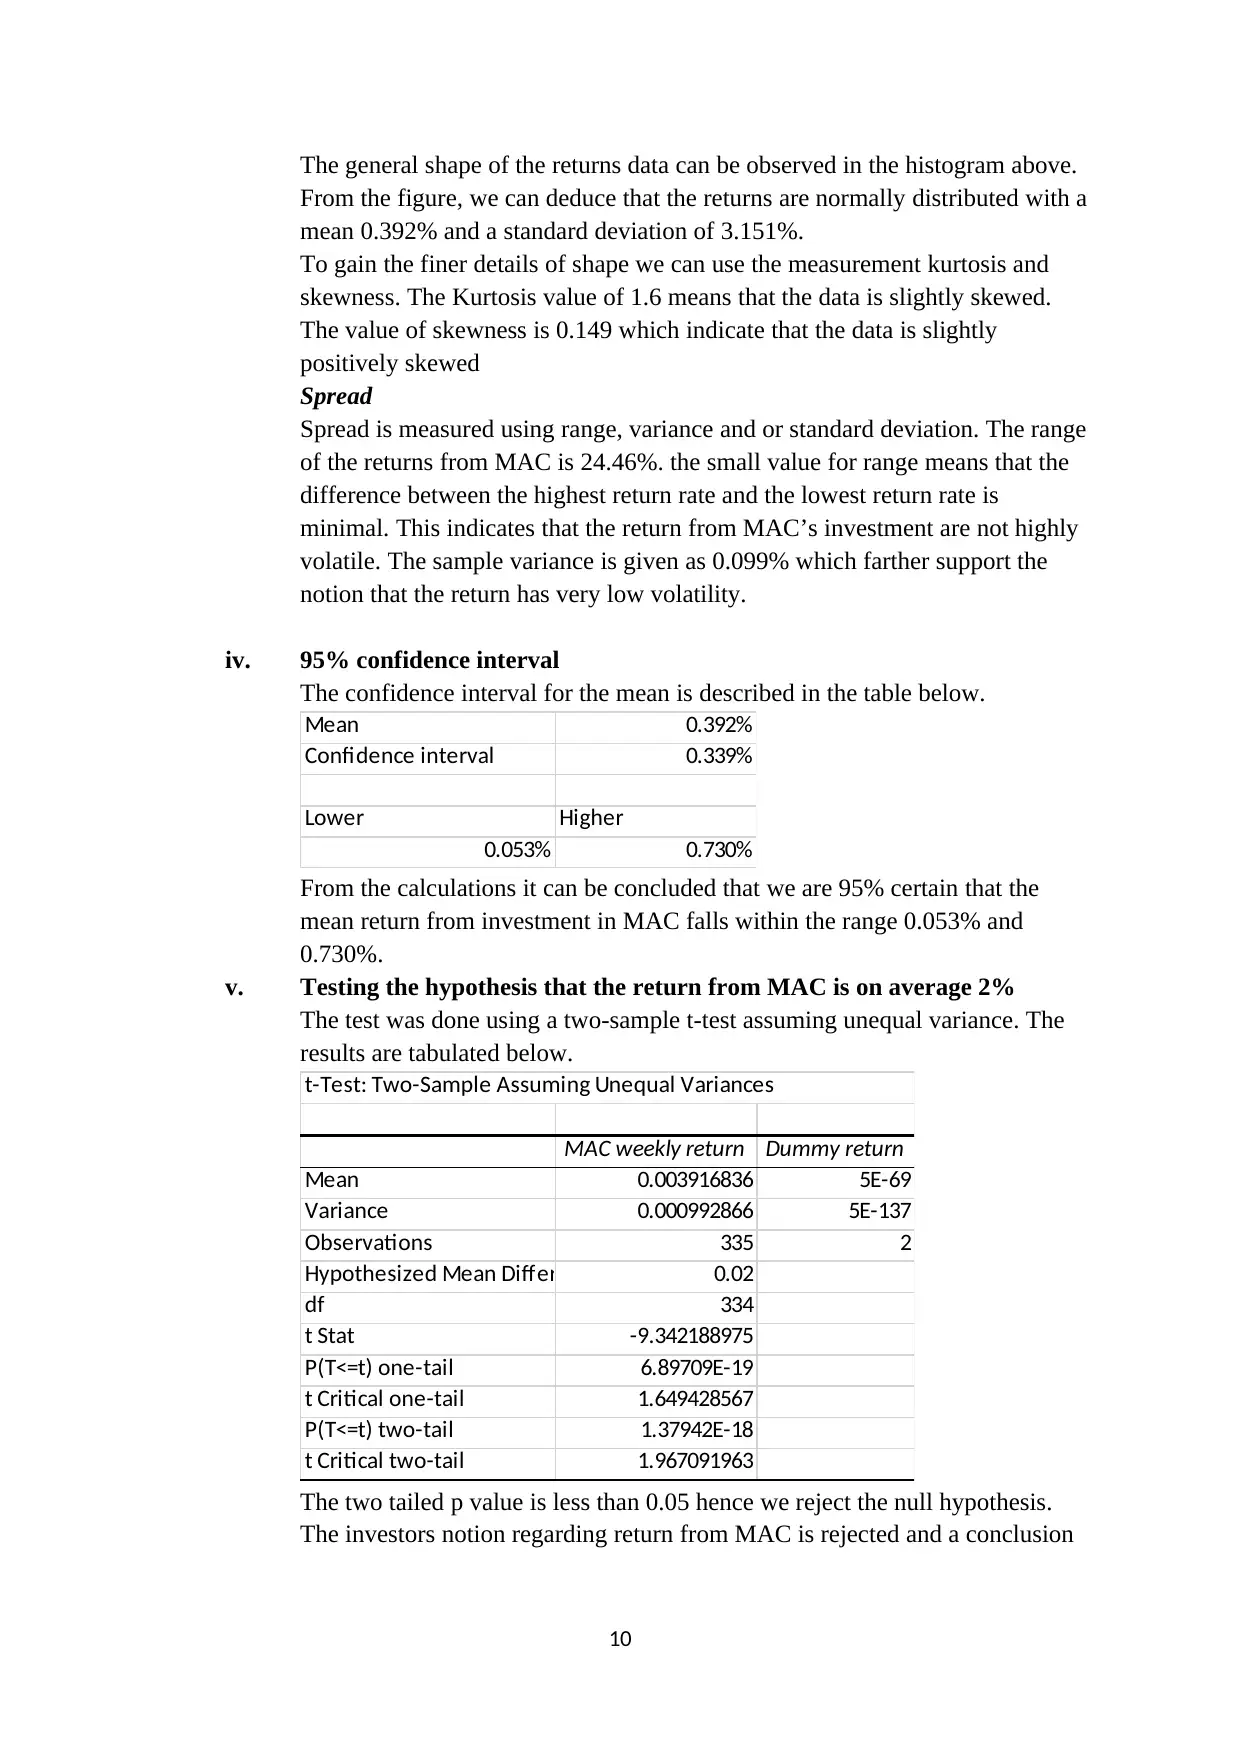
iii. Descriptive analysis
The calculation of the return descriptive analysis is summarized by the table
below.
MAC weekly return
Mean 0.392%
Standard Error 0.172%
Median 0.473%
Mode #N/A
Standard Deviation 3.151%
Sample Variance 0.099%
Kurtosis 1.610
Skewness 0.149
Range 24.460%
Minimum -10.953%
Maximum 13.507%
Sum 131.214%
Count 335.000
Largest(1) 13.507%
Smallest(1) -10.953%
Confidence Level(95.0%) 0.339%
Location
The mean of the weekly return from MAC is 0.392% while the median is
0.473%. The mode of the data can be obtained from the histogram where
observation indicate that most of the returns fall in the range 0.95% to 1.05%.
from this observation, an investor does expect to raise an average of 0.392%
weekly on the investment made on MAC.
Shape
9
⊘ This is a preview!⊘
Do you want full access?
Subscribe today to unlock all pages.
Trusted by 1+ million students worldwide
The general shape of the returns data can be observed in the histogram above.
From the figure, we can deduce that the returns are normally distributed with a
mean 0.392% and a standard deviation of 3.151%.
To gain the finer details of shape we can use the measurement kurtosis and
skewness. The Kurtosis value of 1.6 means that the data is slightly skewed.
The value of skewness is 0.149 which indicate that the data is slightly
positively skewed
Spread
Spread is measured using range, variance and or standard deviation. The range
of the returns from MAC is 24.46%. the small value for range means that the
difference between the highest return rate and the lowest return rate is
minimal. This indicates that the return from MAC’s investment are not highly
volatile. The sample variance is given as 0.099% which farther support the
notion that the return has very low volatility.
iv. 95% confidence interval
The confidence interval for the mean is described in the table below.
Mean 0.392%
Confidence interval 0.339%
Lower Higher
0.053% 0.730%
From the calculations it can be concluded that we are 95% certain that the
mean return from investment in MAC falls within the range 0.053% and
0.730%.
v. Testing the hypothesis that the return from MAC is on average 2%
The test was done using a two-sample t-test assuming unequal variance. The
results are tabulated below.
t-Test: Two-Sample Assuming Unequal Variances
MAC weekly return Dummy return
Mean 0.003916836 5E-69
Variance 0.000992866 5E-137
Observations 335 2
Hypothesized Mean Difference 0.02
df 334
t Stat -9.342188975
P(T<=t) one-tail 6.89709E-19
t Critical one-tail 1.649428567
P(T<=t) two-tail 1.37942E-18
t Critical two-tail 1.967091963
The two tailed p value is less than 0.05 hence we reject the null hypothesis.
The investors notion regarding return from MAC is rejected and a conclusion
10
Paraphrase This Document
Need a fresh take? Get an instant paraphrase of this document with our AI Paraphraser
made that, from the available sample data the average weekly return from
MAC investment is less than 2%.
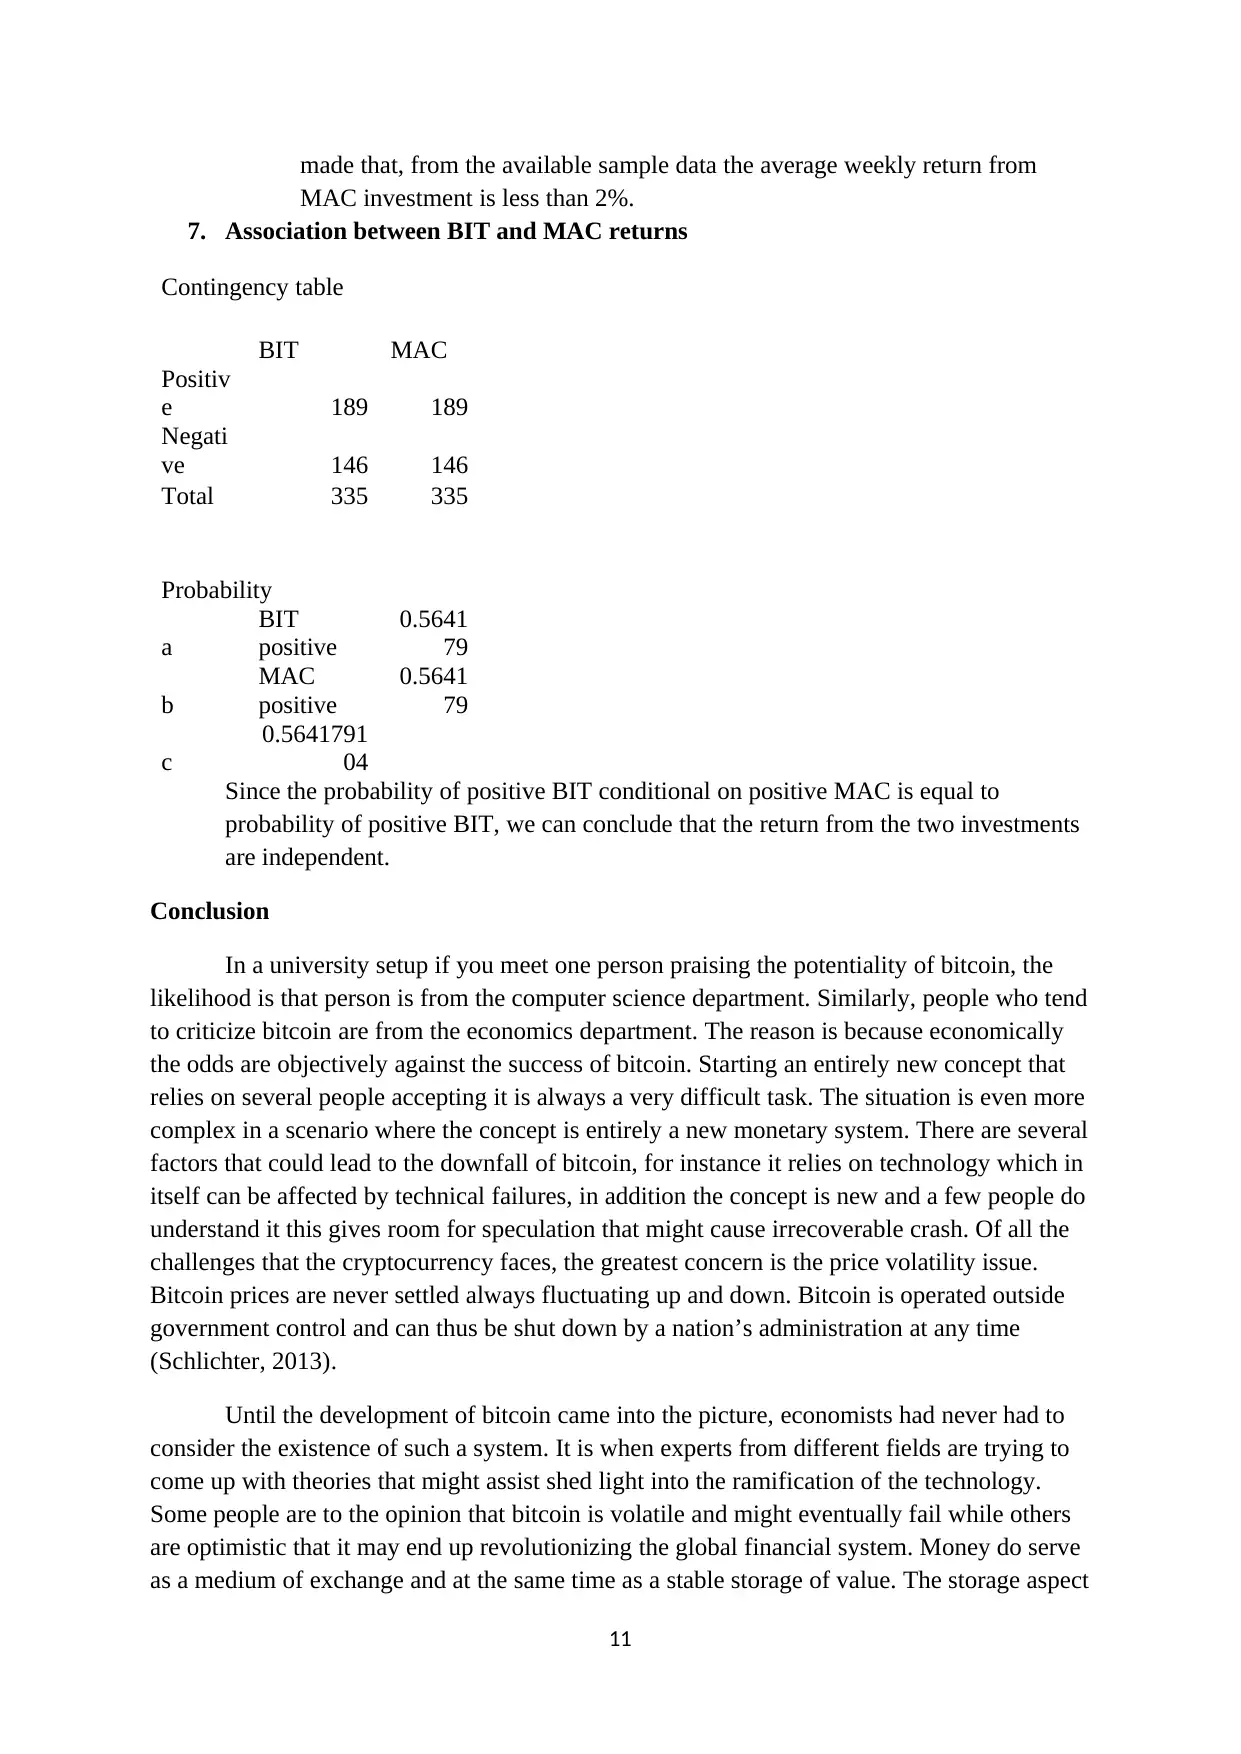
7. Association between BIT and MAC returns
Contingency table
BIT MAC
Positiv
e 189 189
Negati
ve 146 146
Total 335 335
Probability
a
BIT
positive
0.5641
79
b
MAC
positive
0.5641
79
c
0.5641791
04
Since the probability of positive BIT conditional on positive MAC is equal to
probability of positive BIT, we can conclude that the return from the two investments
are independent.
Conclusion
In a university setup if you meet one person praising the potentiality of bitcoin, the
likelihood is that person is from the computer science department. Similarly, people who tend
to criticize bitcoin are from the economics department. The reason is because economically
the odds are objectively against the success of bitcoin. Starting an entirely new concept that
relies on several people accepting it is always a very difficult task. The situation is even more
complex in a scenario where the concept is entirely a new monetary system. There are several
factors that could lead to the downfall of bitcoin, for instance it relies on technology which in
itself can be affected by technical failures, in addition the concept is new and a few people do
understand it this gives room for speculation that might cause irrecoverable crash. Of all the
challenges that the cryptocurrency faces, the greatest concern is the price volatility issue.
Bitcoin prices are never settled always fluctuating up and down. Bitcoin is operated outside
government control and can thus be shut down by a nation’s administration at any time
(Schlichter, 2013).
Until the development of bitcoin came into the picture, economists had never had to
consider the existence of such a system. It is when experts from different fields are trying to
come up with theories that might assist shed light into the ramification of the technology.
Some people are to the opinion that bitcoin is volatile and might eventually fail while others
are optimistic that it may end up revolutionizing the global financial system. Money do serve
as a medium of exchange and at the same time as a stable storage of value. The storage aspect
11
MAC investment is less than 2%.
7. Association between BIT and MAC returns
Contingency table
BIT MAC
Positiv
e 189 189
Negati
ve 146 146
Total 335 335
Probability
a
BIT
positive
0.5641
79
b
MAC
positive
0.5641
79
c
0.5641791
04
Since the probability of positive BIT conditional on positive MAC is equal to
probability of positive BIT, we can conclude that the return from the two investments
are independent.
Conclusion
In a university setup if you meet one person praising the potentiality of bitcoin, the
likelihood is that person is from the computer science department. Similarly, people who tend
to criticize bitcoin are from the economics department. The reason is because economically
the odds are objectively against the success of bitcoin. Starting an entirely new concept that
relies on several people accepting it is always a very difficult task. The situation is even more
complex in a scenario where the concept is entirely a new monetary system. There are several
factors that could lead to the downfall of bitcoin, for instance it relies on technology which in
itself can be affected by technical failures, in addition the concept is new and a few people do
understand it this gives room for speculation that might cause irrecoverable crash. Of all the
challenges that the cryptocurrency faces, the greatest concern is the price volatility issue.
Bitcoin prices are never settled always fluctuating up and down. Bitcoin is operated outside
government control and can thus be shut down by a nation’s administration at any time
(Schlichter, 2013).
Until the development of bitcoin came into the picture, economists had never had to
consider the existence of such a system. It is when experts from different fields are trying to
come up with theories that might assist shed light into the ramification of the technology.
Some people are to the opinion that bitcoin is volatile and might eventually fail while others
are optimistic that it may end up revolutionizing the global financial system. Money do serve
as a medium of exchange and at the same time as a stable storage of value. The storage aspect
11
is where bitcoin faces challenges (Leinwand, 2013). Money is often backed by central
authorities something that bitcoin do lack. This aspect makes the trust in cryptocurrency to be
a volatile factor.
In the analysis of the sampled data, one thing that comes out clear is the volatility in
the prices as well as the returns from bitcoin. Looking at the trendline of the bitcoin prices
from 2013 to date, there seems to have been a continuous price disruption which shows very
large fluctuations been experienced in certain periods. The returns from bitcoin are also not
normally distributed with the data range showing very huge fluctuations. Similar case cannot
be made of MAC. In the contrary, the returns from MAC are normally distributed with very
slight skewness and a kurtosis less than 3. Just like gold bitcoin don’t undergo decay and thus
can be an effective medium of exchange between two parties. For investors bitcoin should be
treated as a speculative option. Its lack of backing from government mean it can fail and
become worthless at any given moment. On the other hand, the cryptocurrency might
eventually take off and be worth hundreds or thousands of dollars. For risk taking investors,
bitcoin is the way to go. The investment option has the potentiality of yielding very high
returns with a higher probability of failure as well. On the other hand, MAC provides a stable
investment option that almost guarantees invertors a positive return. The only limitation of
MAC is the low return rates that only make it attractive for risk averse decision makers.
12
⊘ This is a preview!⊘
Do you want full access?
Subscribe today to unlock all pages.
Trusted by 1+ million students worldwide
1 out of 15
Related Documents


Your All-in-One AI-Powered Toolkit for Academic Success.
+13062052269
info@desklib.com
Available 24*7 on WhatsApp / Email
![[object Object]](/_next/static/media/star-bottom.7253800d.svg)
Unlock your academic potential
Copyright © 2020–2026 A2Z Services. All Rights Reserved. Developed and managed by ZUCOL.