ECON 1030 Project: Statistical Evaluation of Bitcoin Prices
VerifiedAdded on 2023/06/04
|12
|3857
|239
Project
AI Summary
This project, undertaken for ECON 1030, provides a statistical evaluation of Bitcoin prices compared to those of Singtel, Wilmar International, and Olam International. The analysis includes trend analysis using line graphs and descriptive statistical analysis of weekly returns. The project found that Bitcoin prices had an upward trend, outperforming the three Singaporean shares, which showed mixed or downward trends. Bitcoin's weekly returns were significantly higher, with a lower probability of loss compared to the other shares. The report recommends considering Bitcoin as an investment option despite its volatility, based on its superior returns. The project also incorporates a ministerial brief and an executive summary to outline the key findings, objectives, and methodologies employed in the analysis.

ECON 1030 – BUSINESS STATISTICS 1
PROJECT
Group Members
Please indicate using * who will be submitting the assignment in Canvas on the group’s
behalf.
First name Last name Student ID
Please indicate your tutor’s name and tutorial time:
Tutor name
Tutorial day and time
PROJECT
Group Members
Please indicate using * who will be submitting the assignment in Canvas on the group’s
behalf.
First name Last name Student ID
Please indicate your tutor’s name and tutorial time:
Tutor name
Tutorial day and time
Paraphrase This Document
Need a fresh take? Get an instant paraphrase of this document with our AI Paraphraser
Statistical Evaluation of Bitcoin Prices
Executive Summary
Globally, the popularity of blockchain and cryptocurrencies has exponentially risen
in the recent past. Hence, the growing interest for Bitcoin as an alternative investment class
and medium of exchange. There is a lot of uncertainty that is associated with Bitcoin, which
make many individuals wary of investing in it. Amid or the controversies and uncertainty, the
recent prices of Bitcoin provide factual evidence for evaluating whether investing in Bitcoin
is advisable or not. We obtained recent weekly closing price for Bitcoin and three other
Singaporean shares; Singtel, Wilmer International, and Olam International. The evaluations
involved a trend analysis of the weekly closing prices of Bitcoin and the three shares, and
descriptive tactical analysis of weekly returns to Bitcoin and the three shares.
The results indicated that recent prices of Bitcoin had an upward trend, while those of
Singtel shares had a downward trend. The prices of Wilmar International followed a
nonsignificant upward trend, while those of Olam international largely remains constant with
no apparent general upward or downward trend. The analysis of returns to Bitcoin resulted to
a high mean weekly return of 2.05% which outperforms the other three shares whose returns
were close to 0.00%. Additionally, as an investment, the probability of a loss in Bitcoin is
much lower than the probability of a loss in the other three shares. Despite the price volatility
of Bitcoin, we would recommend that individual consider it as an investment option because
it has higher returns than investing in company shares.
Introduction
In the current world, it is becoming more and more common to come across the terms
blockchain, cryptocurrency, and Bitcoin. Interestingly, blockchain technology has been
existence for decades. However, combining blockchain technology and peer-to-peer (P2P)
networks has propelled the technology to new heights. The internet makes it more accessible
to many people globally. Hence, the great innovations using such as cryptography and
distributed computing in various industries. In finance, the exponential growth of
cryptocurrencies has garnered global attention. Cryptocurrencies are considered a medium of
exchange and store of value like any other currencies and assets. Cryptocurrency and
blockchain technology are terms used interchangeably because one would not exist without
the other. The first successful implementation of blockchain and cryptocurrency was Bitcoin
hence its popularity worldwide. Bitcoin uses the technology that allows participants to send
accounting units from one user account to another user account without intermediaries. The
popularity of Bitcoin as a medium of exchange and store of value is growing exponentially
because individuals can transact any amount at anytime of day in any place in the world. It is
important to note that Bitcoin are not physical or digital coins. Instead, Bitcoin is a chain of
electronic signatures that represent units on a digital ledger. From an investment perspective,
Bitcoin is compared to gold because both are limited in supply, have functional use and are
considered by many to be good stores of value. In comparison, Bitcoin greatly outperformed
gold in terms on annualize returns for the past few years, thus attracting the attention of
investors as an alternative asset class. However, there are many risks associated with Bitcoin
compared to gold. There is great uncertainty associated with Bitcoin which is reflected in its
price volatility. Additionally, Bitcoin is unregulated as an alternative currency and investment
asset class.
1
In this report we statistically evaluate whether individuals should invest in Bitcoin
based on its recent prices. The report is divided into various section. First, the executive
summary which gives a clear overview of the information in the report. Next is the
introduction which gives an extensive background of the problem. Part A of the report
comprises of the detailed statistical analysis of the prices of and returns to Bitcoin and three
Singaporean shares; Singtel, Wilmer International, and Olam International. Lastly, we
provide a ministerial brief. The objectives of this report are to:
Outline the new investment frontier that is cryptocurrencies, and in particular Bitcoin.
Statistically evaluate the recent prices of Bitcoin
Compare the returns to Bitcoin and other shares
To achieve the objectives, we obtained weekly closing prices of Bitcoin, Singtel, Wilmer
International, and Olam International. We then calculated the weekly returns to Bitcoin and
the other three shares using the formula: (Current Price – Previous price)/Previous price
*100. Then, we analyzed the trend of the prices using line graphs, and a descriptive analysis
of the histogram for the weekly returns was also carried out. Using the probability theory, we
found out the empirical probability of a loss in investing in Bitcoin and the other three shares.
Lastly, we find use hypothesis testing to evaluate the claim of an investment advisor that the
return to Bitcoin is 4% while the returns to the other three shares are no different from zero.
Part A
Bitcoin Analysis
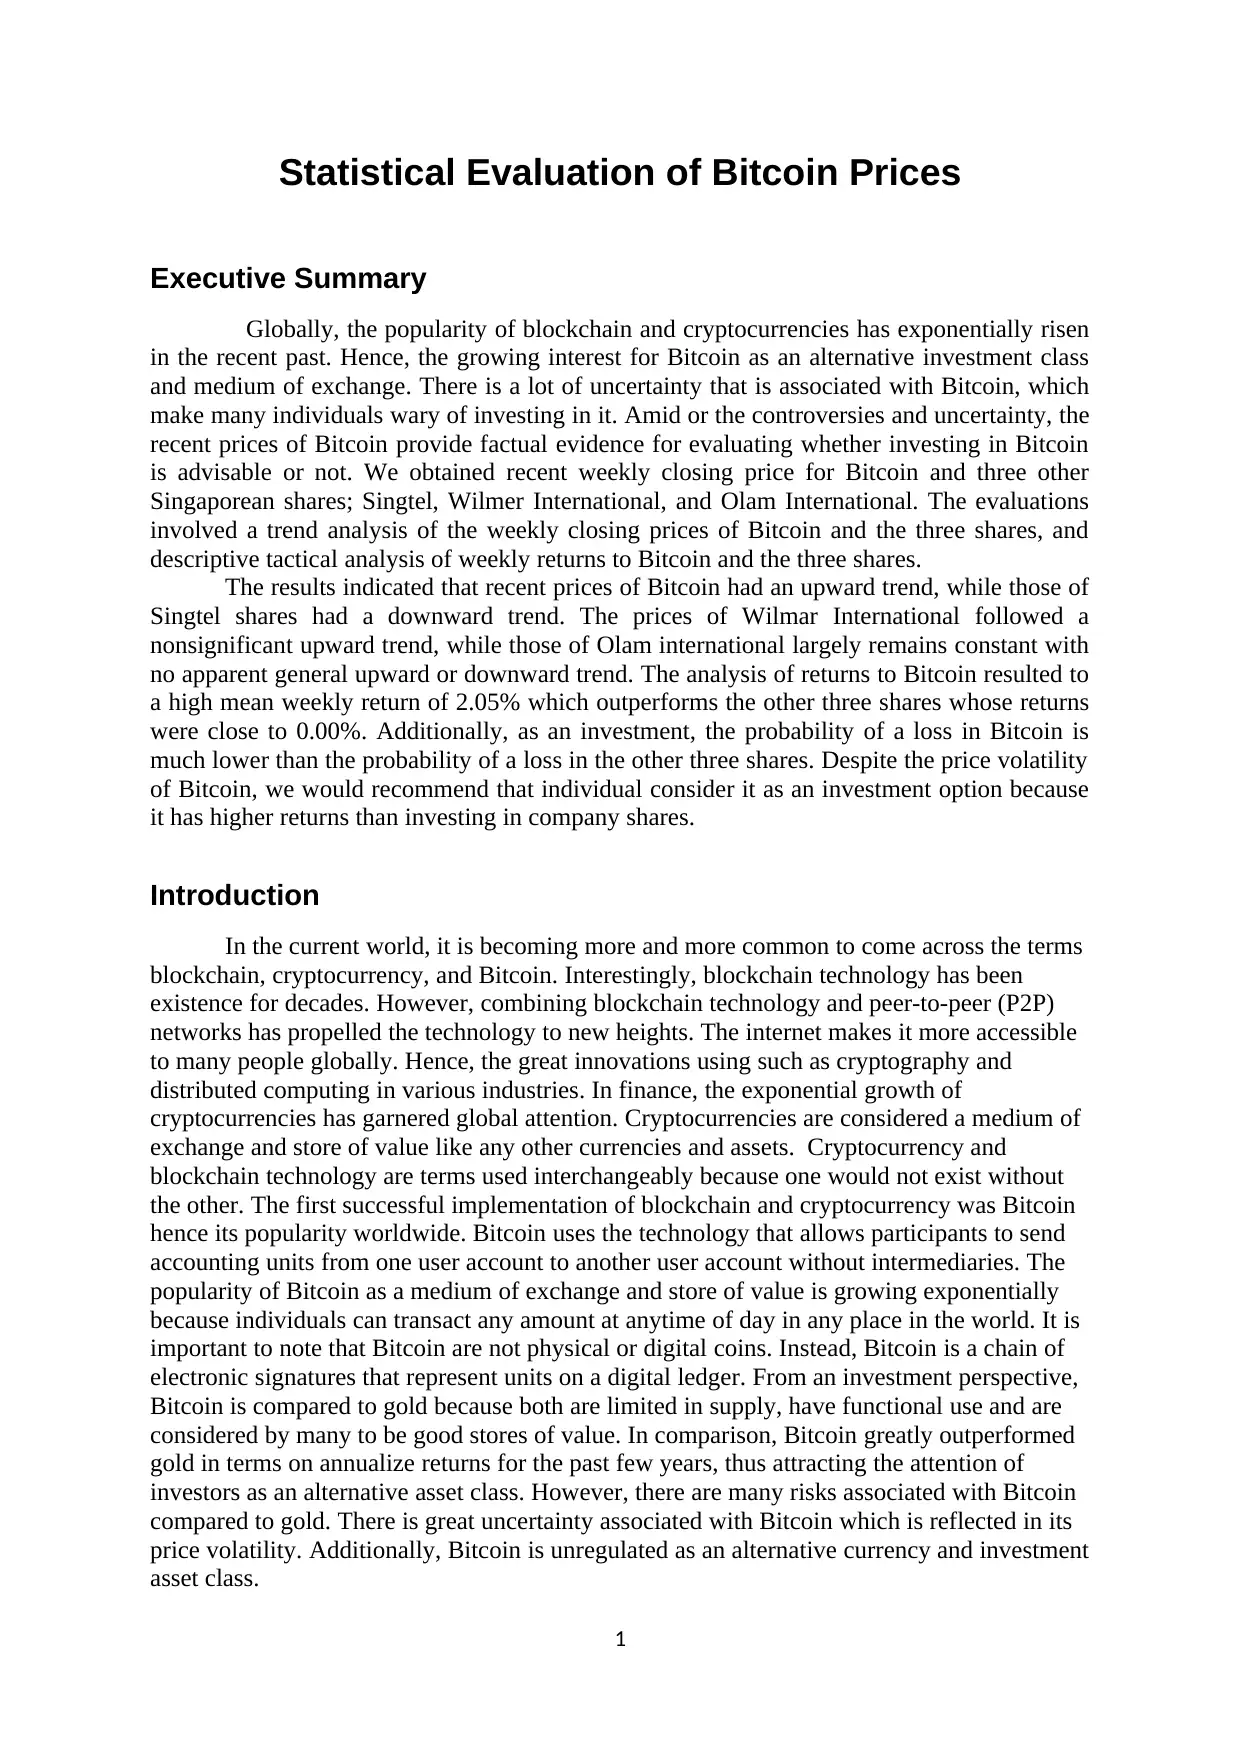
We used a line graph to present the weekly closing price of the Bitcoin. The line
graph indicated a general upward trend in the closing price of the Bitcoin over the period
under consideration. The change in weekly closing price was minimal between 2014 and
2016. However, there is a sharp rise in the weekly closing price in the year 2017, with sharp
increase in the last weeks of the year. The sharp increase is followed by similar sharp
decrease in the first week of 2018. The graph indicates that the weekly closing price have
been fluctuating a lot in 2018.
6/15/2014
8/8/2014
10/1/2014
11/24/2014
1/17/2015
3/12/2015
5/5/2015
6/28/2015
8/21/2015
10/14/2015
12/7/2015
1/30/2016
3/24/2016
5/17/2016
7/10/2016
9/2/2016
10/26/2016
12/19/2016
2/11/2017
4/6/2017
5/30/2017
7/23/2017
9/15/2017
11/8/2017
1/1/2018
2/24/2018
4/19/2018
0.00
2500.00
5000.00
7500.00
10000.00
12500.00
15000.00
17500.00
20000.00
22500.00
25000.00
27500.00
BIT
Date
Weekly Closing Price
Figure 1: A Line Graph of Weekly Closing Price of Bitcoin
2
based on its recent prices. The report is divided into various section. First, the executive
summary which gives a clear overview of the information in the report. Next is the
introduction which gives an extensive background of the problem. Part A of the report
comprises of the detailed statistical analysis of the prices of and returns to Bitcoin and three
Singaporean shares; Singtel, Wilmer International, and Olam International. Lastly, we
provide a ministerial brief. The objectives of this report are to:
Outline the new investment frontier that is cryptocurrencies, and in particular Bitcoin.
Statistically evaluate the recent prices of Bitcoin
Compare the returns to Bitcoin and other shares
To achieve the objectives, we obtained weekly closing prices of Bitcoin, Singtel, Wilmer
International, and Olam International. We then calculated the weekly returns to Bitcoin and
the other three shares using the formula: (Current Price – Previous price)/Previous price
*100. Then, we analyzed the trend of the prices using line graphs, and a descriptive analysis
of the histogram for the weekly returns was also carried out. Using the probability theory, we
found out the empirical probability of a loss in investing in Bitcoin and the other three shares.
Lastly, we find use hypothesis testing to evaluate the claim of an investment advisor that the
return to Bitcoin is 4% while the returns to the other three shares are no different from zero.
Part A
Bitcoin Analysis
We used a line graph to present the weekly closing price of the Bitcoin. The line
graph indicated a general upward trend in the closing price of the Bitcoin over the period
under consideration. The change in weekly closing price was minimal between 2014 and
2016. However, there is a sharp rise in the weekly closing price in the year 2017, with sharp
increase in the last weeks of the year. The sharp increase is followed by similar sharp
decrease in the first week of 2018. The graph indicates that the weekly closing price have
been fluctuating a lot in 2018.
6/15/2014
8/8/2014
10/1/2014
11/24/2014
1/17/2015
3/12/2015
5/5/2015
6/28/2015
8/21/2015
10/14/2015
12/7/2015
1/30/2016
3/24/2016
5/17/2016
7/10/2016
9/2/2016
10/26/2016
12/19/2016
2/11/2017
4/6/2017
5/30/2017
7/23/2017
9/15/2017
11/8/2017
1/1/2018
2/24/2018
4/19/2018
0.00
2500.00
5000.00
7500.00
10000.00
12500.00
15000.00
17500.00
20000.00
22500.00
25000.00
27500.00
BIT
Date
Weekly Closing Price
Figure 1: A Line Graph of Weekly Closing Price of Bitcoin
2
⊘ This is a preview!⊘
Do you want full access?
Subscribe today to unlock all pages.
Trusted by 1+ million students worldwide
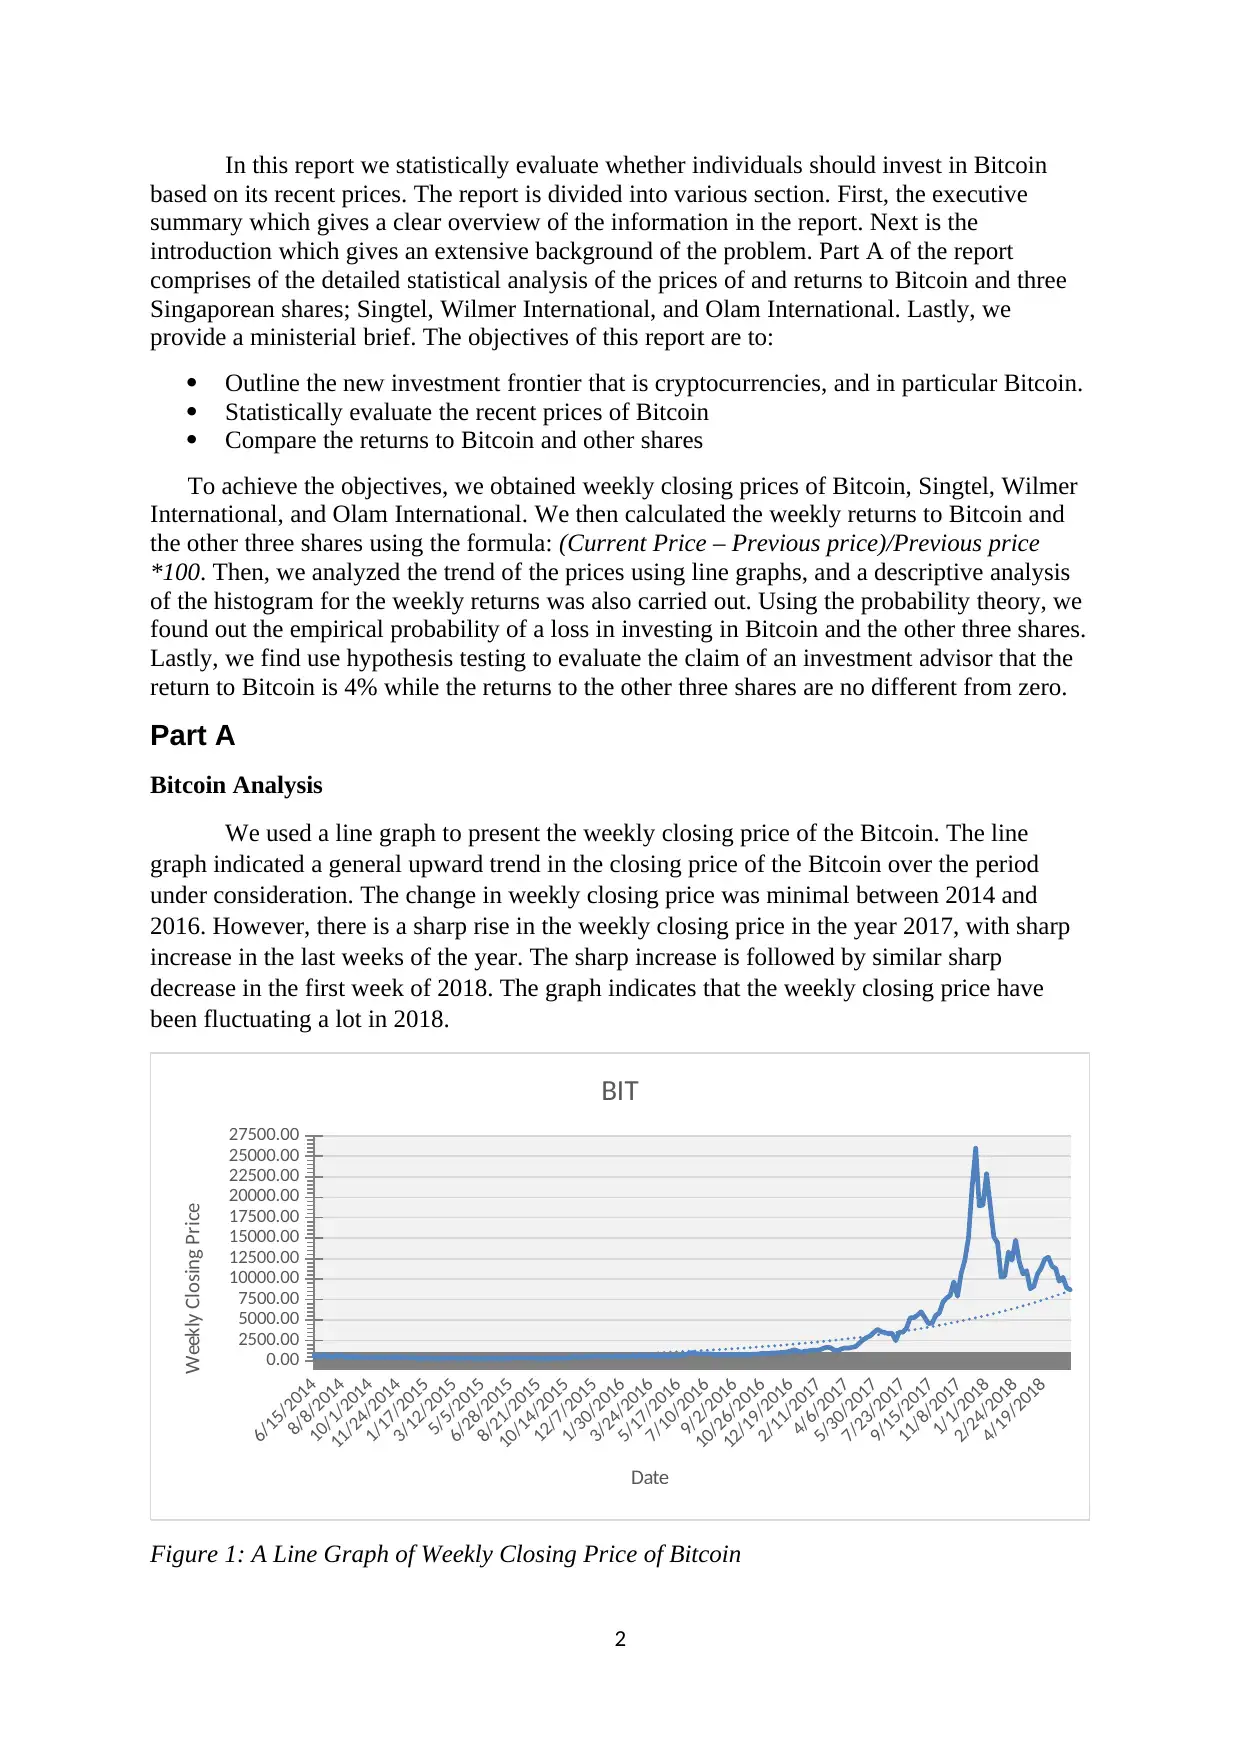
We calculated the weekly return of Bitcoin. The resulting histogram indicate that the
data could be normally distributed. On the right-hand side, there is evidence of outliers.
Figure 2: Histogram of Weekly Returns of Bitcoin
The shape of the histogram indicates that the distribution of weekly return of Bitcoin
is approximately symmetrical with few outliers. The descriptive statistics results to skewness
value of 0.614, which indicates that the data is relatively right-skewed. Moreover, the mean,
2.05% is greater than the median, 1.43% which indicates positive skewness. The center of
distribution, as measured by the median, lies at 1.43%. The spread of distribution, as
measured by the range is 105.44% (65.68% - -39.76%). Most Bitcoin weekly returns are
located around the mean (2.05%).
The empirical probability of a loss is calculated as:
P(L) = Number of times loss in weekly return/ Total number of weekly returns
= 89/ 208 = 0.4279 = 42.79%
Singtel Analysis
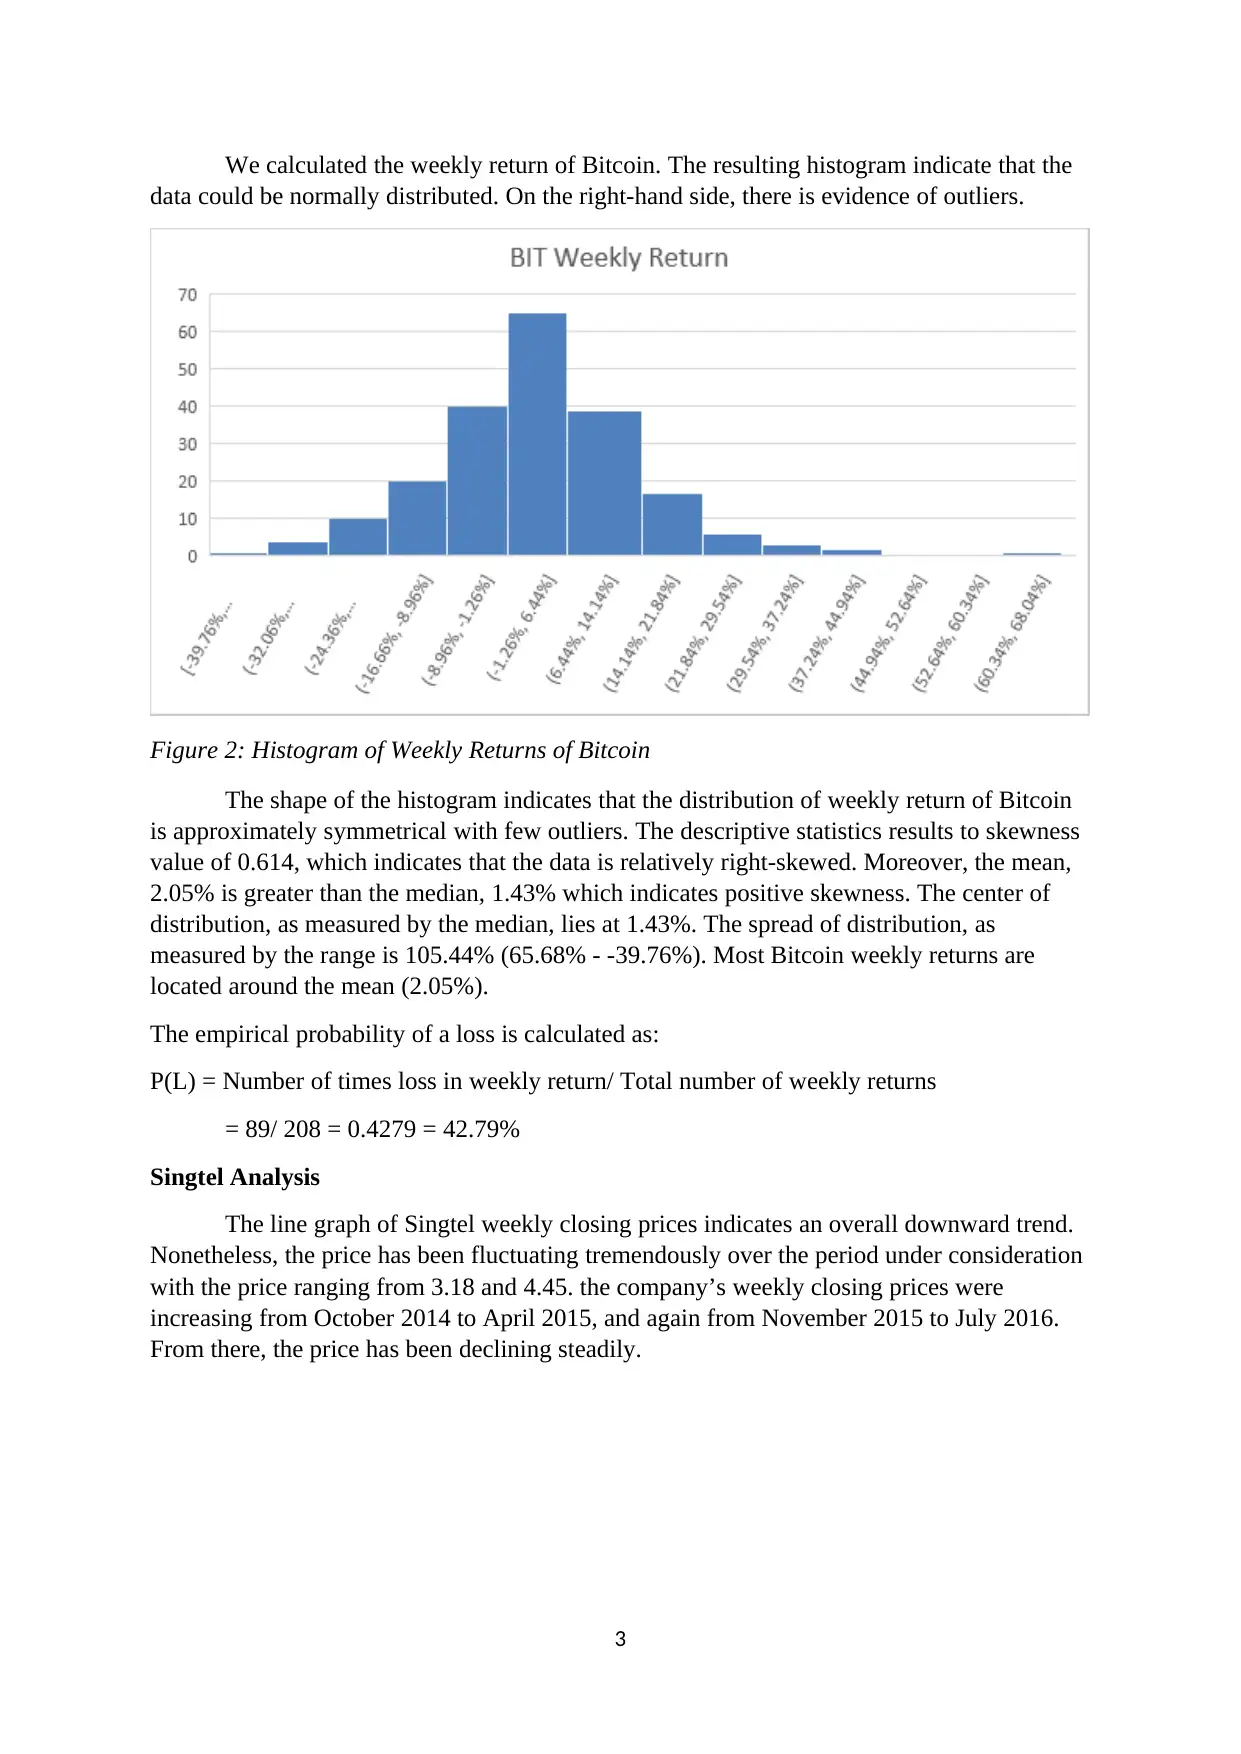
The line graph of Singtel weekly closing prices indicates an overall downward trend.
Nonetheless, the price has been fluctuating tremendously over the period under consideration
with the price ranging from 3.18 and 4.45. the company’s weekly closing prices were
increasing from October 2014 to April 2015, and again from November 2015 to July 2016.
From there, the price has been declining steadily.
3
data could be normally distributed. On the right-hand side, there is evidence of outliers.
Figure 2: Histogram of Weekly Returns of Bitcoin
The shape of the histogram indicates that the distribution of weekly return of Bitcoin
is approximately symmetrical with few outliers. The descriptive statistics results to skewness
value of 0.614, which indicates that the data is relatively right-skewed. Moreover, the mean,
2.05% is greater than the median, 1.43% which indicates positive skewness. The center of
distribution, as measured by the median, lies at 1.43%. The spread of distribution, as
measured by the range is 105.44% (65.68% - -39.76%). Most Bitcoin weekly returns are
located around the mean (2.05%).
The empirical probability of a loss is calculated as:
P(L) = Number of times loss in weekly return/ Total number of weekly returns
= 89/ 208 = 0.4279 = 42.79%
Singtel Analysis
The line graph of Singtel weekly closing prices indicates an overall downward trend.
Nonetheless, the price has been fluctuating tremendously over the period under consideration
with the price ranging from 3.18 and 4.45. the company’s weekly closing prices were
increasing from October 2014 to April 2015, and again from November 2015 to July 2016.
From there, the price has been declining steadily.
3
Paraphrase This Document
Need a fresh take? Get an instant paraphrase of this document with our AI Paraphraser
6/15/2014
8/15/2014
10/15/2014
12/15/2014
2/15/2015
4/15/2015
6/15/2015
8/15/2015
10/15/2015
12/15/2015
2/15/2016
4/15/2016
6/15/2016
8/15/2016
10/15/2016
12/15/2016
2/15/2017
4/15/2017
6/15/2017
8/15/2017
10/15/2017
12/15/2017
2/15/2018
4/15/2018
2.00
2.50
3.00
3.50
4.00
4.50
5.00
Singtel
Figure 3: Graph of Singtel's Weekly Closing Price
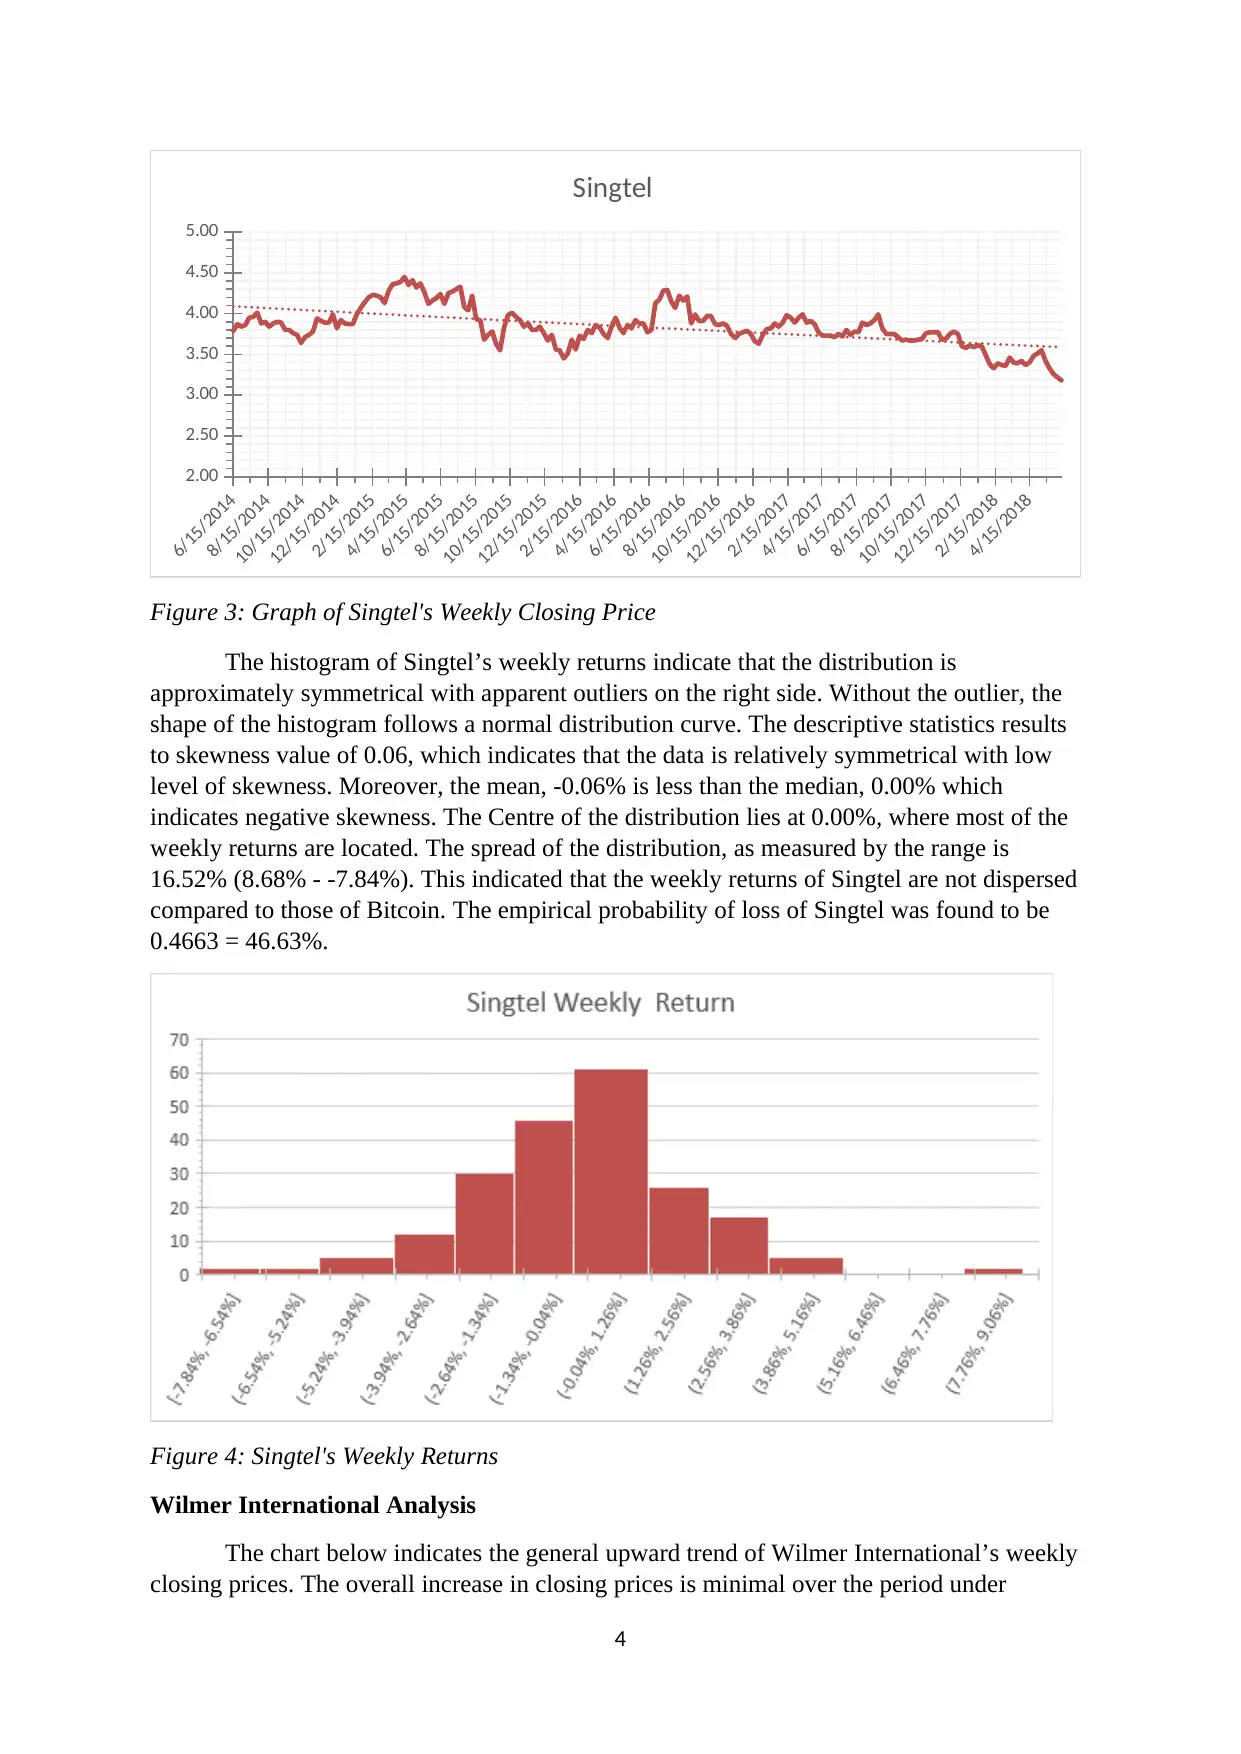
The histogram of Singtel’s weekly returns indicate that the distribution is
approximately symmetrical with apparent outliers on the right side. Without the outlier, the
shape of the histogram follows a normal distribution curve. The descriptive statistics results
to skewness value of 0.06, which indicates that the data is relatively symmetrical with low
level of skewness. Moreover, the mean, -0.06% is less than the median, 0.00% which
indicates negative skewness. The Centre of the distribution lies at 0.00%, where most of the
weekly returns are located. The spread of the distribution, as measured by the range is
16.52% (8.68% - -7.84%). This indicated that the weekly returns of Singtel are not dispersed
compared to those of Bitcoin. The empirical probability of loss of Singtel was found to be
0.4663 = 46.63%.
Figure 4: Singtel's Weekly Returns
Wilmer International Analysis
The chart below indicates the general upward trend of Wilmer International’s weekly
closing prices. The overall increase in closing prices is minimal over the period under
4
8/15/2014
10/15/2014
12/15/2014
2/15/2015
4/15/2015
6/15/2015
8/15/2015
10/15/2015
12/15/2015
2/15/2016
4/15/2016
6/15/2016
8/15/2016
10/15/2016
12/15/2016
2/15/2017
4/15/2017
6/15/2017
8/15/2017
10/15/2017
12/15/2017
2/15/2018
4/15/2018
2.00
2.50
3.00
3.50
4.00
4.50
5.00
Singtel
Figure 3: Graph of Singtel's Weekly Closing Price
The histogram of Singtel’s weekly returns indicate that the distribution is
approximately symmetrical with apparent outliers on the right side. Without the outlier, the
shape of the histogram follows a normal distribution curve. The descriptive statistics results
to skewness value of 0.06, which indicates that the data is relatively symmetrical with low
level of skewness. Moreover, the mean, -0.06% is less than the median, 0.00% which
indicates negative skewness. The Centre of the distribution lies at 0.00%, where most of the
weekly returns are located. The spread of the distribution, as measured by the range is
16.52% (8.68% - -7.84%). This indicated that the weekly returns of Singtel are not dispersed
compared to those of Bitcoin. The empirical probability of loss of Singtel was found to be
0.4663 = 46.63%.
Figure 4: Singtel's Weekly Returns
Wilmer International Analysis
The chart below indicates the general upward trend of Wilmer International’s weekly
closing prices. The overall increase in closing prices is minimal over the period under
4
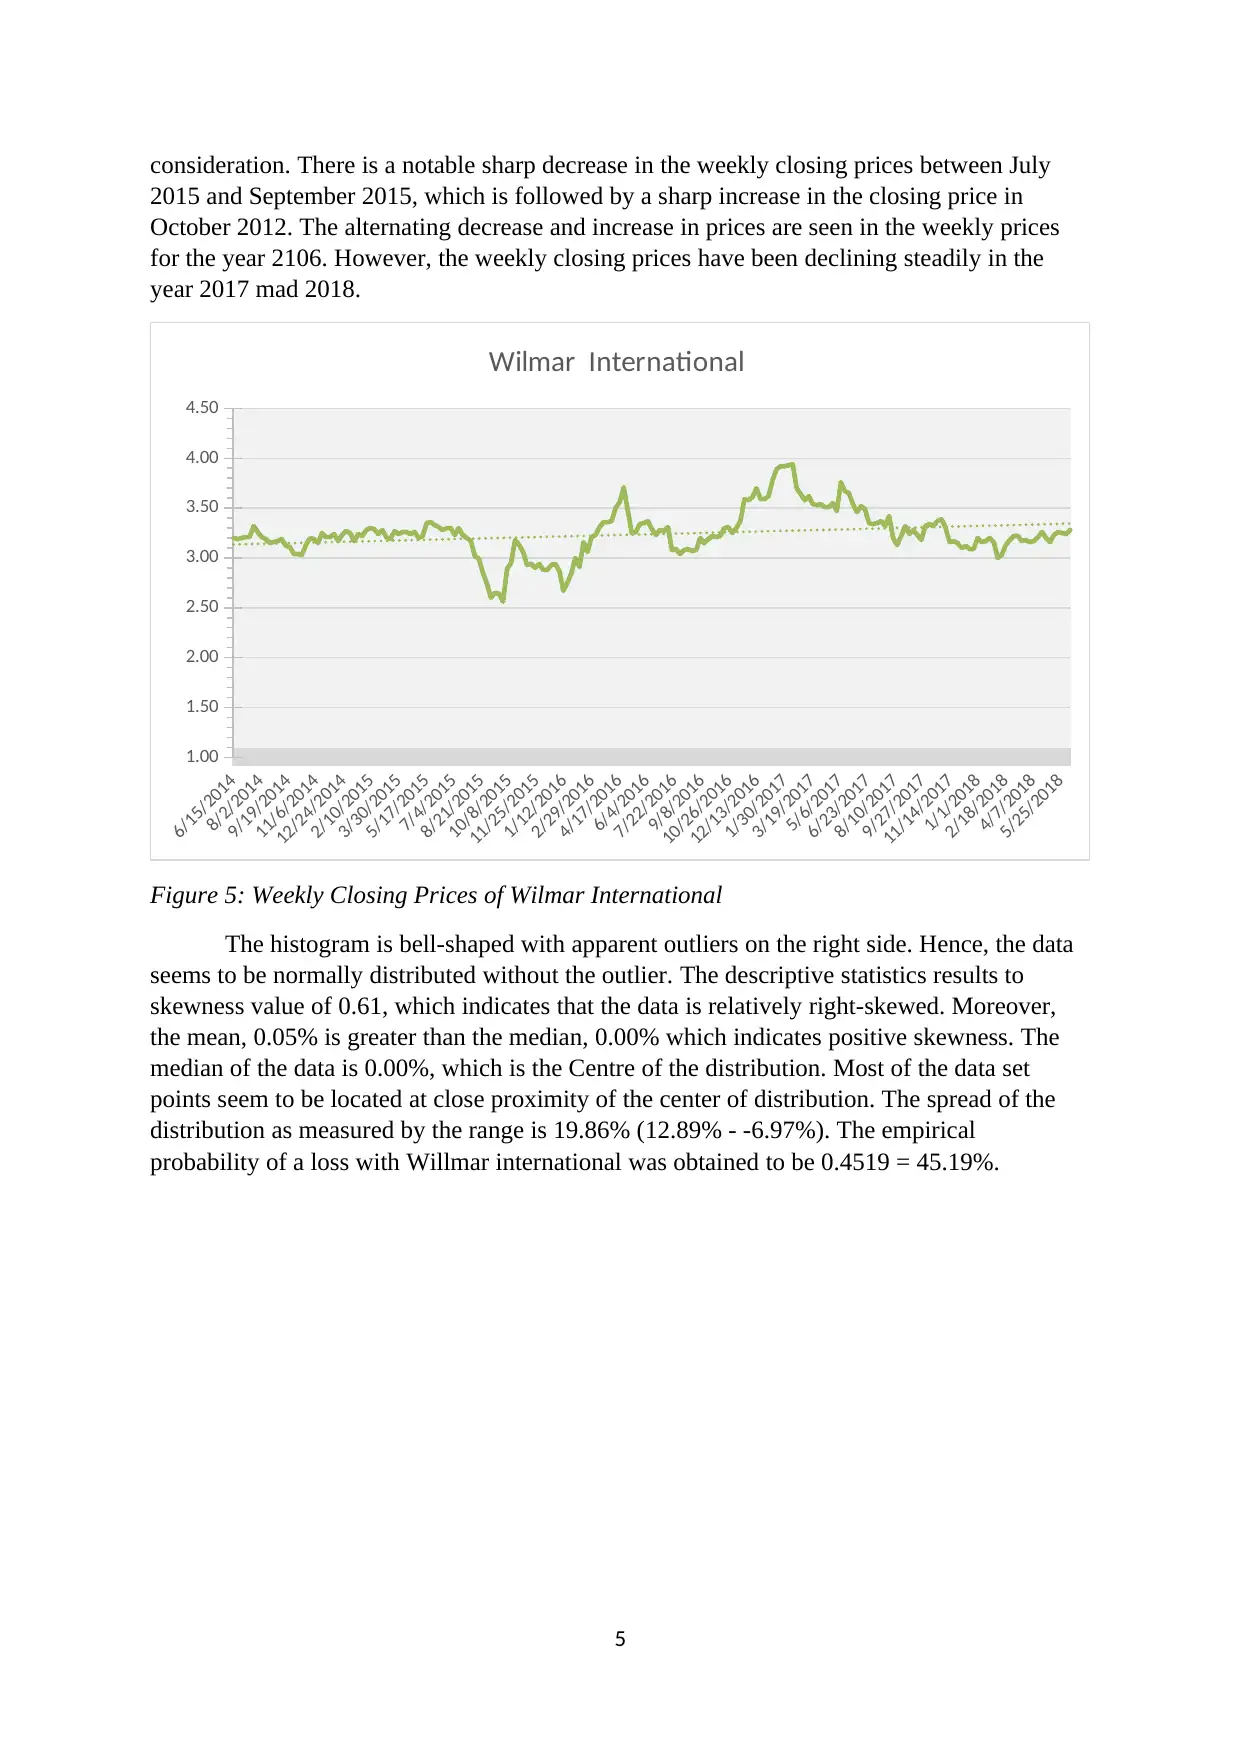
consideration. There is a notable sharp decrease in the weekly closing prices between July
2015 and September 2015, which is followed by a sharp increase in the closing price in
October 2012. The alternating decrease and increase in prices are seen in the weekly prices
for the year 2106. However, the weekly closing prices have been declining steadily in the
year 2017 mad 2018.
6/15/2014
8/2/2014
9/19/2014
11/6/2014
12/24/2014
2/10/2015
3/30/2015
5/17/2015
7/4/2015
8/21/2015
10/8/2015
11/25/2015
1/12/2016
2/29/2016
4/17/2016
6/4/2016
7/22/2016
9/8/2016
10/26/2016
12/13/2016
1/30/2017
3/19/2017
5/6/2017
6/23/2017
8/10/2017
9/27/2017
11/14/2017
1/1/2018
2/18/2018
4/7/2018
5/25/2018
1.00
1.50
2.00
2.50
3.00
3.50
4.00
4.50
Wilmar International
Figure 5: Weekly Closing Prices of Wilmar International
The histogram is bell-shaped with apparent outliers on the right side. Hence, the data
seems to be normally distributed without the outlier. The descriptive statistics results to
skewness value of 0.61, which indicates that the data is relatively right-skewed. Moreover,
the mean, 0.05% is greater than the median, 0.00% which indicates positive skewness. The
median of the data is 0.00%, which is the Centre of the distribution. Most of the data set
points seem to be located at close proximity of the center of distribution. The spread of the
distribution as measured by the range is 19.86% (12.89% - -6.97%). The empirical
probability of a loss with Willmar international was obtained to be 0.4519 = 45.19%.
5
⊘ This is a preview!⊘
Do you want full access?
Subscribe today to unlock all pages.
Trusted by 1+ million students worldwide
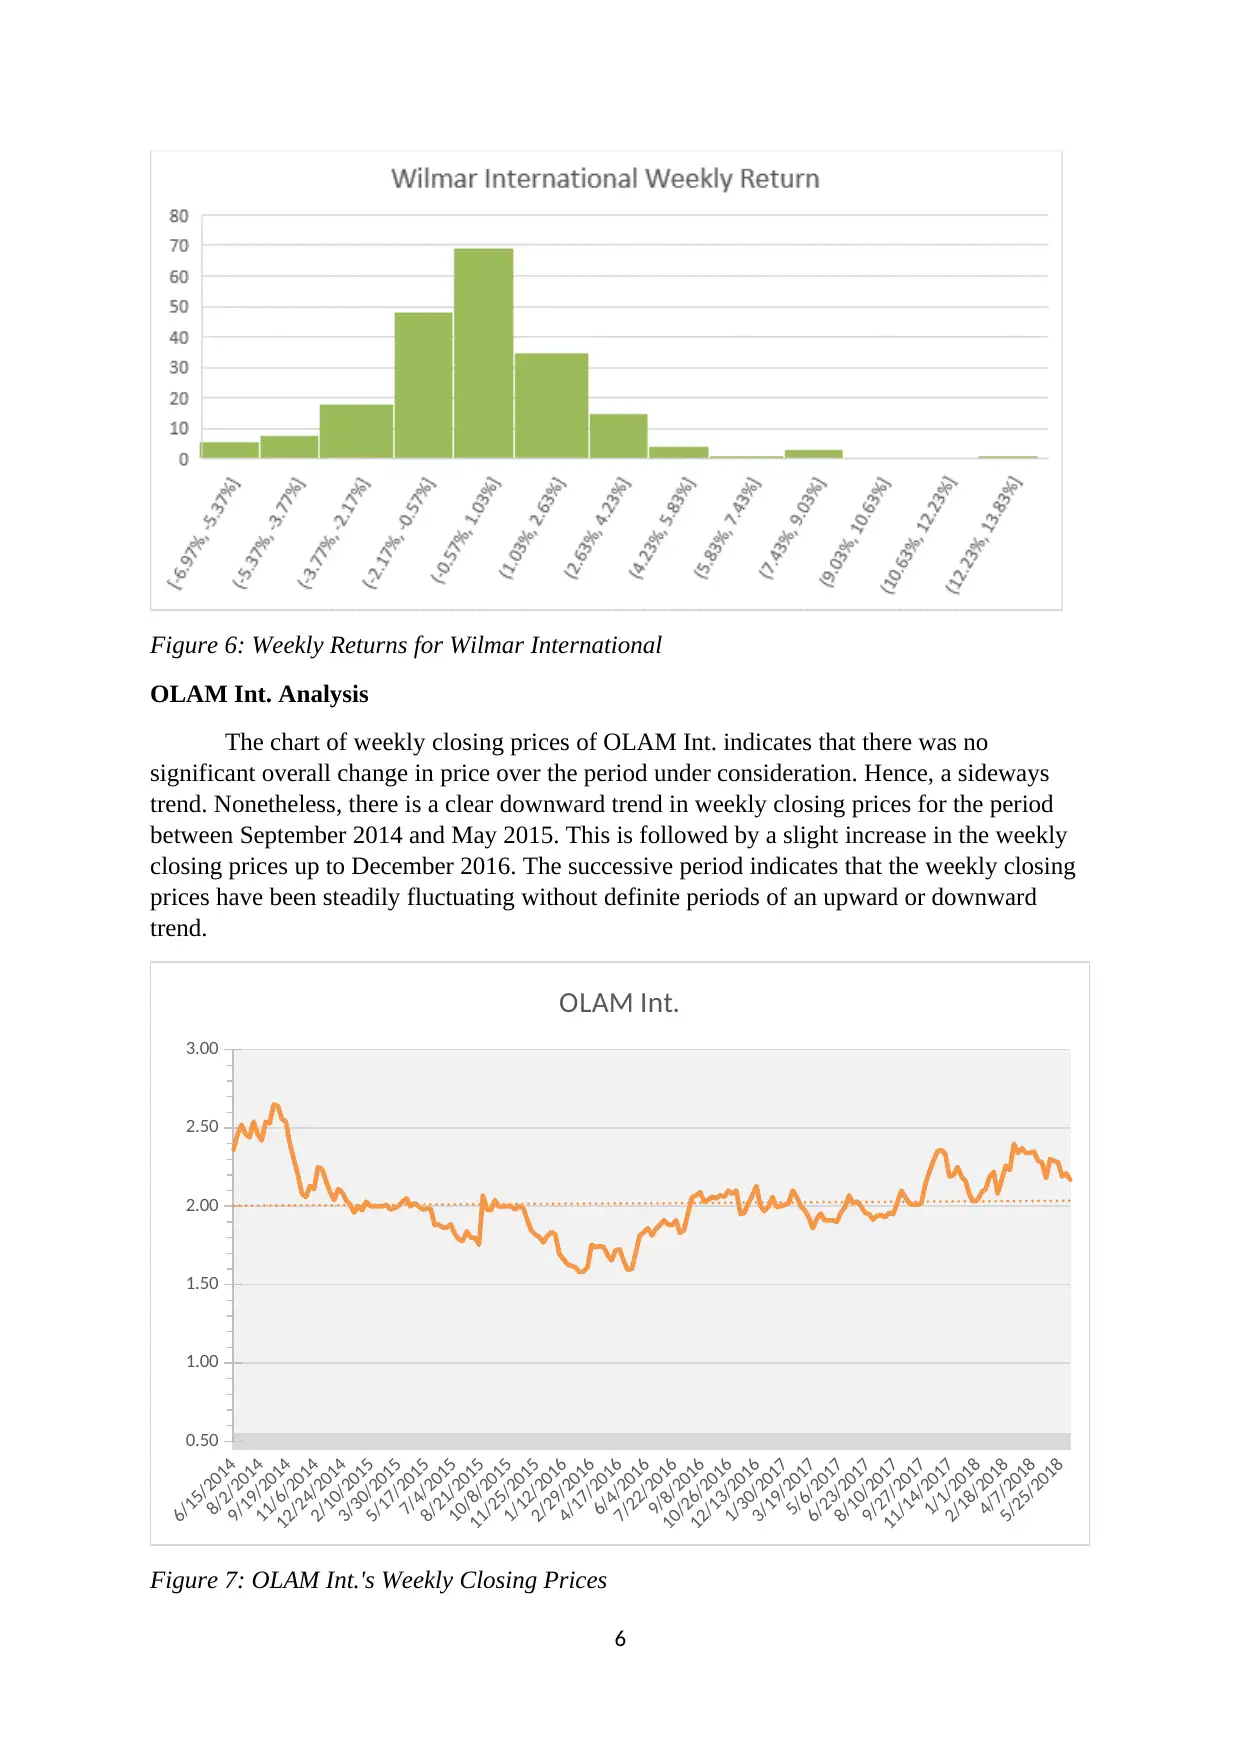
Figure 6: Weekly Returns for Wilmar International
OLAM Int. Analysis
The chart of weekly closing prices of OLAM Int. indicates that there was no
significant overall change in price over the period under consideration. Hence, a sideways
trend. Nonetheless, there is a clear downward trend in weekly closing prices for the period
between September 2014 and May 2015. This is followed by a slight increase in the weekly
closing prices up to December 2016. The successive period indicates that the weekly closing
prices have been steadily fluctuating without definite periods of an upward or downward
trend.
6/15/2014
8/2/2014
9/19/2014
11/6/2014
12/24/2014
2/10/2015
3/30/2015
5/17/2015
7/4/2015
8/21/2015
10/8/2015
11/25/2015
1/12/2016
2/29/2016
4/17/2016
6/4/2016
7/22/2016
9/8/2016
10/26/2016
12/13/2016
1/30/2017
3/19/2017
5/6/2017
6/23/2017
8/10/2017
9/27/2017
11/14/2017
1/1/2018
2/18/2018
4/7/2018
5/25/2018
0.50
1.00
1.50
2.00
2.50
3.00
OLAM Int.
Figure 7: OLAM Int.'s Weekly Closing Prices
6
Paraphrase This Document
Need a fresh take? Get an instant paraphrase of this document with our AI Paraphraser
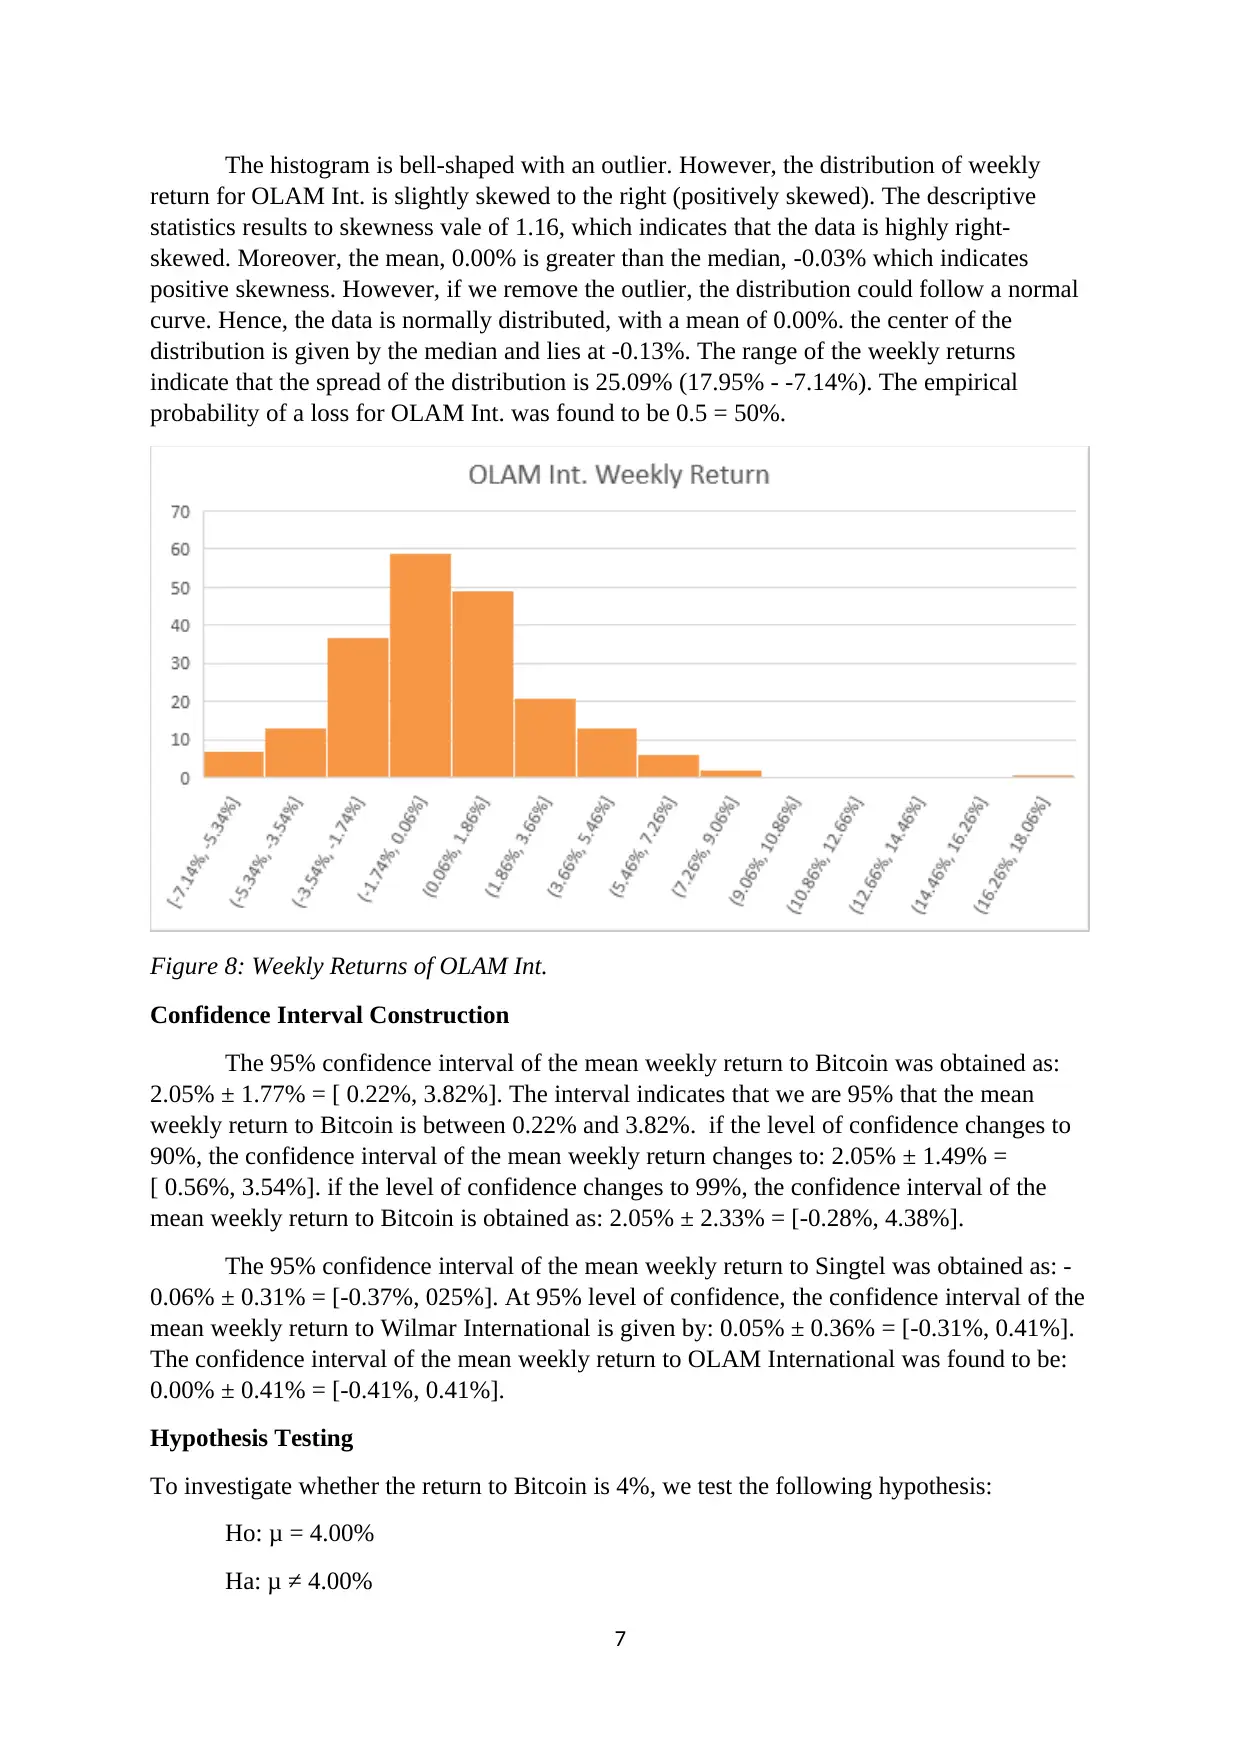
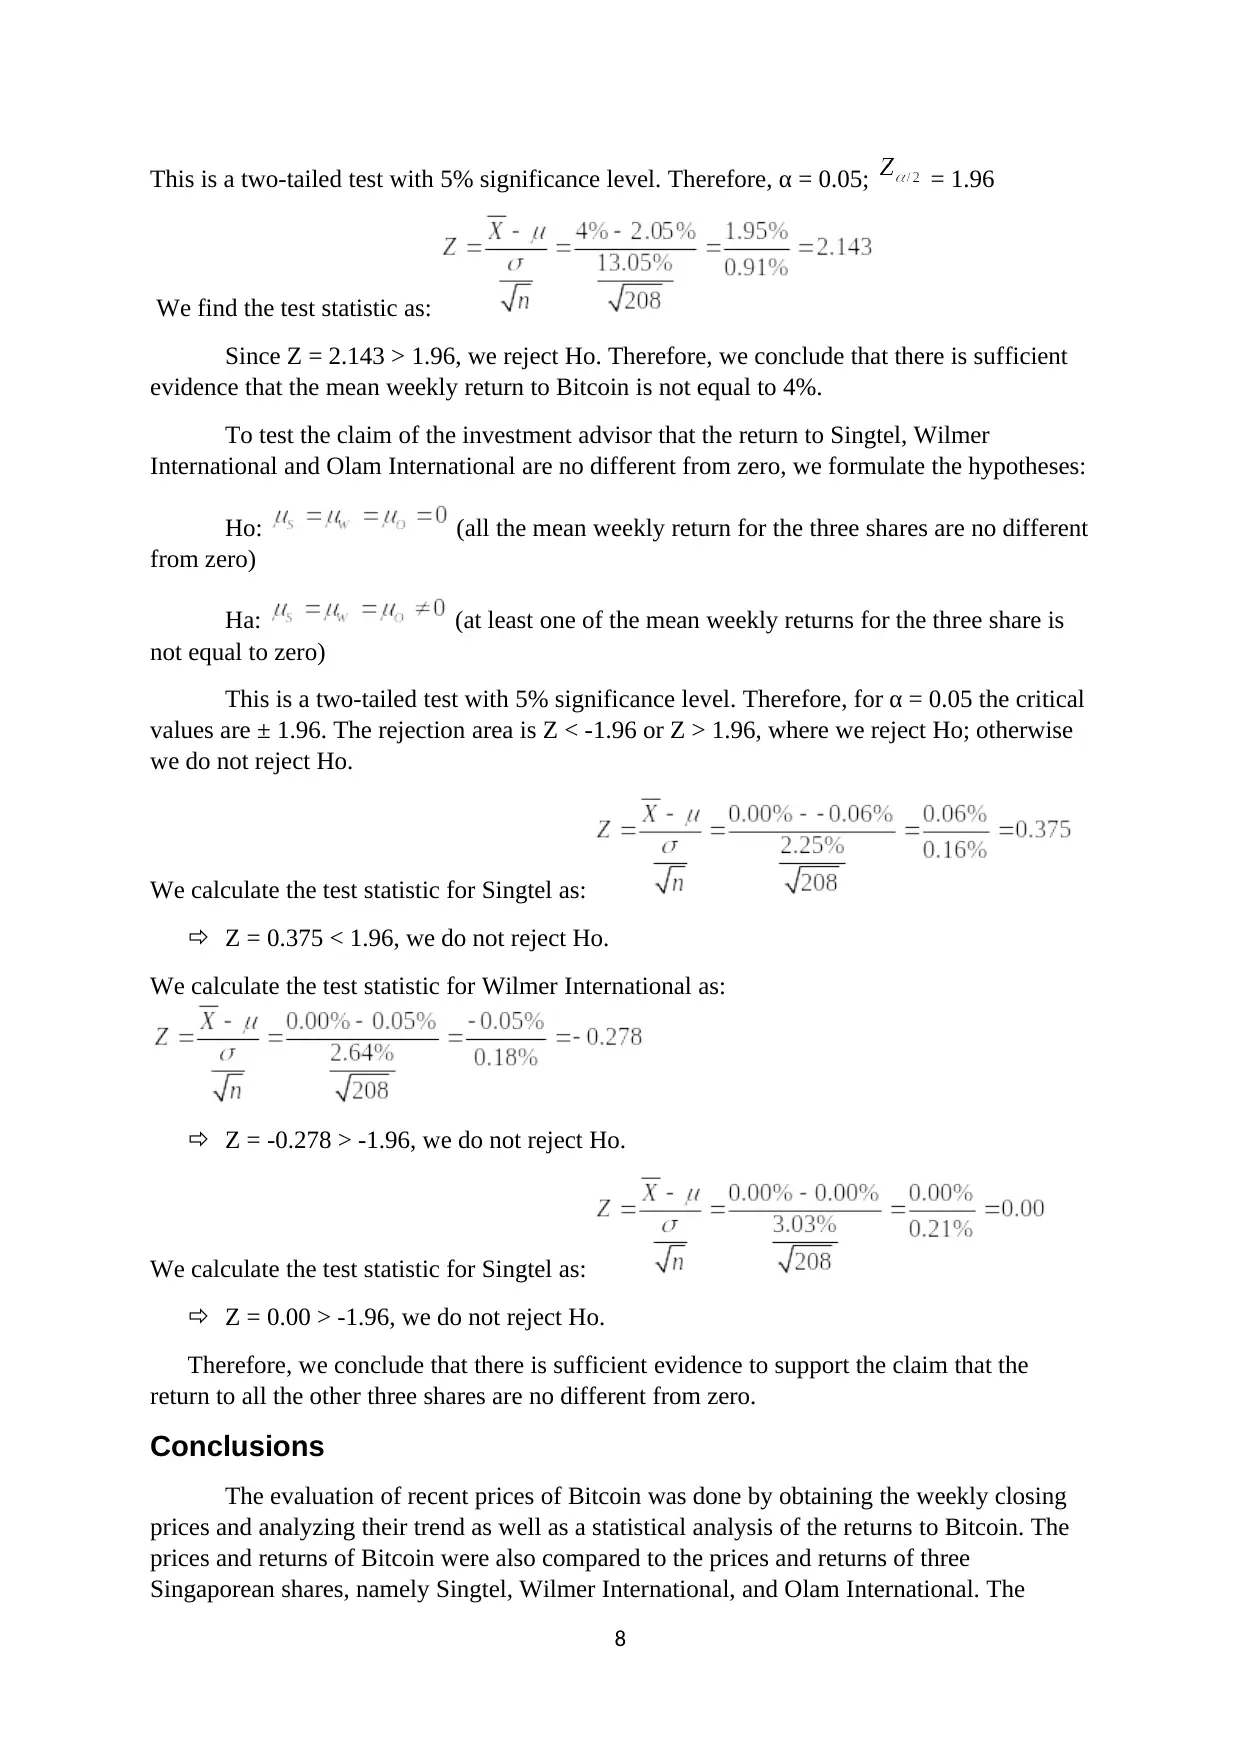
The histogram is bell-shaped with an outlier. However, the distribution of weekly
return for OLAM Int. is slightly skewed to the right (positively skewed). The descriptive
statistics results to skewness vale of 1.16, which indicates that the data is highly right-
skewed. Moreover, the mean, 0.00% is greater than the median, -0.03% which indicates
positive skewness. However, if we remove the outlier, the distribution could follow a normal
curve. Hence, the data is normally distributed, with a mean of 0.00%. the center of the
distribution is given by the median and lies at -0.13%. The range of the weekly returns
indicate that the spread of the distribution is 25.09% (17.95% - -7.14%). The empirical
probability of a loss for OLAM Int. was found to be 0.5 = 50%.
Figure 8: Weekly Returns of OLAM Int.
Confidence Interval Construction
The 95% confidence interval of the mean weekly return to Bitcoin was obtained as:
2.05% ± 1.77% = [ 0.22%, 3.82%]. The interval indicates that we are 95% that the mean
weekly return to Bitcoin is between 0.22% and 3.82%. if the level of confidence changes to
90%, the confidence interval of the mean weekly return changes to: 2.05% ± 1.49% =
[ 0.56%, 3.54%]. if the level of confidence changes to 99%, the confidence interval of the
mean weekly return to Bitcoin is obtained as: 2.05% ± 2.33% = [-0.28%, 4.38%].
The 95% confidence interval of the mean weekly return to Singtel was obtained as: -
0.06% ± 0.31% = [-0.37%, 025%]. At 95% level of confidence, the confidence interval of the
mean weekly return to Wilmar International is given by: 0.05% ± 0.36% = [-0.31%, 0.41%].
The confidence interval of the mean weekly return to OLAM International was found to be:
0.00% ± 0.41% = [-0.41%, 0.41%].
Hypothesis Testing
To investigate whether the return to Bitcoin is 4%, we test the following hypothesis:
Ho: μ = 4.00%
Ha: μ ≠ 4.00%
7
This is a two-tailed test with 5% significance level. Therefore, α = 0.05; = 1.96
We find the test statistic as:
Since Z = 2.143 > 1.96, we reject Ho. Therefore, we conclude that there is sufficient
evidence that the mean weekly return to Bitcoin is not equal to 4%.
To test the claim of the investment advisor that the return to Singtel, Wilmer
International and Olam International are no different from zero, we formulate the hypotheses:
Ho: (all the mean weekly return for the three shares are no different
from zero)
Ha: (at least one of the mean weekly returns for the three share is
not equal to zero)
This is a two-tailed test with 5% significance level. Therefore, for α = 0.05 the critical
values are ± 1.96. The rejection area is Z < -1.96 or Z > 1.96, where we reject Ho; otherwise
we do not reject Ho.
We calculate the test statistic for Singtel as:
Z = 0.375 < 1.96, we do not reject Ho.
We calculate the test statistic for Wilmer International as:
Z = -0.278 > -1.96, we do not reject Ho.
We calculate the test statistic for Singtel as:
Z = 0.00 > -1.96, we do not reject Ho.
Therefore, we conclude that there is sufficient evidence to support the claim that the
return to all the other three shares are no different from zero.
Conclusions
The evaluation of recent prices of Bitcoin was done by obtaining the weekly closing
prices and analyzing their trend as well as a statistical analysis of the returns to Bitcoin. The
prices and returns of Bitcoin were also compared to the prices and returns of three
Singaporean shares, namely Singtel, Wilmer International, and Olam International. The
8
⊘ This is a preview!⊘
Do you want full access?
Subscribe today to unlock all pages.
Trusted by 1+ million students worldwide
weekly closing prices indicated an upward trend for Bitcoin and Wilmar International.
However, the fluctuations in the closing price of Bitcoin was significant in the past few
weeks, as the chart indicated sharp increases and decreases in the weekly closing prices. On
the other hand, the upward trend for Wilmer International was characterized by small
increases and decreases in the weekly closing price.
For Singtel shares, the weekly closing prices indicated a downward trend while Olam
international prices indicated no significant change in the trend over the period under
consideration. The analysis of return’s to Bitcoin and the other three shares indicate that
Bitcoin had higher positive returns than the other three shares. The mean returns to Singtel
shares were negative as supported by the downward trend of the weekly closing prices. The
mean returns to Wilmar international were slightly positive. the return to Olam International
was no different from zero. All the three shares have a higher probability of a loss than
Bitcoin.
In a nutshell, we would advice individuals to invest in Bitcoin because it has higher
mean returns than other shares of different companies. However, investors should be wary of
the price fluctuations due to controversies and high speculations associated with the Bitcoin.
References
Share prices were downloaded from Yahoo finance.
Hays, D. (2018). Blockchain: an overview. LSE Business Review.
Baur, D. G., Hong, K., & Lee, A. D. (2018). Bitcoin: Medium of exchange or speculative
assets?. Journal of International Financial Markets, Institutions and Money, 54, 177-189.
Hong, K. (2017). Bitcoin as an alternative investment vehicle. Information Technology and
Management, 18(4), 265-275.’
Cryptoresearch.report. (2018). [online] Available at: https://cryptoresearch.report/wp-
content/uploads/2017/12/Incrementum-Crypto-Research-Report-Edition-1-English-
Version.pdf
9
Paraphrase This Document
Need a fresh take? Get an instant paraphrase of this document with our AI Paraphraser
Part B:
Student Name: XXX
Student ID: XXX
I can confidently recommend investing in the Bitcoin rather than Singtel shares. The Bitcoin
prices indicate and upward trend while Singtel shares have a downward trend in the period
under consideration. Moreover, the mean return to Bitcoin for this period was 2.05% compare
to the mean return to Singtel shares of -0.06%. This means that an investor will earn a profit
by investing in Bitcoin and make a loss by investing in Singtel shares. However, the price of
Bitcoin is highly volatile compared to the price of Singtel shares. Therefore, a risk-averse
investor should not invest in the Bitcoin. Rather, an individual who wants to invest in Bitcoin
should have a high level of tolerance to risk and understand the technology well.
Student Name: XXX
Student ID: XXX
Scanning the data of weekly prices of Bitcoin and Olam International shares, it appears that
the shares are more affordable than Bitcoin. However, the resulting analysis of returns
indicate that Bitcoin offers higher returns than Olam International shares. The mean weekly
return to share is no different than zero. Comparatively, investing in Bitcoin earns the
investor a profit at 2.05%. Therefore, Bitcoin offer a better investment option than Olam
International shares. However, there are legal, regulatory and uncertainty risks associated
with Bitcoin as an investment asset that are not associated with shares.
Student Name: XXX
Student ID: XXX
In investment, high returns are associated with high risk. Likewise, Bitcoin is linked to
various risks which deter many risk-averse investors form investing in Bitcoin. Our analysis
indicates that the returns to Bitcoin are much higher than the returns to Wilmar International
shares. The mean weekly return to Bitcoin is 2.05% and that of Wilmar International is
10
Student Name: XXX
Student ID: XXX
I can confidently recommend investing in the Bitcoin rather than Singtel shares. The Bitcoin
prices indicate and upward trend while Singtel shares have a downward trend in the period
under consideration. Moreover, the mean return to Bitcoin for this period was 2.05% compare
to the mean return to Singtel shares of -0.06%. This means that an investor will earn a profit
by investing in Bitcoin and make a loss by investing in Singtel shares. However, the price of
Bitcoin is highly volatile compared to the price of Singtel shares. Therefore, a risk-averse
investor should not invest in the Bitcoin. Rather, an individual who wants to invest in Bitcoin
should have a high level of tolerance to risk and understand the technology well.
Student Name: XXX
Student ID: XXX
Scanning the data of weekly prices of Bitcoin and Olam International shares, it appears that
the shares are more affordable than Bitcoin. However, the resulting analysis of returns
indicate that Bitcoin offers higher returns than Olam International shares. The mean weekly
return to share is no different than zero. Comparatively, investing in Bitcoin earns the
investor a profit at 2.05%. Therefore, Bitcoin offer a better investment option than Olam
International shares. However, there are legal, regulatory and uncertainty risks associated
with Bitcoin as an investment asset that are not associated with shares.
Student Name: XXX
Student ID: XXX
In investment, high returns are associated with high risk. Likewise, Bitcoin is linked to
various risks which deter many risk-averse investors form investing in Bitcoin. Our analysis
indicates that the returns to Bitcoin are much higher than the returns to Wilmar International
shares. The mean weekly return to Bitcoin is 2.05% and that of Wilmar International is
10
0.05%, despite both investments having an upward trend of their weekly closing prices.
Therefore, I would confidently recommend investing in Bitcoin rather than Wilmar
International shares.
11
Therefore, I would confidently recommend investing in Bitcoin rather than Wilmar
International shares.
11
⊘ This is a preview!⊘
Do you want full access?
Subscribe today to unlock all pages.
Trusted by 1+ million students worldwide
1 out of 12


Your All-in-One AI-Powered Toolkit for Academic Success.
+13062052269
info@desklib.com
Available 24*7 on WhatsApp / Email
![[object Object]](/_next/static/media/star-bottom.7253800d.svg)
Unlock your academic potential
Copyright © 2020–2026 A2Z Services. All Rights Reserved. Developed and managed by ZUCOL.