Black Friars Restaurant: Business Decision Making Report Analysis
VerifiedAdded on 2019/12/17
|17
|3762
|330
Report
AI Summary
This report analyzes the business decisions of Black Friars Restaurant, focusing on its expansion plans in London. It begins with creating a plan for collecting primary and secondary data, including survey methodologies and questionnaire design to understand customer preferences. The report then analyzes collected sales and profit data from 2008 to 2016, calculating mean, median, and mode, along with measures of dispersion such as standard deviation and correlation coefficients. Graphs and trend lines are used to visualize the data, and conclusions are drawn regarding the restaurant's performance and potential strategies to improve sales and profitability. The report also explores the use of financial tools and critical path analysis for effective decision-making.
Business Decision
Making
1
Making
1
Paraphrase This Document
Need a fresh take? Get an instant paraphrase of this document with our AI Paraphraser
TABLE OF CONTENTS
Introduction .....................................................................................................................................3
Task 1...............................................................................................................................................3
1.1 Create a plan for the collection of primary and secondary data for Black friars restaurant . 3
1.2 Present the survey methodology and sampling frame .........................................................3
1.3 Design a questionnaire for collecting a data..........................................................................4
2.1 Create information for decision making by collecting data...................................................5
2.2 Mean mode and median ........................................................................................................6
2.3 Analyses the collected data using measure of dispersion......................................................7
2.4 Calculation of all measure of dispersion and useful conclusion............................................8
Task 2...............................................................................................................................................8
3.1 Graphs using a spreadsheet and draw a valid conclusion based on information .................8
3.2 Create a trend line in graph..................................................................................................11
3.3 Covered in Ppt.....................................................................................................................12
3.4 Formal business report.........................................................................................................12
TASK 3..........................................................................................................................................12
4.1 Appropriate information processing tool ............................................................................12
4.2 critical path .........................................................................................................................13
4.3 Use of financial tool for decision making............................................................................15
Conclusion ....................................................................................................................................16
Reference ......................................................................................................................................17
2
INTRODUCTION
`The process of deciding of something which is important in a group of people or in a
organization is known as decision making. It involve a selection of any action from a two or
more two possible alternative so that right solution can be get of a given problem. The present
report is based on Black friars restaurant, which is opening a new restaurants in London. The
present report a plan is created for the collection of primary and secondary data for a give
business problems. Along with this the survey methodology and sampling frame used is
evaluated. Apart from that, a questionnaire for a given business problem is designed.
TASK 1
1.1 Create a plan for the collection of primary and secondary data for Black friars restaurant
According to the given scenario, Black friars restaurant is planning to open its second
restaurant in London. For this purpose, the shareholders are keen to understand the market. For
understating a market Black friars restaurant need to collect some primary and secondary data.
Through this data large amount of information can be collected which help restaurant in getting
success.
Primary data: it is a data which is first hand and not exists until it is not collected.
Primary data is collected through a survey, questionnaire, interview or by phone call. This all
method are useful for a restaurant for gathering a information related to a customer preference
(Zikmund and Griffin, 2013) . In this report primary data is collected by a questionnaire method.
In this method questions are prepared and send to a customer through different mode such as by
email, face to face contact or by a social networking sites.
Secondary data: it is a data which is collected form books, journals etc. in a term of cost
effectiveness secondary data is very useful for a Black friars restaurant. Further restaurant can
gather information related to its competitor product and services (Zikmund and Griffin, 2013).
At a time of collecting a secondary data a lots of time is consume. research is carried out through
a qualitative and qualitative method which is decided by a secondary research.
1.2 Present the survey methodology and sampling frame
Black friars restaurant is opening a new restaurant in London because there is lots of
opportunities for business success. In order to earn profit they need to understand customer
3
⊘ This is a preview!⊘
Do you want full access?
Subscribe today to unlock all pages.
Trusted by 1+ million students worldwide
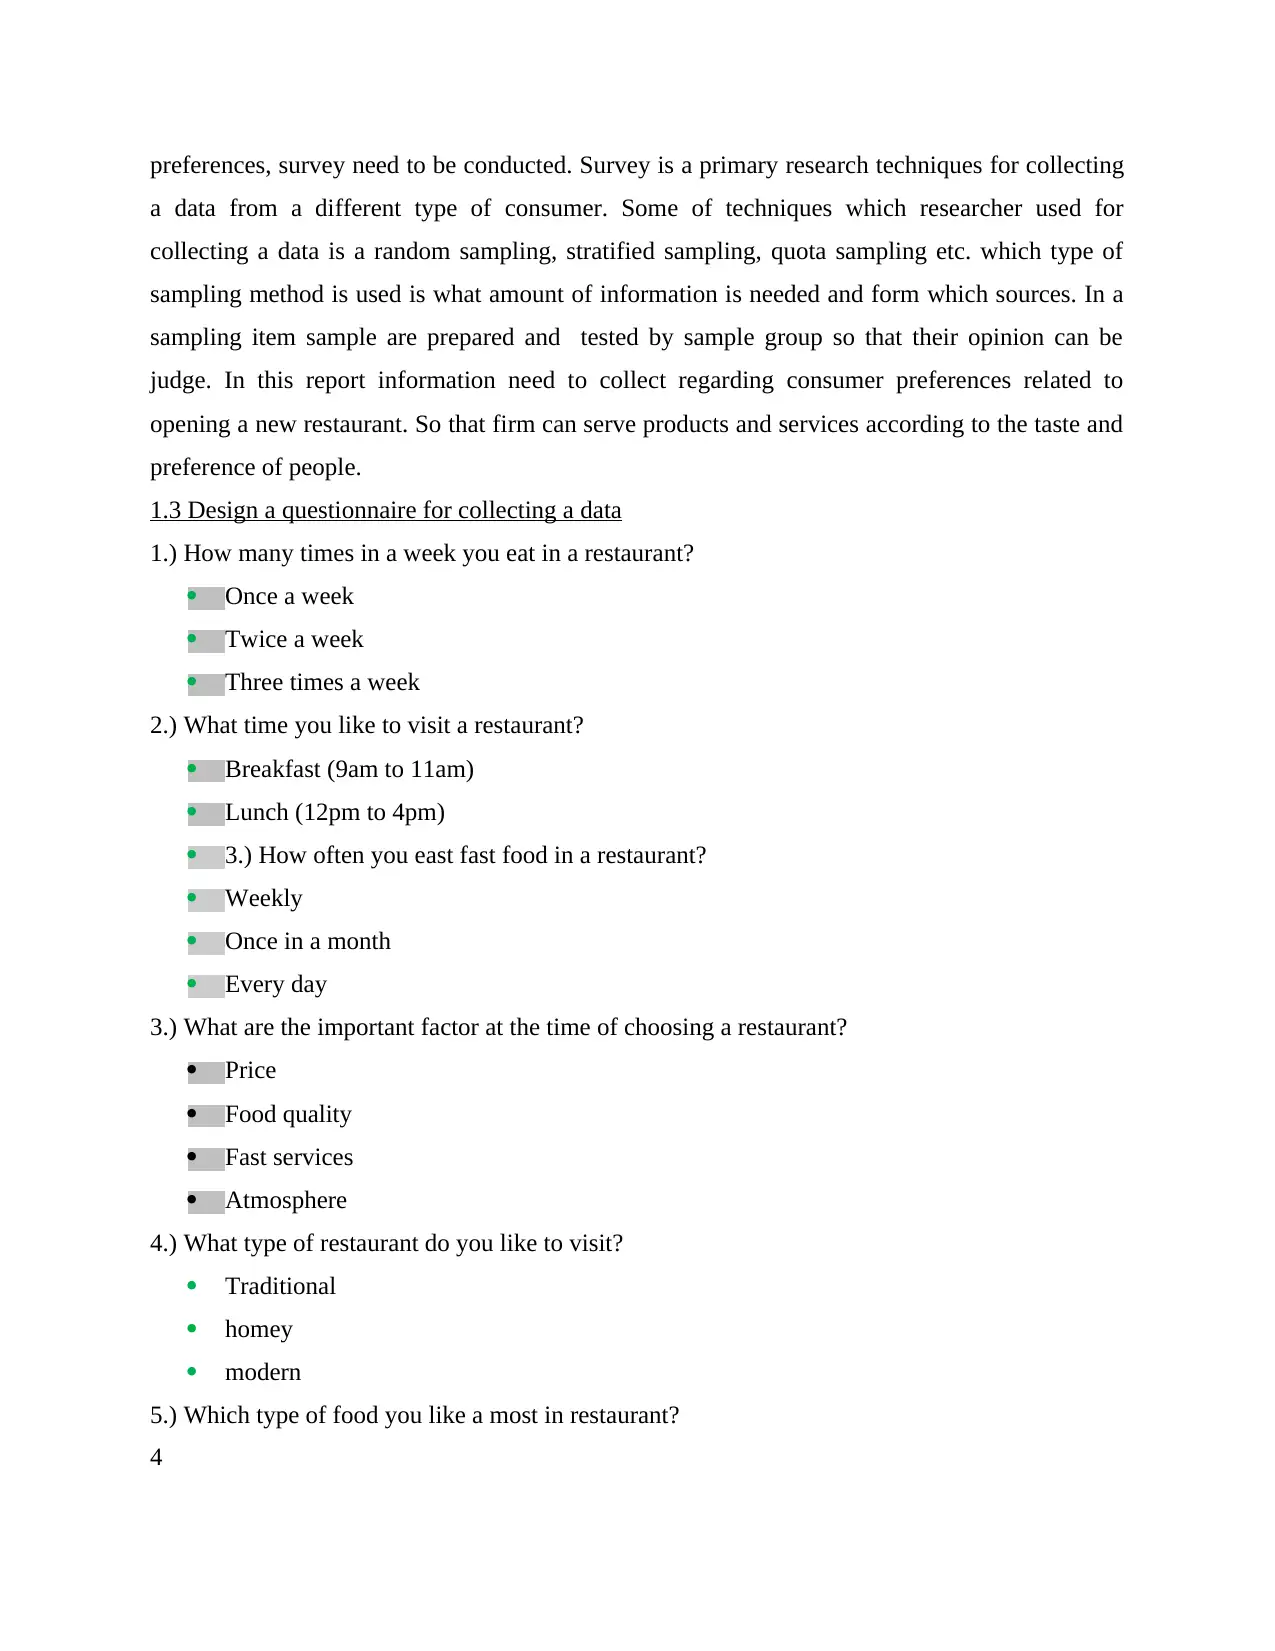
preferences, survey need to be conducted. Survey is a primary research techniques for collecting
a data from a different type of consumer. Some of techniques which researcher used for
collecting a data is a random sampling, stratified sampling, quota sampling etc. which type of
sampling method is used is what amount of information is needed and form which sources. In a
sampling item sample are prepared and tested by sample group so that their opinion can be
judge. In this report information need to collect regarding consumer preferences related to
opening a new restaurant. So that firm can serve products and services according to the taste and
preference of people.
1.3 Design a questionnaire for collecting a data
1.) How many times in a week you eat in a restaurant?
Once a week
Twice a week
Three times a week
2.) What time you like to visit a restaurant?
Breakfast (9am to 11am)
Lunch (12pm to 4pm)
3.) How often you east fast food in a restaurant?
Weekly
Once in a month
Every day
3.) What are the important factor at the time of choosing a restaurant?
Price
Food quality
Fast services
Atmosphere
4.) What type of restaurant do you like to visit?
Traditional
homey
modern
5.) Which type of food you like a most in restaurant?
4
Paraphrase This Document
Need a fresh take? Get an instant paraphrase of this document with our AI Paraphraser
Chinese
Italian
Multi cuisine
6.) How would you rate your overall satisfaction with us?
Very satisfied
Satisfied
dissatisfied
neutral
7.) Would you recommend us to your friend and families?
Yes
no
8.) Are you satisfy with a price of products and services?
Highly satisfied
Satisfied
Dissatisfied
Highly dissatisfied
9.) Our products and services are different from other competitor?
Yes
no
10.) How do you came to know about our restaurant?
Newspapers
Internet
Word of mouth
Social media
2.1 Create information for decision making by collecting data
Below is the profit and sale of Black friars restaurant is listed below form a year 2008 to
2016 their detail analysis as follow:
Year Sale profit
5
2008 1400 400
2009 1340 325
2010 1200 320
2011 1100 280
2012 1250 325
2013 1230 320
2014 1300 300
2015 1320 310
2016 1310 305
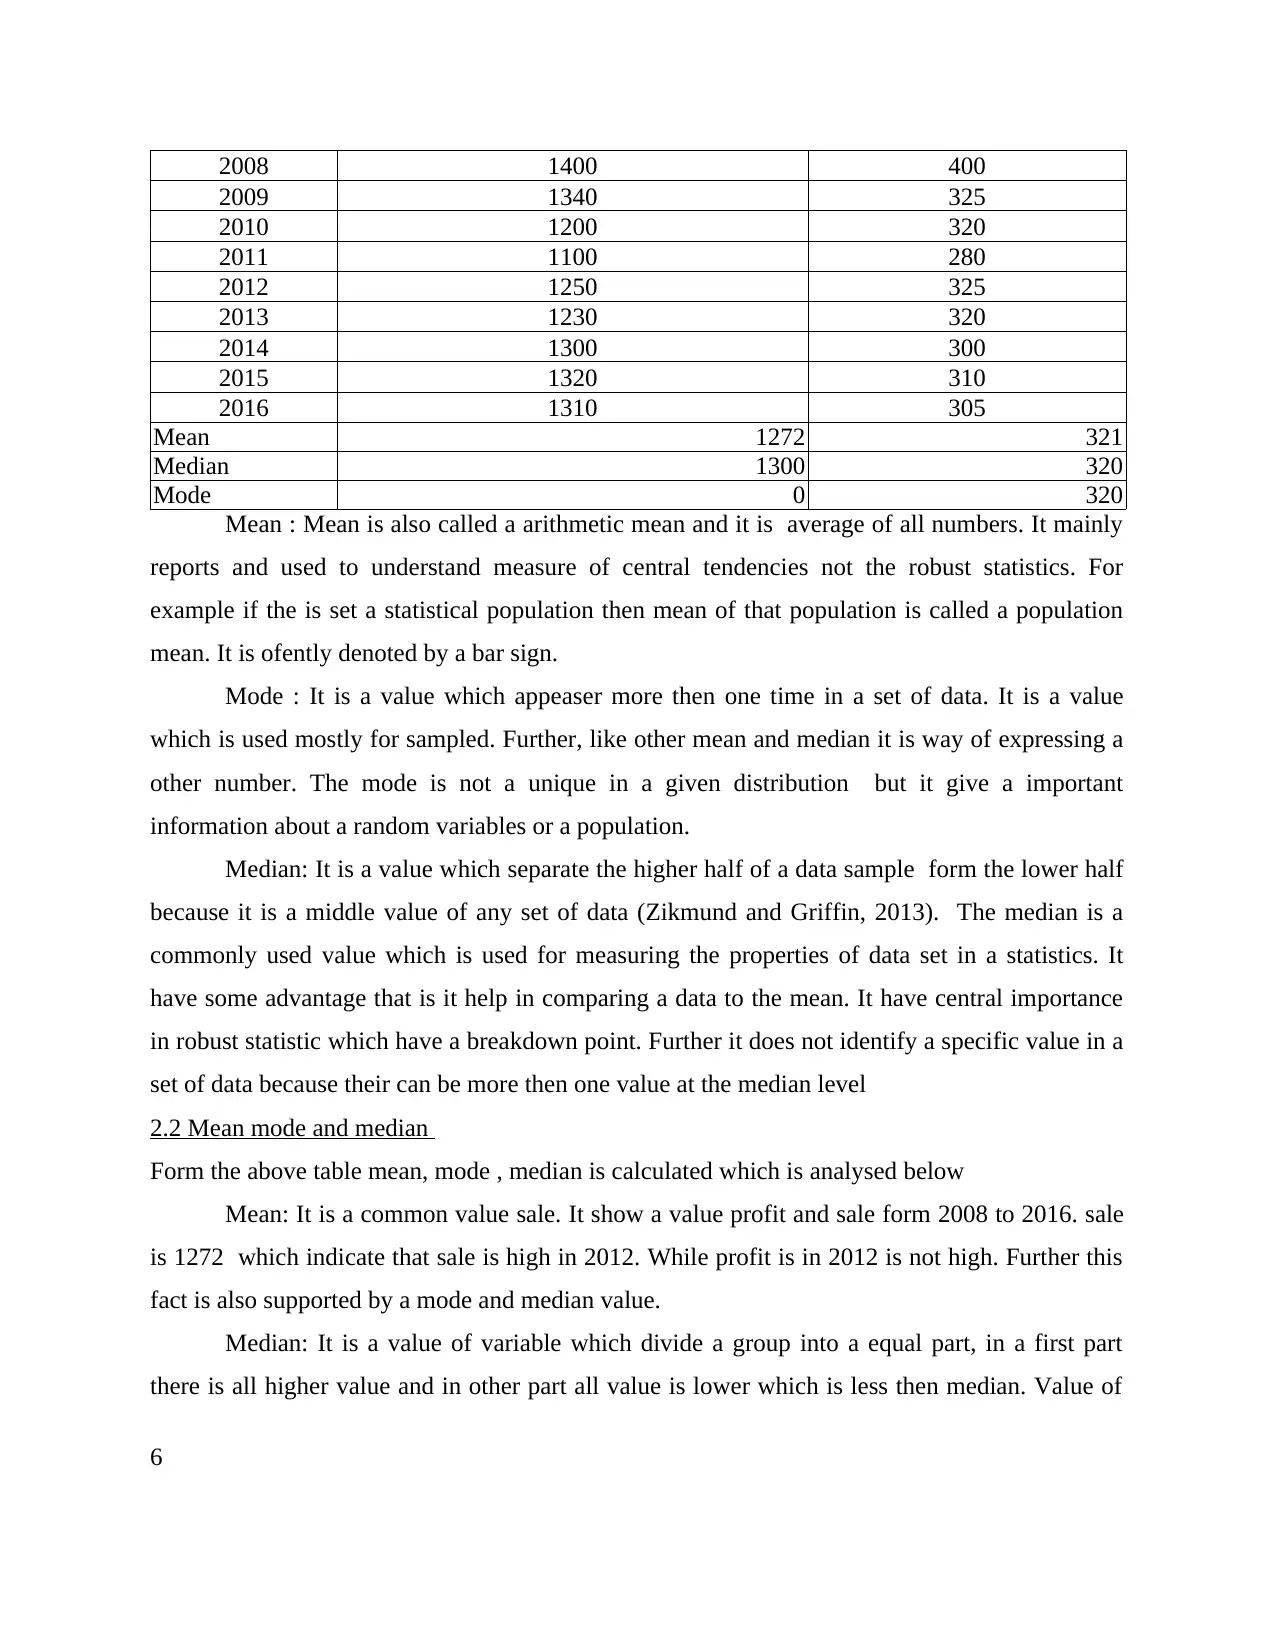
Mean 1272 321
Median 1300 320
Mode 0 320
Mean : Mean is also called a arithmetic mean and it is average of all numbers. It mainly
reports and used to understand measure of central tendencies not the robust statistics. For
example if the is set a statistical population then mean of that population is called a population
mean. It is ofently denoted by a bar sign.
Mode : It is a value which appeaser more then one time in a set of data. It is a value
which is used mostly for sampled. Further, like other mean and median it is way of expressing a
other number. The mode is not a unique in a given distribution but it give a important
information about a random variables or a population.
Median: It is a value which separate the higher half of a data sample form the lower half
because it is a middle value of any set of data (Zikmund and Griffin, 2013). The median is a
commonly used value which is used for measuring the properties of data set in a statistics. It
have some advantage that is it help in comparing a data to the mean. It have central importance
in robust statistic which have a breakdown point. Further it does not identify a specific value in a
set of data because their can be more then one value at the median level
2.2 Mean mode and median
Form the above table mean, mode , median is calculated which is analysed below
Mean: It is a common value sale. It show a value profit and sale form 2008 to 2016. sale
is 1272 which indicate that sale is high in 2012. While profit is in 2012 is not high. Further this
fact is also supported by a mode and median value.
Median: It is a value of variable which divide a group into a equal part, in a first part
there is all higher value and in other part all value is lower which is less then median. Value of
6
2009 1340 325
2010 1200 320
2011 1100 280
2012 1250 325
2013 1230 320
2014 1300 300
2015 1320 310
2016 1310 305
Mean 1272 321
Median 1300 320
Mode 0 320
Mean : Mean is also called a arithmetic mean and it is average of all numbers. It mainly
reports and used to understand measure of central tendencies not the robust statistics. For
example if the is set a statistical population then mean of that population is called a population
mean. It is ofently denoted by a bar sign.
Mode : It is a value which appeaser more then one time in a set of data. It is a value
which is used mostly for sampled. Further, like other mean and median it is way of expressing a
other number. The mode is not a unique in a given distribution but it give a important
information about a random variables or a population.
Median: It is a value which separate the higher half of a data sample form the lower half
because it is a middle value of any set of data (Zikmund and Griffin, 2013). The median is a
commonly used value which is used for measuring the properties of data set in a statistics. It
have some advantage that is it help in comparing a data to the mean. It have central importance
in robust statistic which have a breakdown point. Further it does not identify a specific value in a
set of data because their can be more then one value at the median level
2.2 Mean mode and median
Form the above table mean, mode , median is calculated which is analysed below
Mean: It is a common value sale. It show a value profit and sale form 2008 to 2016. sale
is 1272 which indicate that sale is high in 2012. While profit is in 2012 is not high. Further this
fact is also supported by a mode and median value.
Median: It is a value of variable which divide a group into a equal part, in a first part
there is all higher value and in other part all value is lower which is less then median. Value of
6
⊘ This is a preview!⊘
Do you want full access?
Subscribe today to unlock all pages.
Trusted by 1+ million students worldwide
Median in sale is 1300 value of medial in profit is 320. it indicate that sale form 2008 to 2014 is
high and after a median value it decrease.
Mode: Mode is a value which occur mostly in a set of data and other number around this
mode value. Value do mode in sale is nil mean no sale is frequent occur during a 2008 to 2016
Recommendation
From the above table it indicate that sale is after 2009 and there is less increase in sale till
a in 2014. Company sale is decreasing so company need to used a different strategy so that
company sale as well as profit can also increase.
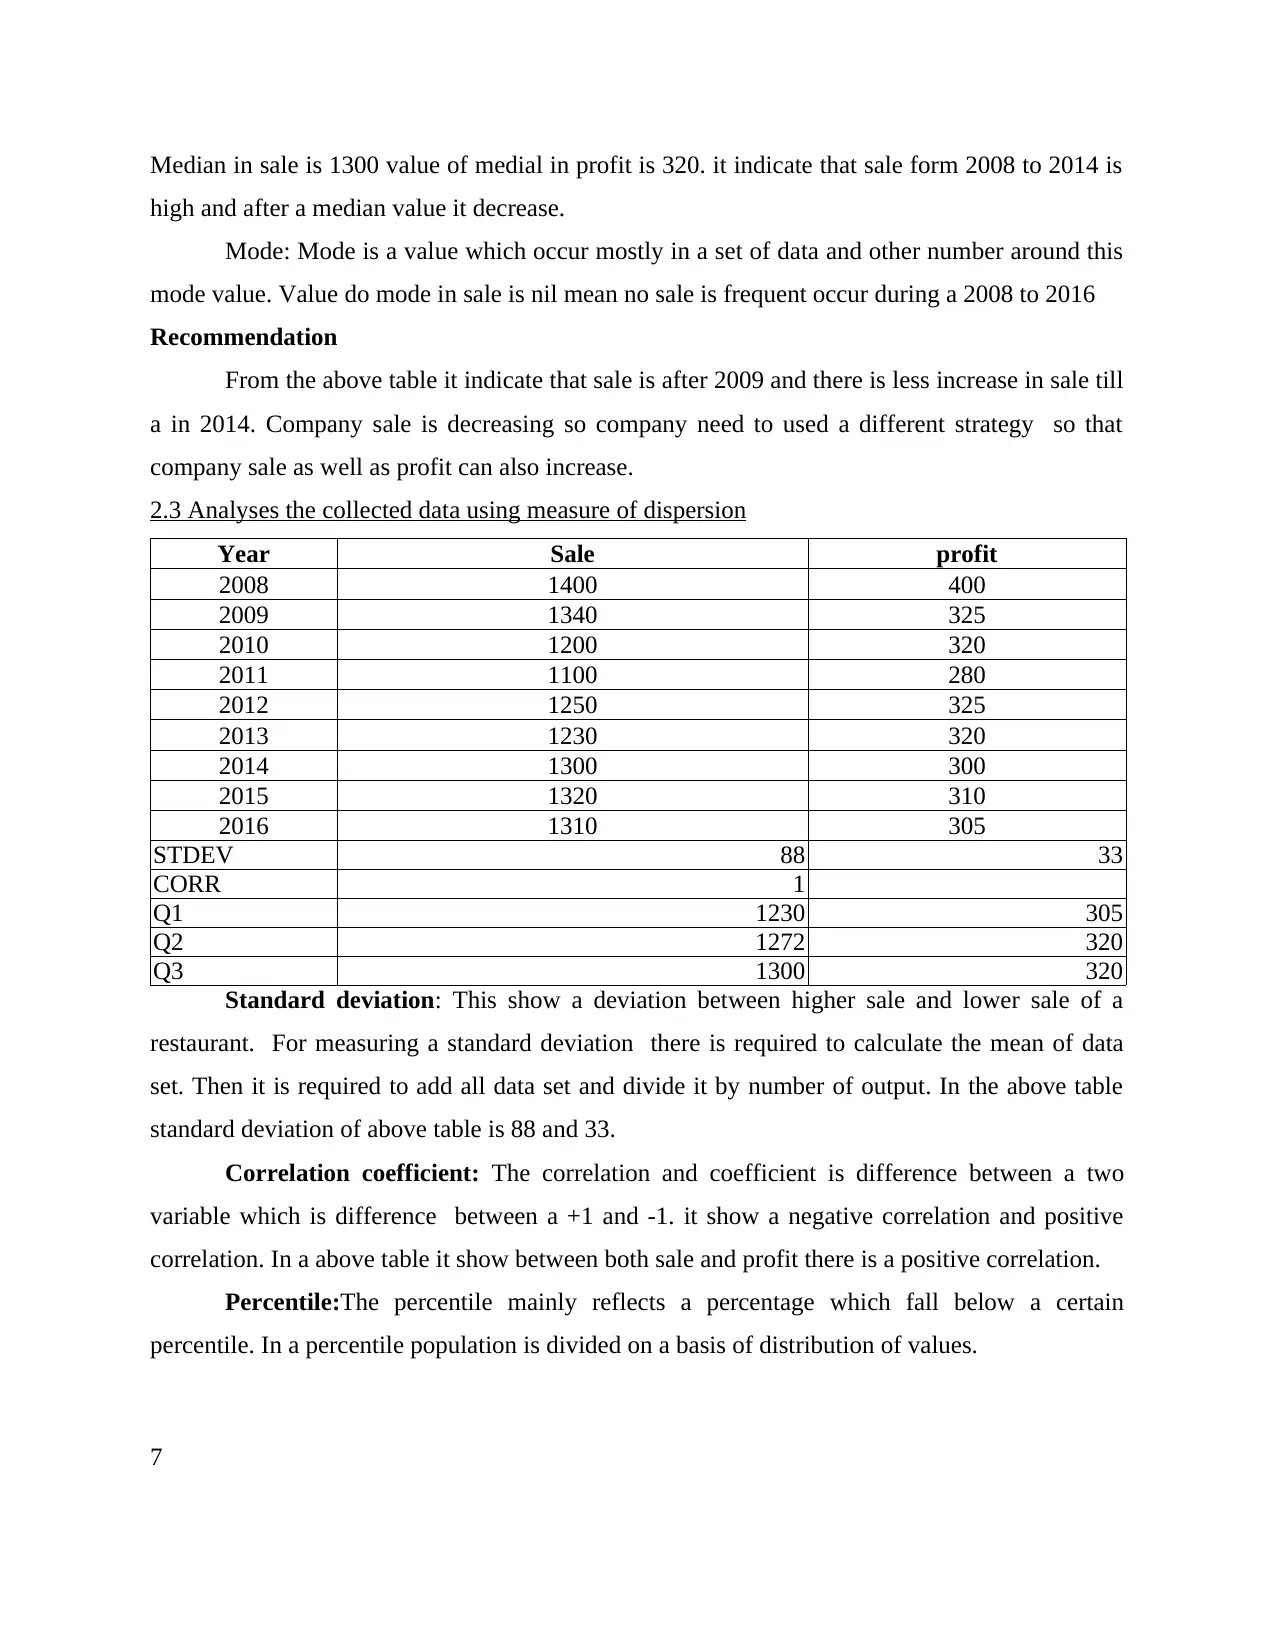
2.3 Analyses the collected data using measure of dispersion
Year Sale profit
2008 1400 400
2009 1340 325
2010 1200 320
2011 1100 280
2012 1250 325
2013 1230 320
2014 1300 300
2015 1320 310
2016 1310 305
STDEV 88 33
CORR 1
Q1 1230 305
Q2 1272 320
Q3 1300 320
Standard deviation: This show a deviation between higher sale and lower sale of a
restaurant. For measuring a standard deviation there is required to calculate the mean of data
set. Then it is required to add all data set and divide it by number of output. In the above table
standard deviation of above table is 88 and 33.
Correlation coefficient: The correlation and coefficient is difference between a two
variable which is difference between a +1 and -1. it show a negative correlation and positive
correlation. In a above table it show between both sale and profit there is a positive correlation.
Percentile:The percentile mainly reflects a percentage which fall below a certain
percentile. In a percentile population is divided on a basis of distribution of values.
7
high and after a median value it decrease.
Mode: Mode is a value which occur mostly in a set of data and other number around this
mode value. Value do mode in sale is nil mean no sale is frequent occur during a 2008 to 2016
Recommendation
From the above table it indicate that sale is after 2009 and there is less increase in sale till
a in 2014. Company sale is decreasing so company need to used a different strategy so that
company sale as well as profit can also increase.
2.3 Analyses the collected data using measure of dispersion
Year Sale profit
2008 1400 400
2009 1340 325
2010 1200 320
2011 1100 280
2012 1250 325
2013 1230 320
2014 1300 300
2015 1320 310
2016 1310 305
STDEV 88 33
CORR 1
Q1 1230 305
Q2 1272 320
Q3 1300 320
Standard deviation: This show a deviation between higher sale and lower sale of a
restaurant. For measuring a standard deviation there is required to calculate the mean of data
set. Then it is required to add all data set and divide it by number of output. In the above table
standard deviation of above table is 88 and 33.
Correlation coefficient: The correlation and coefficient is difference between a two
variable which is difference between a +1 and -1. it show a negative correlation and positive
correlation. In a above table it show between both sale and profit there is a positive correlation.
Percentile:The percentile mainly reflects a percentage which fall below a certain
percentile. In a percentile population is divided on a basis of distribution of values.
7
Paraphrase This Document
Need a fresh take? Get an instant paraphrase of this document with our AI Paraphraser
Quartiles; It is a very useful measurement which is used for measure full set of number
data. In a quartile first one is called lower quartile in this number lies below a 25 percent
(Bryman and Bell, 2015). While in second quartile which lies is called a middle quartile and
have data below a 50 %. lastly in third quartile it is called a upper quartile which have a data
below a 75 %.
2.4 Calculation of all measure of dispersion and useful conclusion
Correlation
Standard deviation : It reflects a deviation between higher sale and lower sale. In a sale
form 2008 to 2016 standard deviation is … which show maximum and minimum sale of
firm.
Quartile 1; In a quartile 1 is represent a first four month sale that is 1230 and profit is 305
Quartile 2: In a quartile sale is increasing as compare to quartile 1, while is not much
increase
Quartile 3: In quartile 3 sale is not high as compare to other both quartile one and quartile
two. Further profit not increase n a quartile 3 and it is equal to quartile 1.
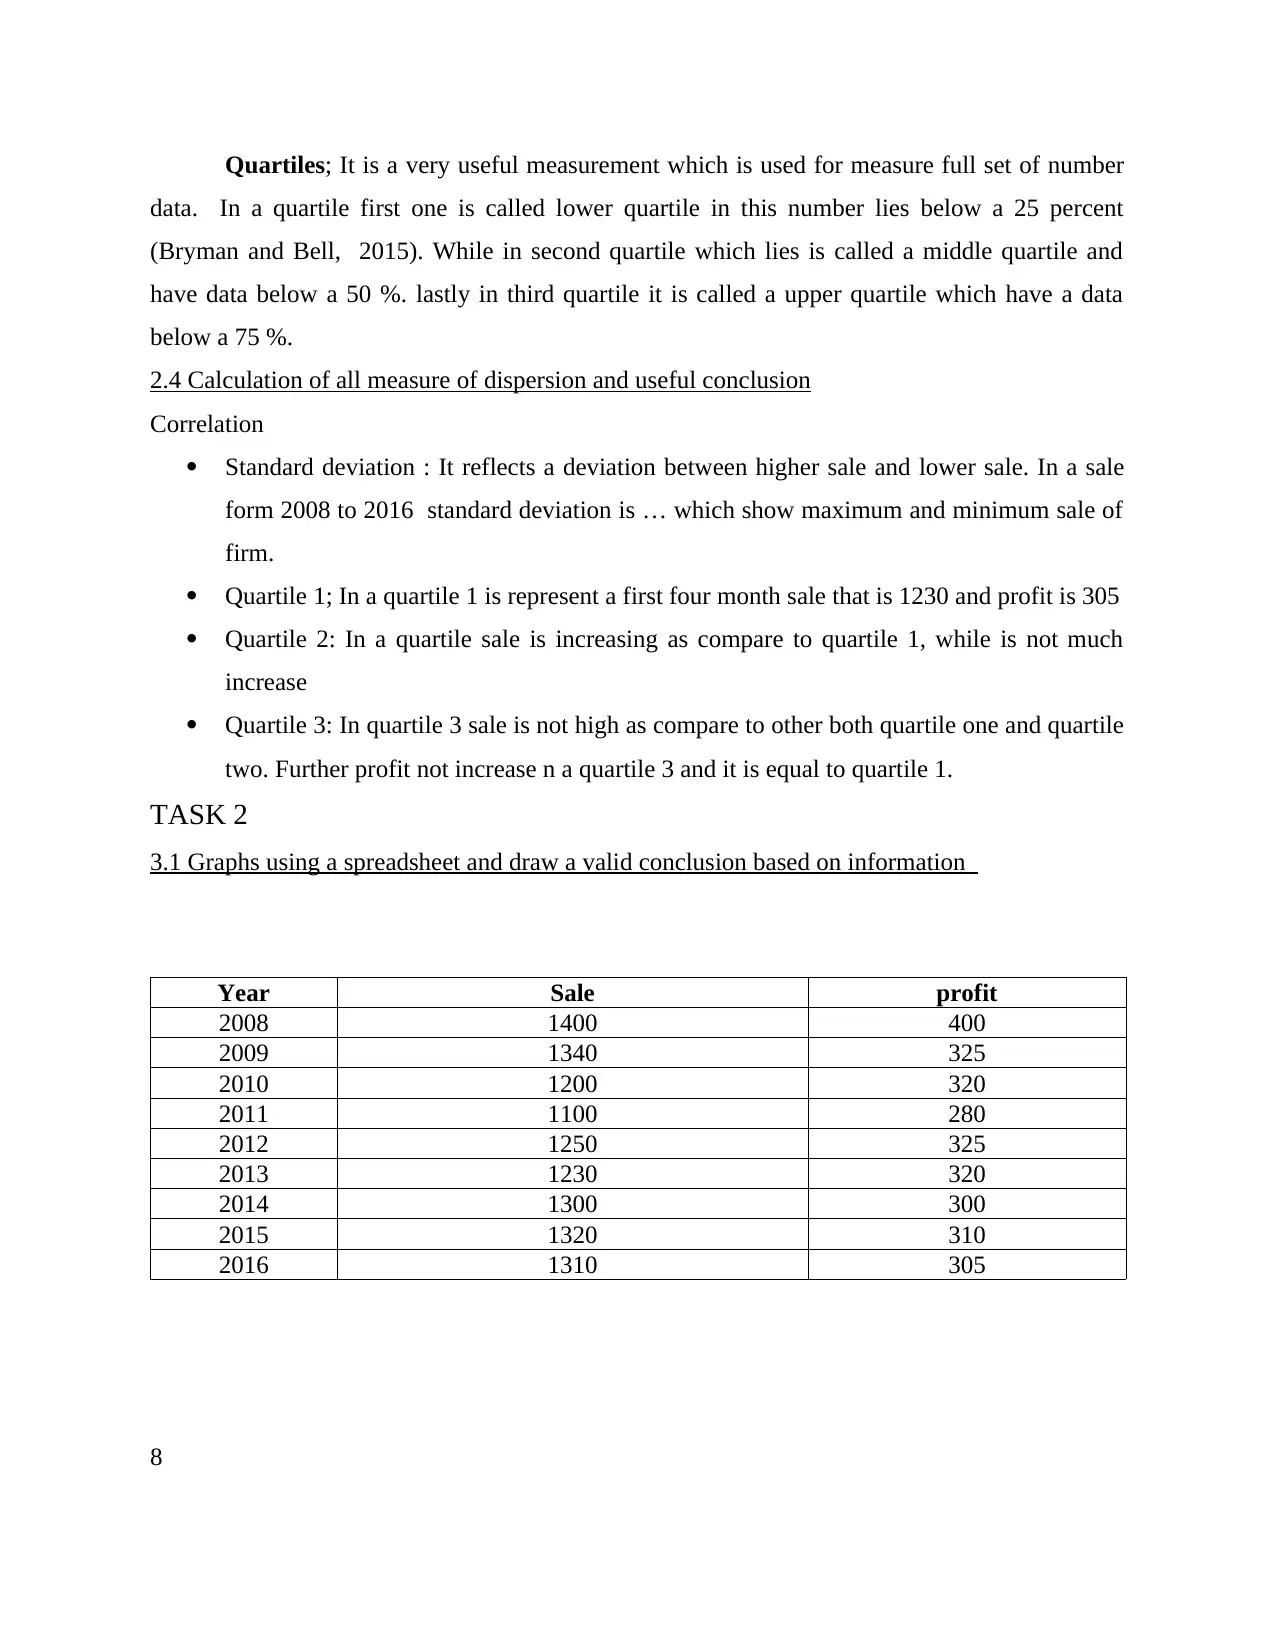
TASK 2
3.1 Graphs using a spreadsheet and draw a valid conclusion based on information
Year Sale profit
2008 1400 400
2009 1340 325
2010 1200 320
2011 1100 280
2012 1250 325
2013 1230 320
2014 1300 300
2015 1320 310
2016 1310 305
8
data. In a quartile first one is called lower quartile in this number lies below a 25 percent
(Bryman and Bell, 2015). While in second quartile which lies is called a middle quartile and
have data below a 50 %. lastly in third quartile it is called a upper quartile which have a data
below a 75 %.
2.4 Calculation of all measure of dispersion and useful conclusion
Correlation
Standard deviation : It reflects a deviation between higher sale and lower sale. In a sale
form 2008 to 2016 standard deviation is … which show maximum and minimum sale of
firm.
Quartile 1; In a quartile 1 is represent a first four month sale that is 1230 and profit is 305
Quartile 2: In a quartile sale is increasing as compare to quartile 1, while is not much
increase
Quartile 3: In quartile 3 sale is not high as compare to other both quartile one and quartile
two. Further profit not increase n a quartile 3 and it is equal to quartile 1.
TASK 2
3.1 Graphs using a spreadsheet and draw a valid conclusion based on information
Year Sale profit
2008 1400 400
2009 1340 325
2010 1200 320
2011 1100 280
2012 1250 325
2013 1230 320
2014 1300 300
2015 1320 310
2016 1310 305
8
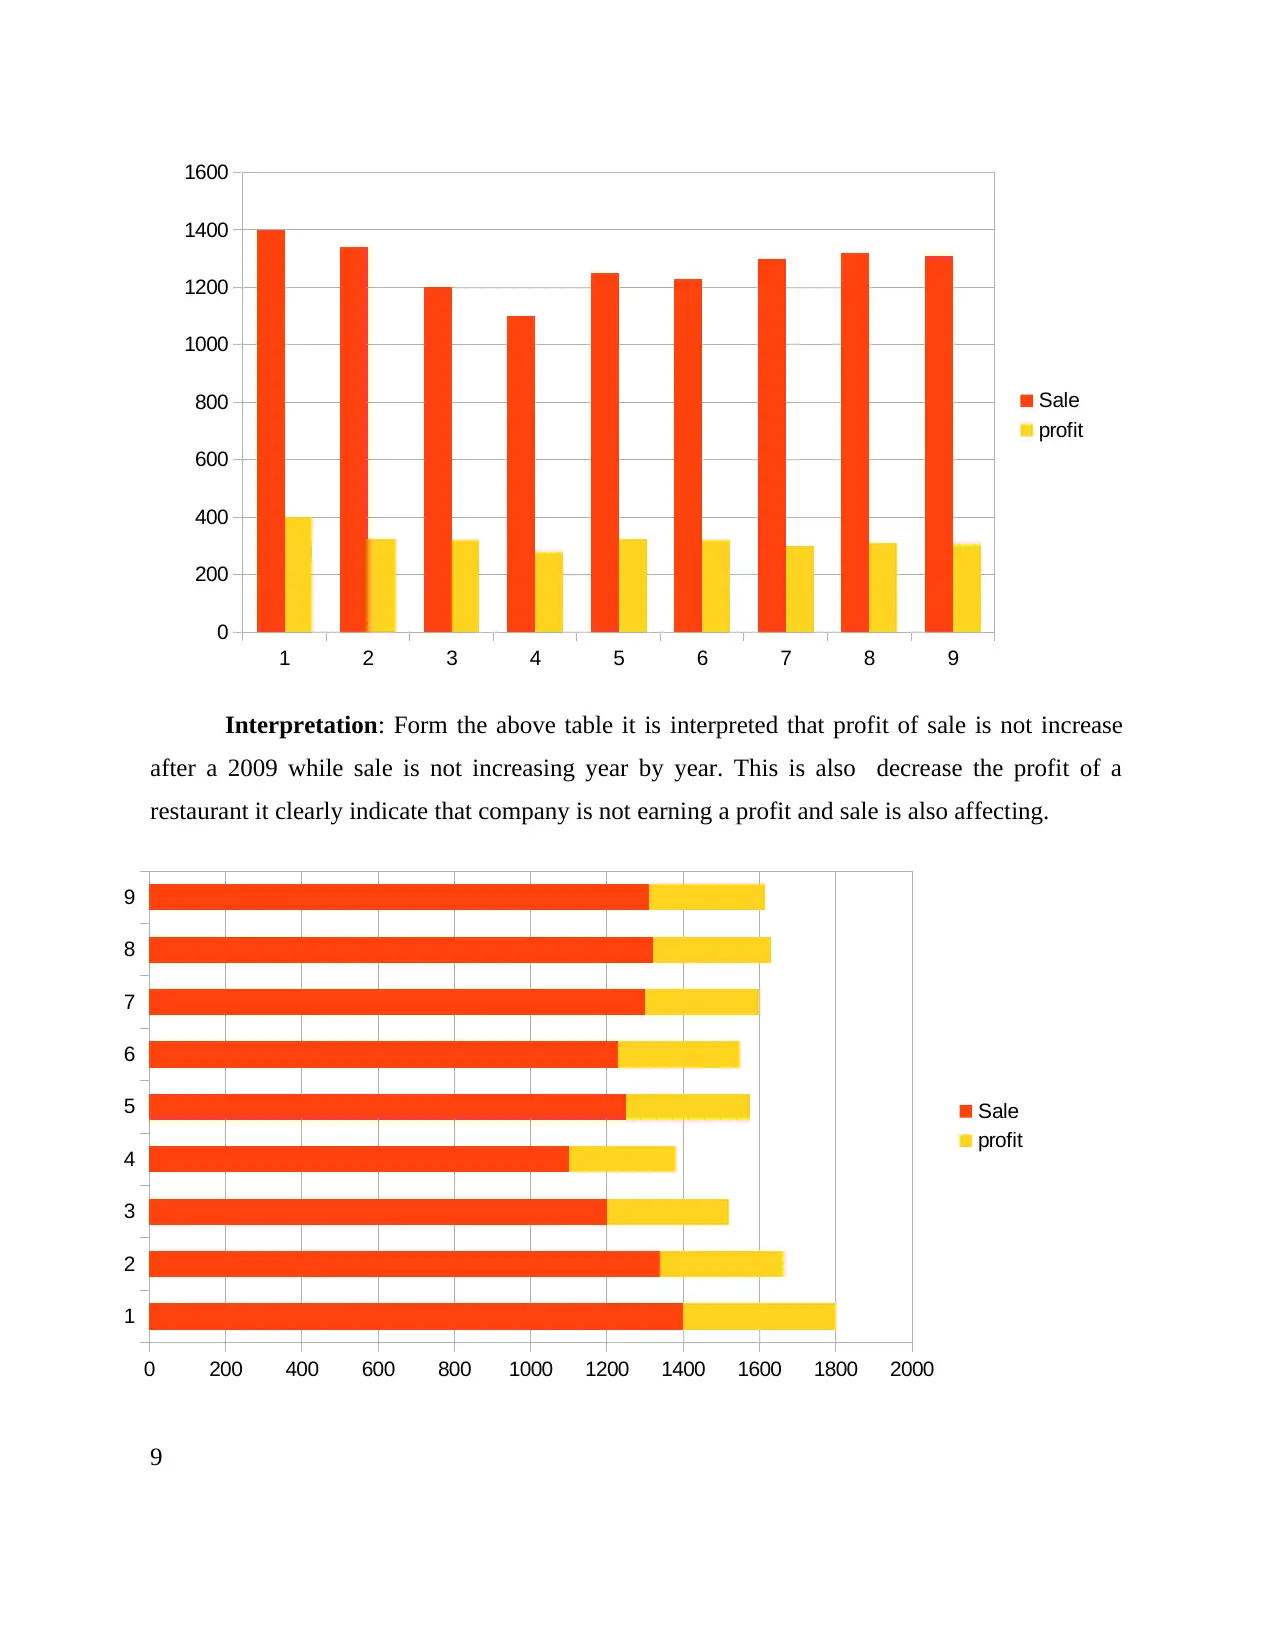
Interpretation: Form the above table it is interpreted that profit of sale is not increase
after a 2009 while sale is not increasing year by year. This is also decrease the profit of a
restaurant it clearly indicate that company is not earning a profit and sale is also affecting.
9
1 2 3 4 5 6 7 8 9
0
200
400
600
800
1000
1200
1400
1600
Sale
profit
1
2
3
4
5
6
7
8
9
0 200 400 600 800 1000 1200 1400 1600 1800 2000
Sale
profit
⊘ This is a preview!⊘
Do you want full access?
Subscribe today to unlock all pages.
Trusted by 1+ million students worldwide
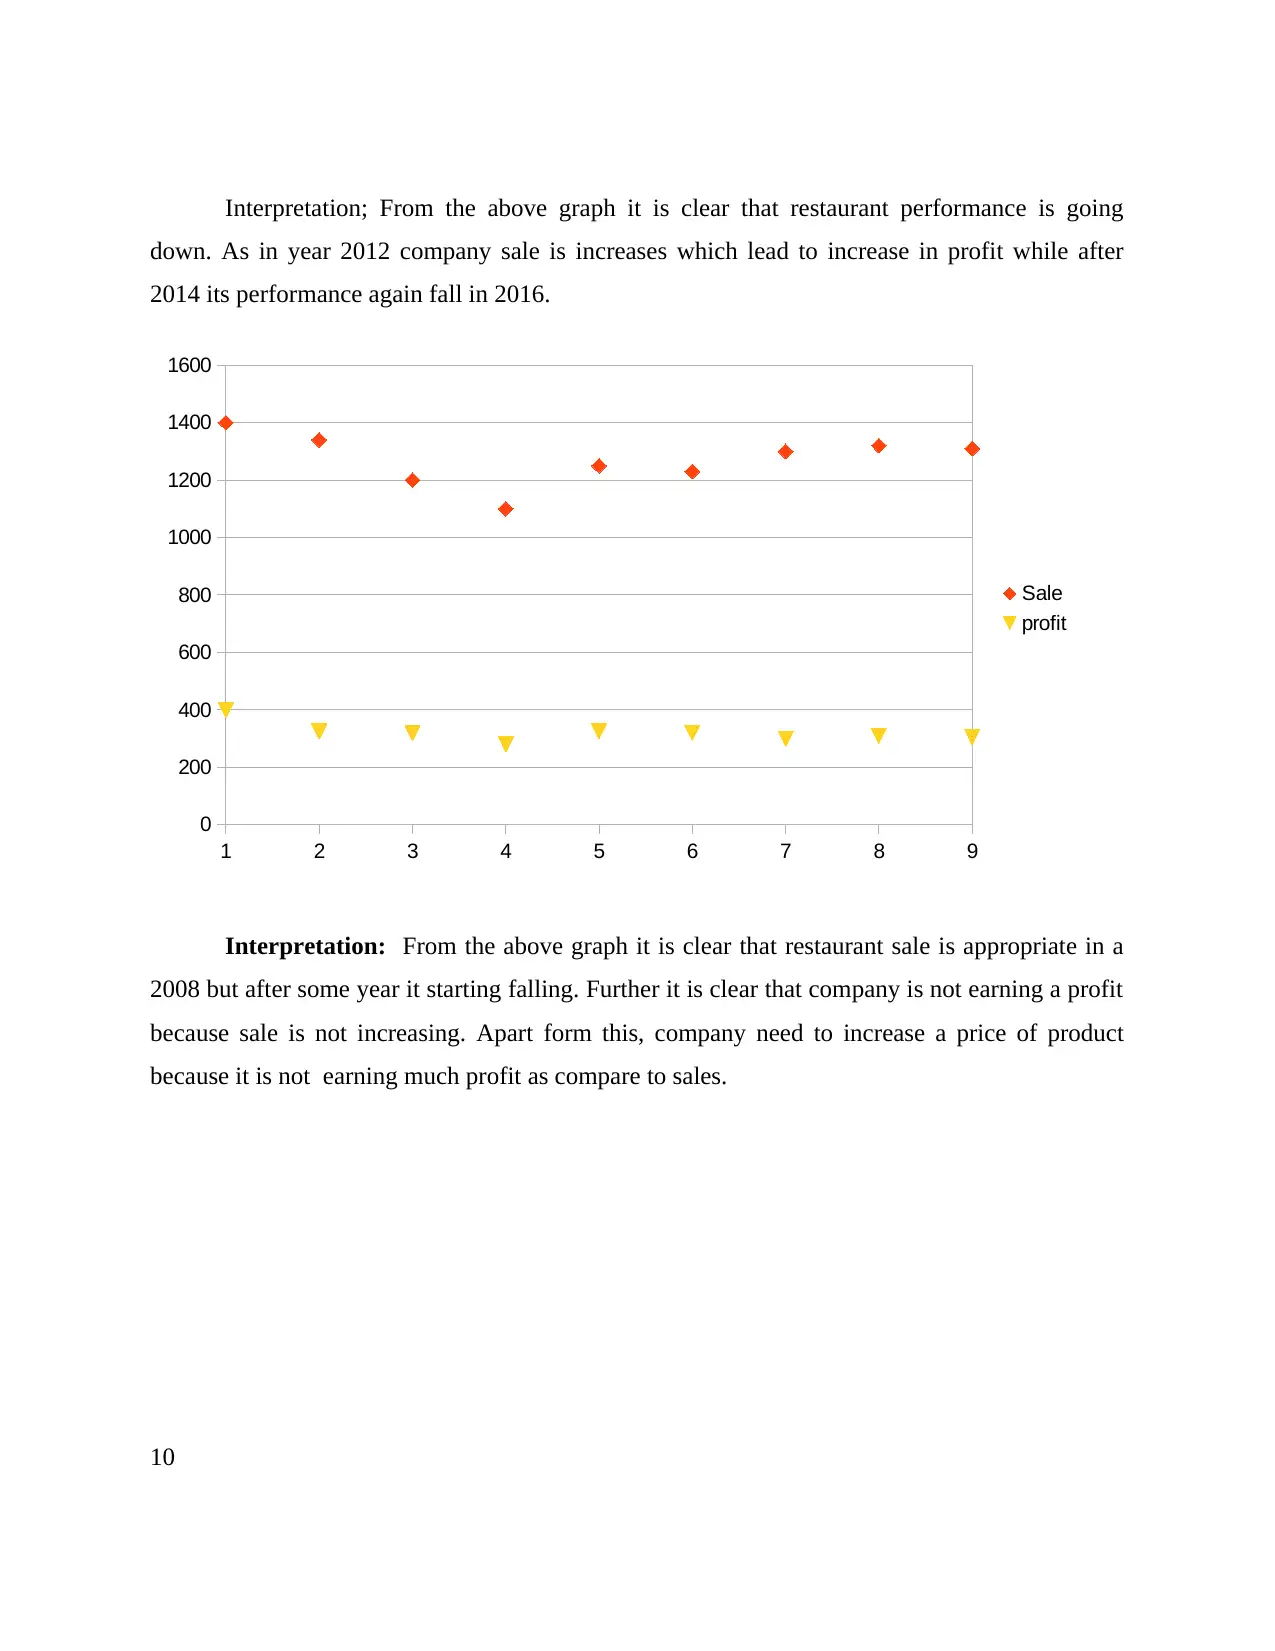
Interpretation; From the above graph it is clear that restaurant performance is going
down. As in year 2012 company sale is increases which lead to increase in profit while after
2014 its performance again fall in 2016.
Interpretation: From the above graph it is clear that restaurant sale is appropriate in a
2008 but after some year it starting falling. Further it is clear that company is not earning a profit
because sale is not increasing. Apart form this, company need to increase a price of product
because it is not earning much profit as compare to sales.
10
1 2 3 4 5 6 7 8 9
0
200
400
600
800
1000
1200
1400
1600
Sale
profit
Paraphrase This Document
Need a fresh take? Get an instant paraphrase of this document with our AI Paraphraser
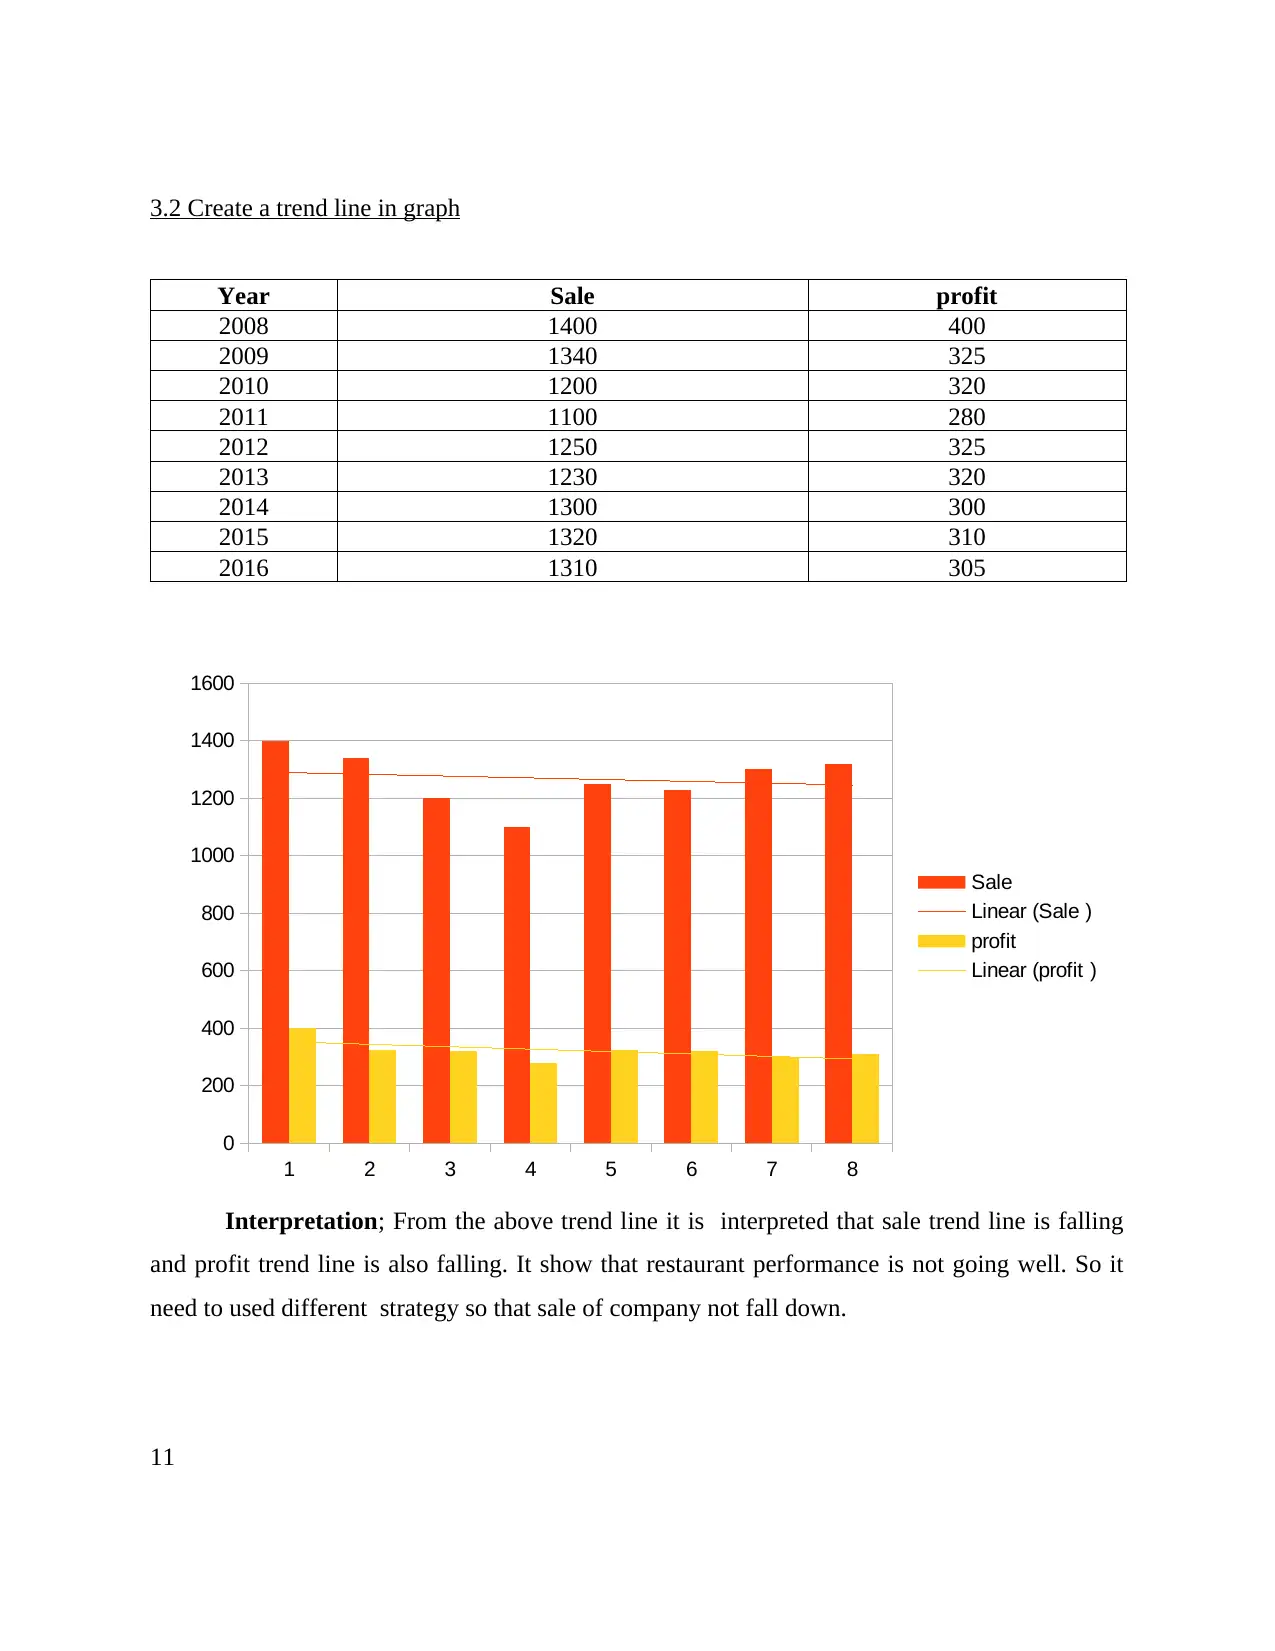
3.2 Create a trend line in graph
Year Sale profit
2008 1400 400
2009 1340 325
2010 1200 320
2011 1100 280
2012 1250 325
2013 1230 320
2014 1300 300
2015 1320 310
2016 1310 305
Interpretation; From the above trend line it is interpreted that sale trend line is falling
and profit trend line is also falling. It show that restaurant performance is not going well. So it
need to used different strategy so that sale of company not fall down.
11
1 2 3 4 5 6 7 8
0
200
400
600
800
1000
1200
1400
1600
Sale
Linear (Sale )
profit
Linear (profit )
3.3 Covered in Ppt
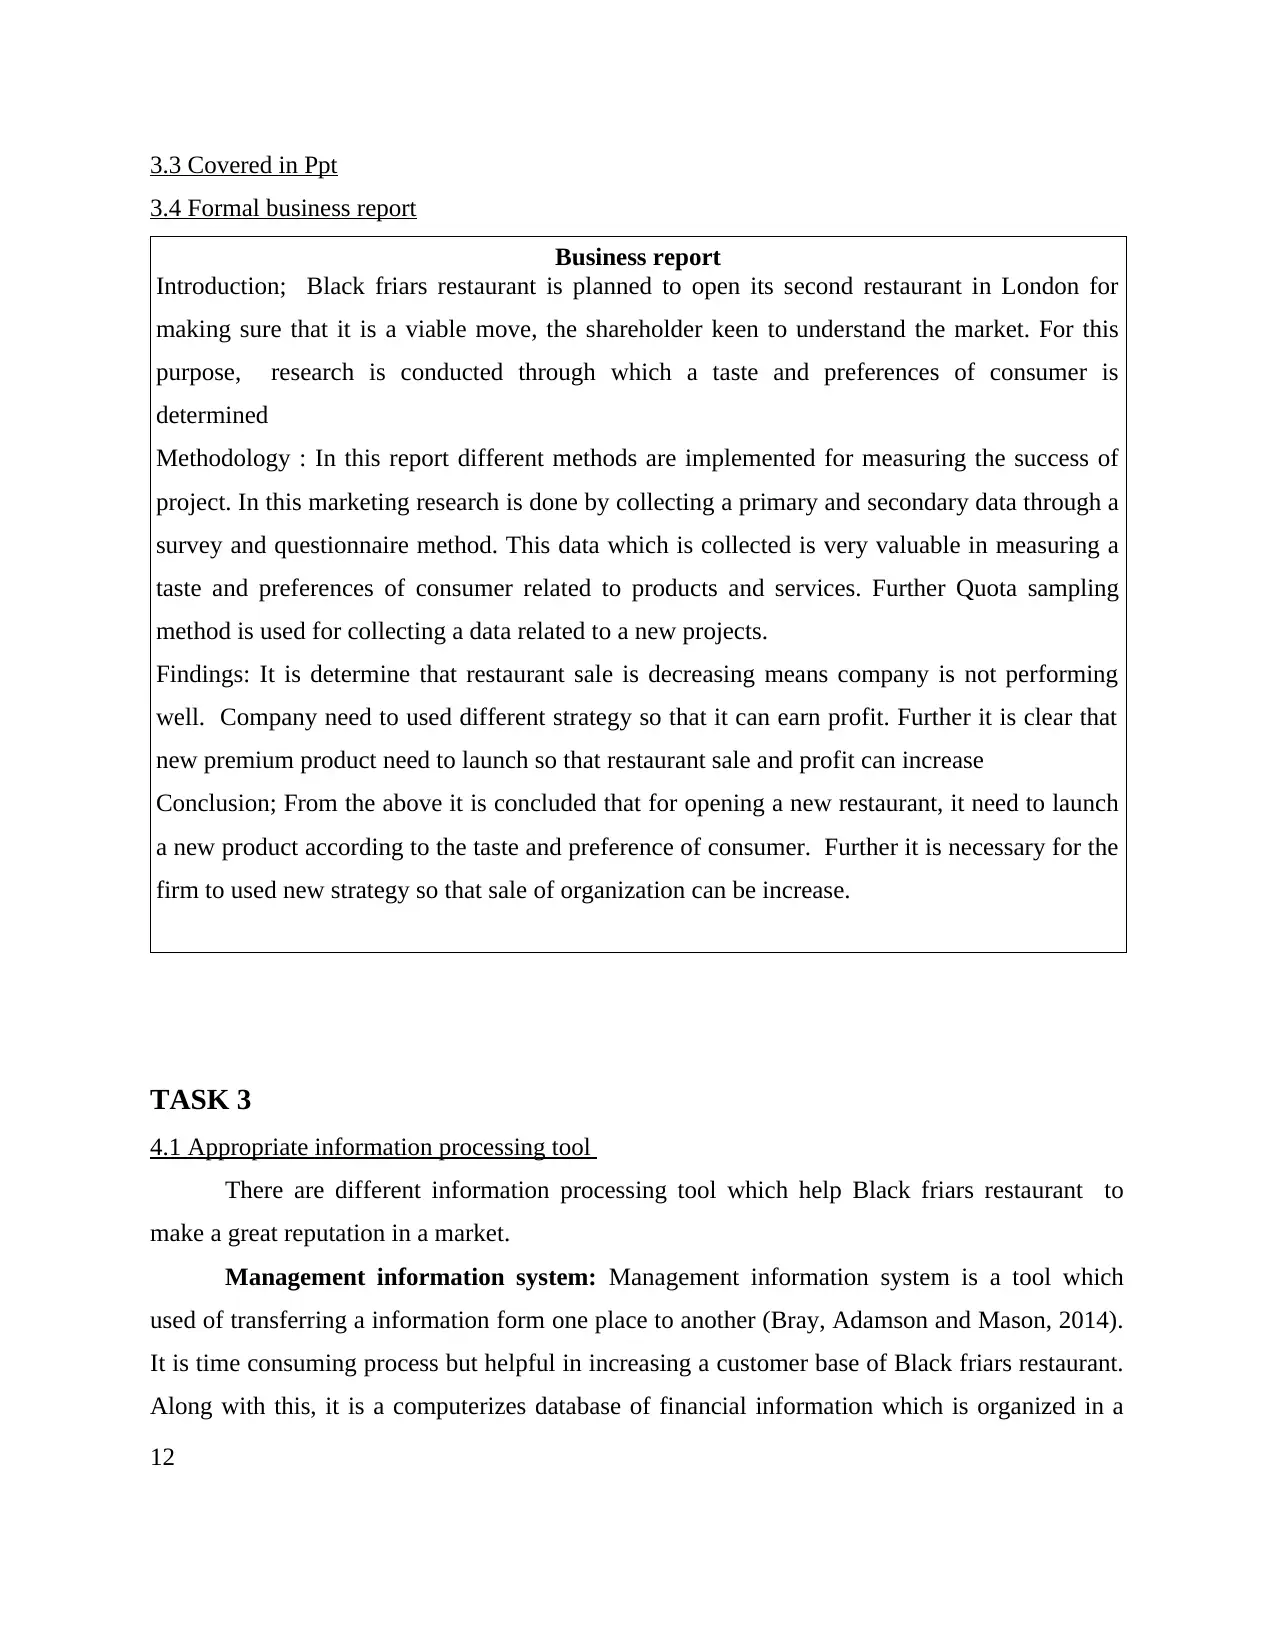
3.4 Formal business report
Business report
Introduction; Black friars restaurant is planned to open its second restaurant in London for
making sure that it is a viable move, the shareholder keen to understand the market. For this
purpose, research is conducted through which a taste and preferences of consumer is
determined
Methodology : In this report different methods are implemented for measuring the success of
project. In this marketing research is done by collecting a primary and secondary data through a
survey and questionnaire method. This data which is collected is very valuable in measuring a
taste and preferences of consumer related to products and services. Further Quota sampling
method is used for collecting a data related to a new projects.
Findings: It is determine that restaurant sale is decreasing means company is not performing
well. Company need to used different strategy so that it can earn profit. Further it is clear that
new premium product need to launch so that restaurant sale and profit can increase
Conclusion; From the above it is concluded that for opening a new restaurant, it need to launch
a new product according to the taste and preference of consumer. Further it is necessary for the
firm to used new strategy so that sale of organization can be increase.
TASK 3
4.1 Appropriate information processing tool
There are different information processing tool which help Black friars restaurant to
make a great reputation in a market.
Management information system: Management information system is a tool which
used of transferring a information form one place to another (Bray, Adamson and Mason, 2014).
It is time consuming process but helpful in increasing a customer base of Black friars restaurant.
Along with this, it is a computerizes database of financial information which is organized in a
12
⊘ This is a preview!⊘
Do you want full access?
Subscribe today to unlock all pages.
Trusted by 1+ million students worldwide
1 out of 17
Related Documents


Your All-in-One AI-Powered Toolkit for Academic Success.
+13062052269
info@desklib.com
Available 24*7 on WhatsApp / Email
![[object Object]](/_next/static/media/star-bottom.7253800d.svg)
Unlock your academic potential
Copyright © 2020–2026 A2Z Services. All Rights Reserved. Developed and managed by ZUCOL.