Business Decision Making Report: Analysis for Black Friars Restaurant

Verified

Added on  2023/03/31

|14
|683
|252
Report
AI Summary
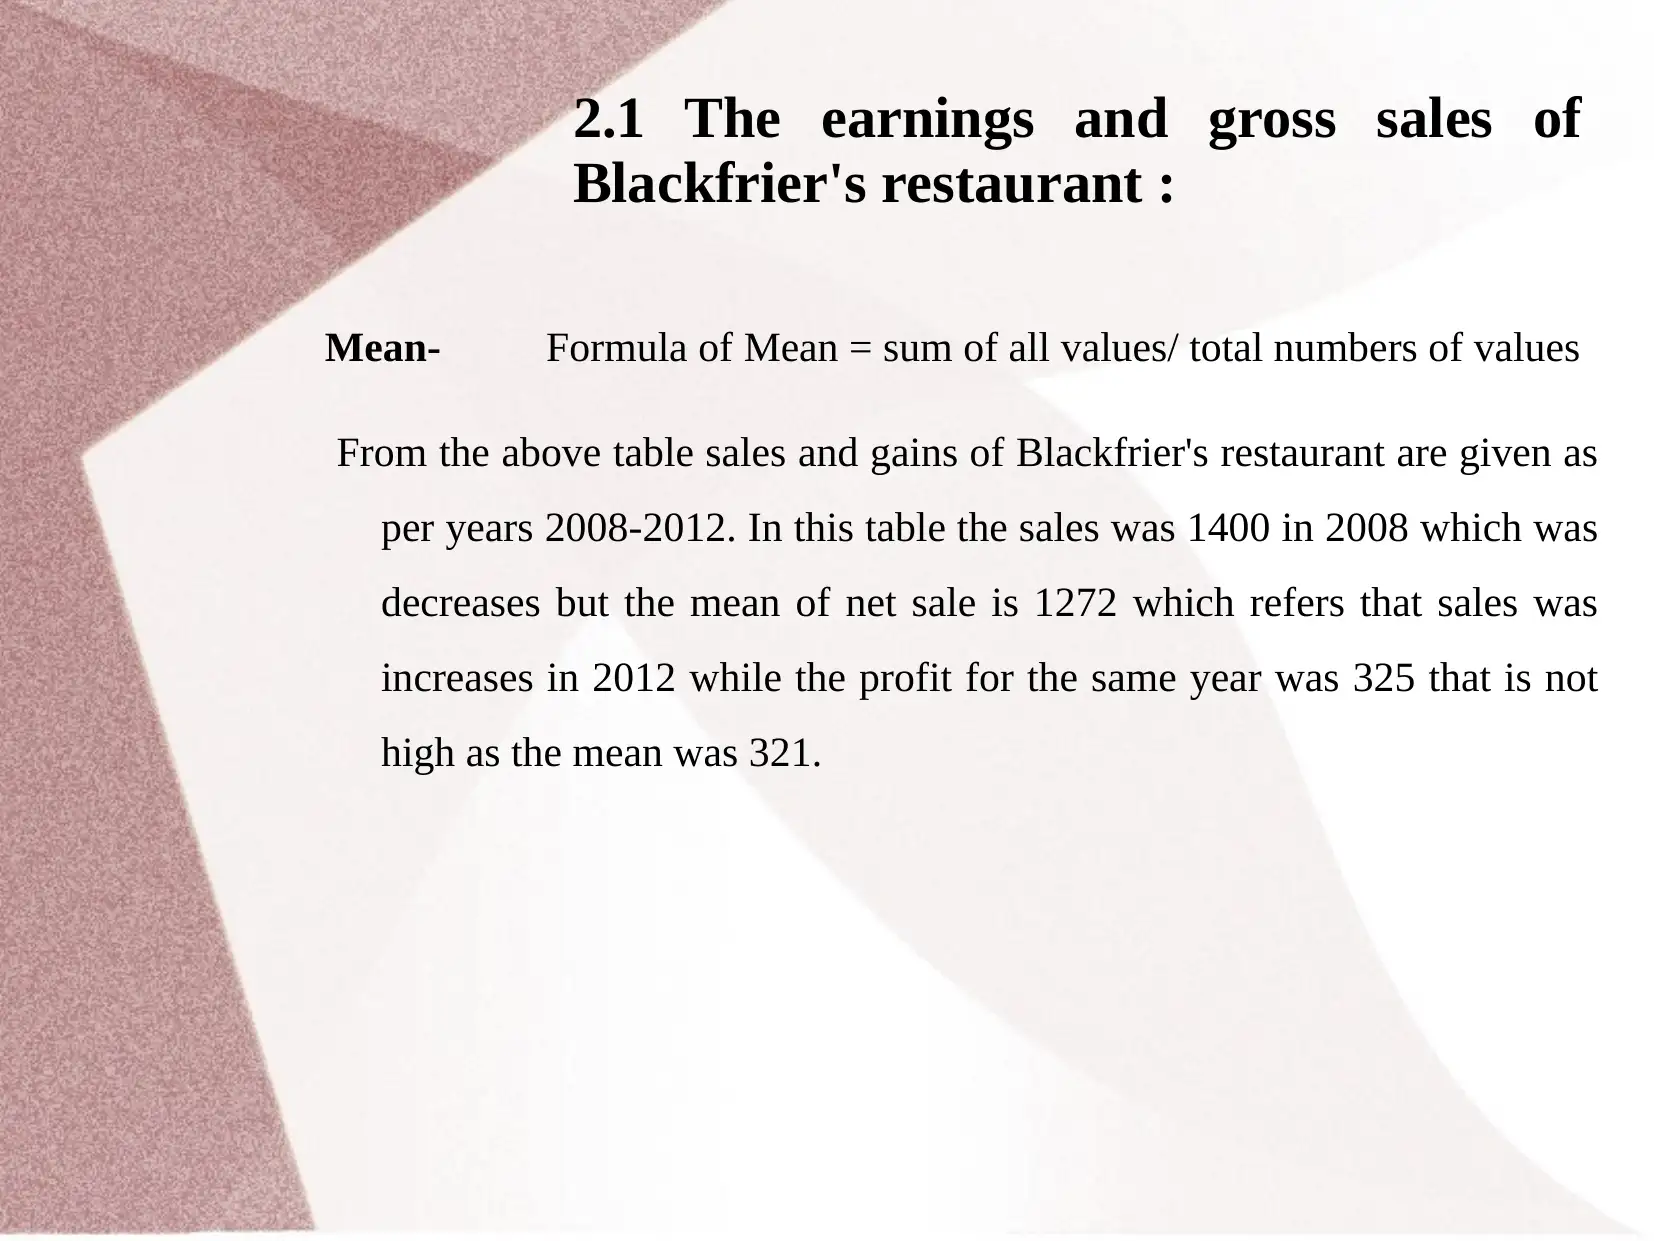
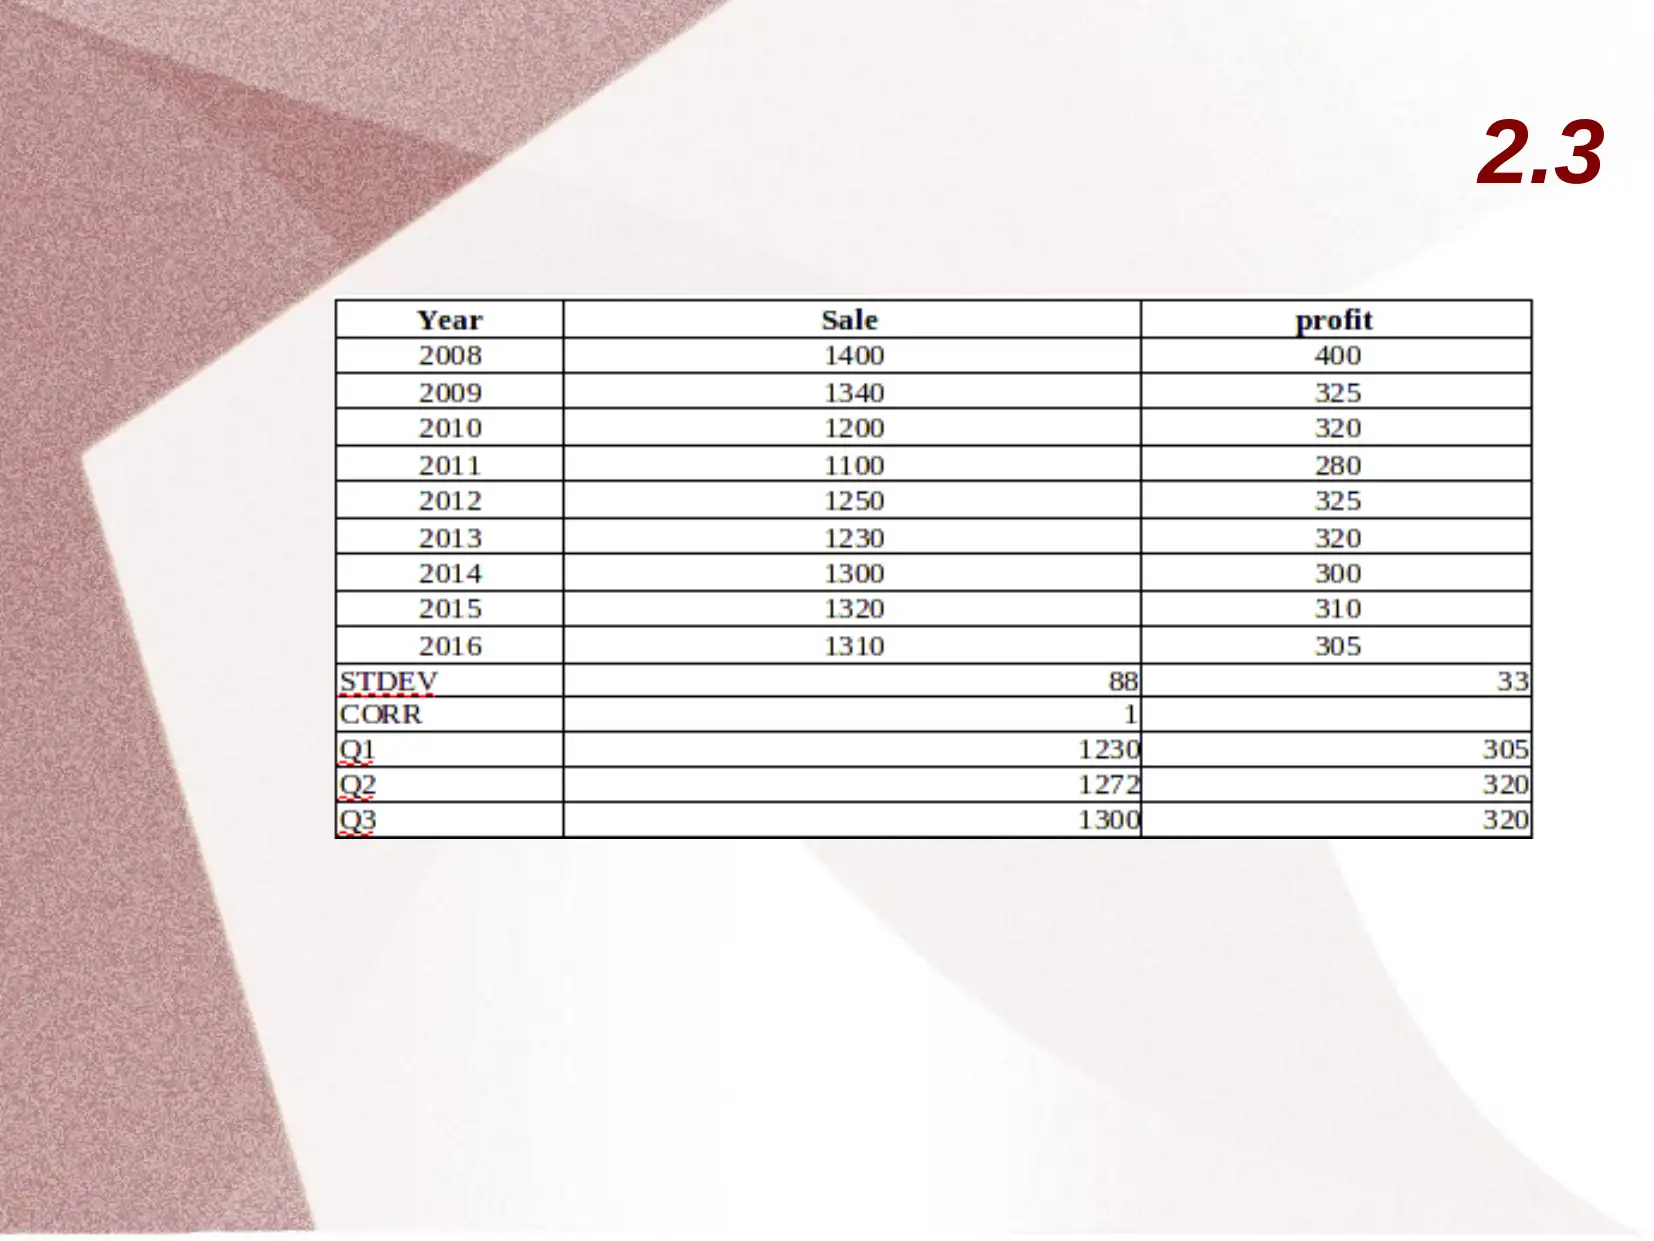
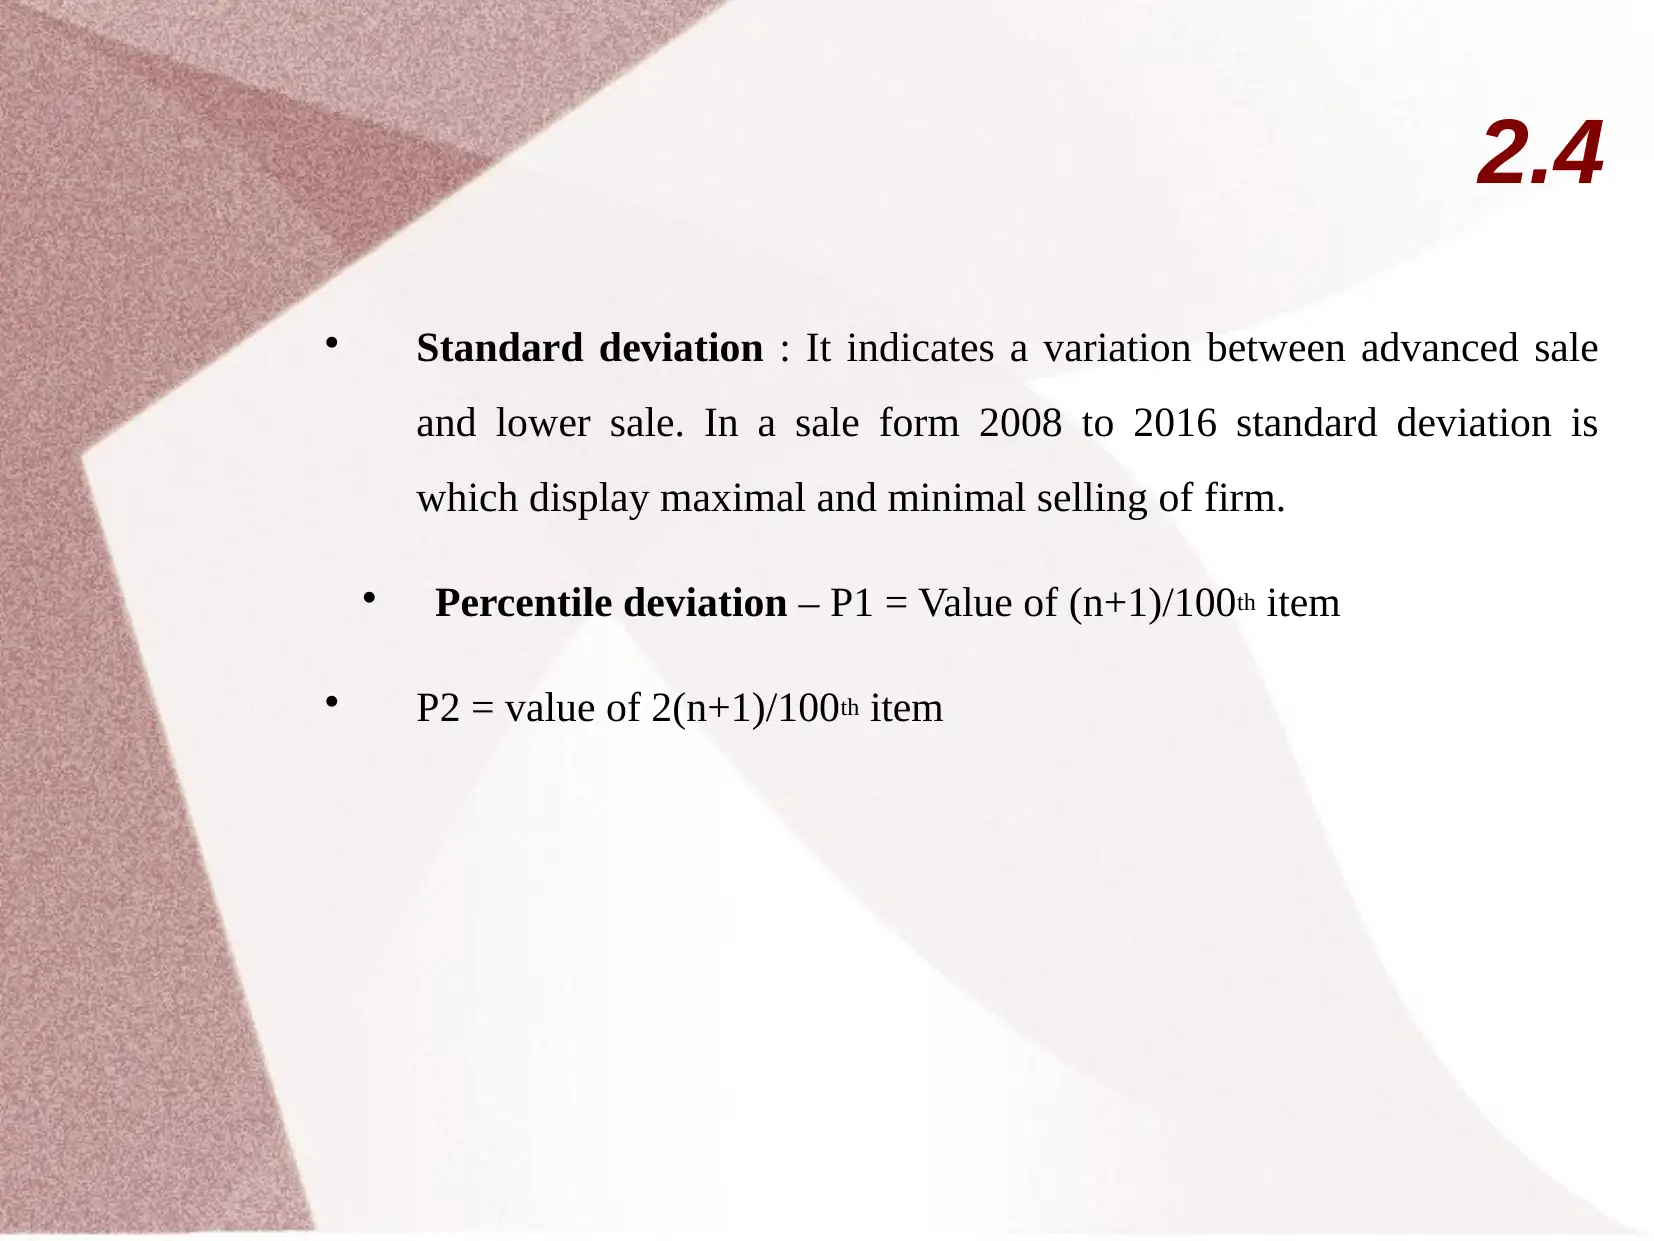
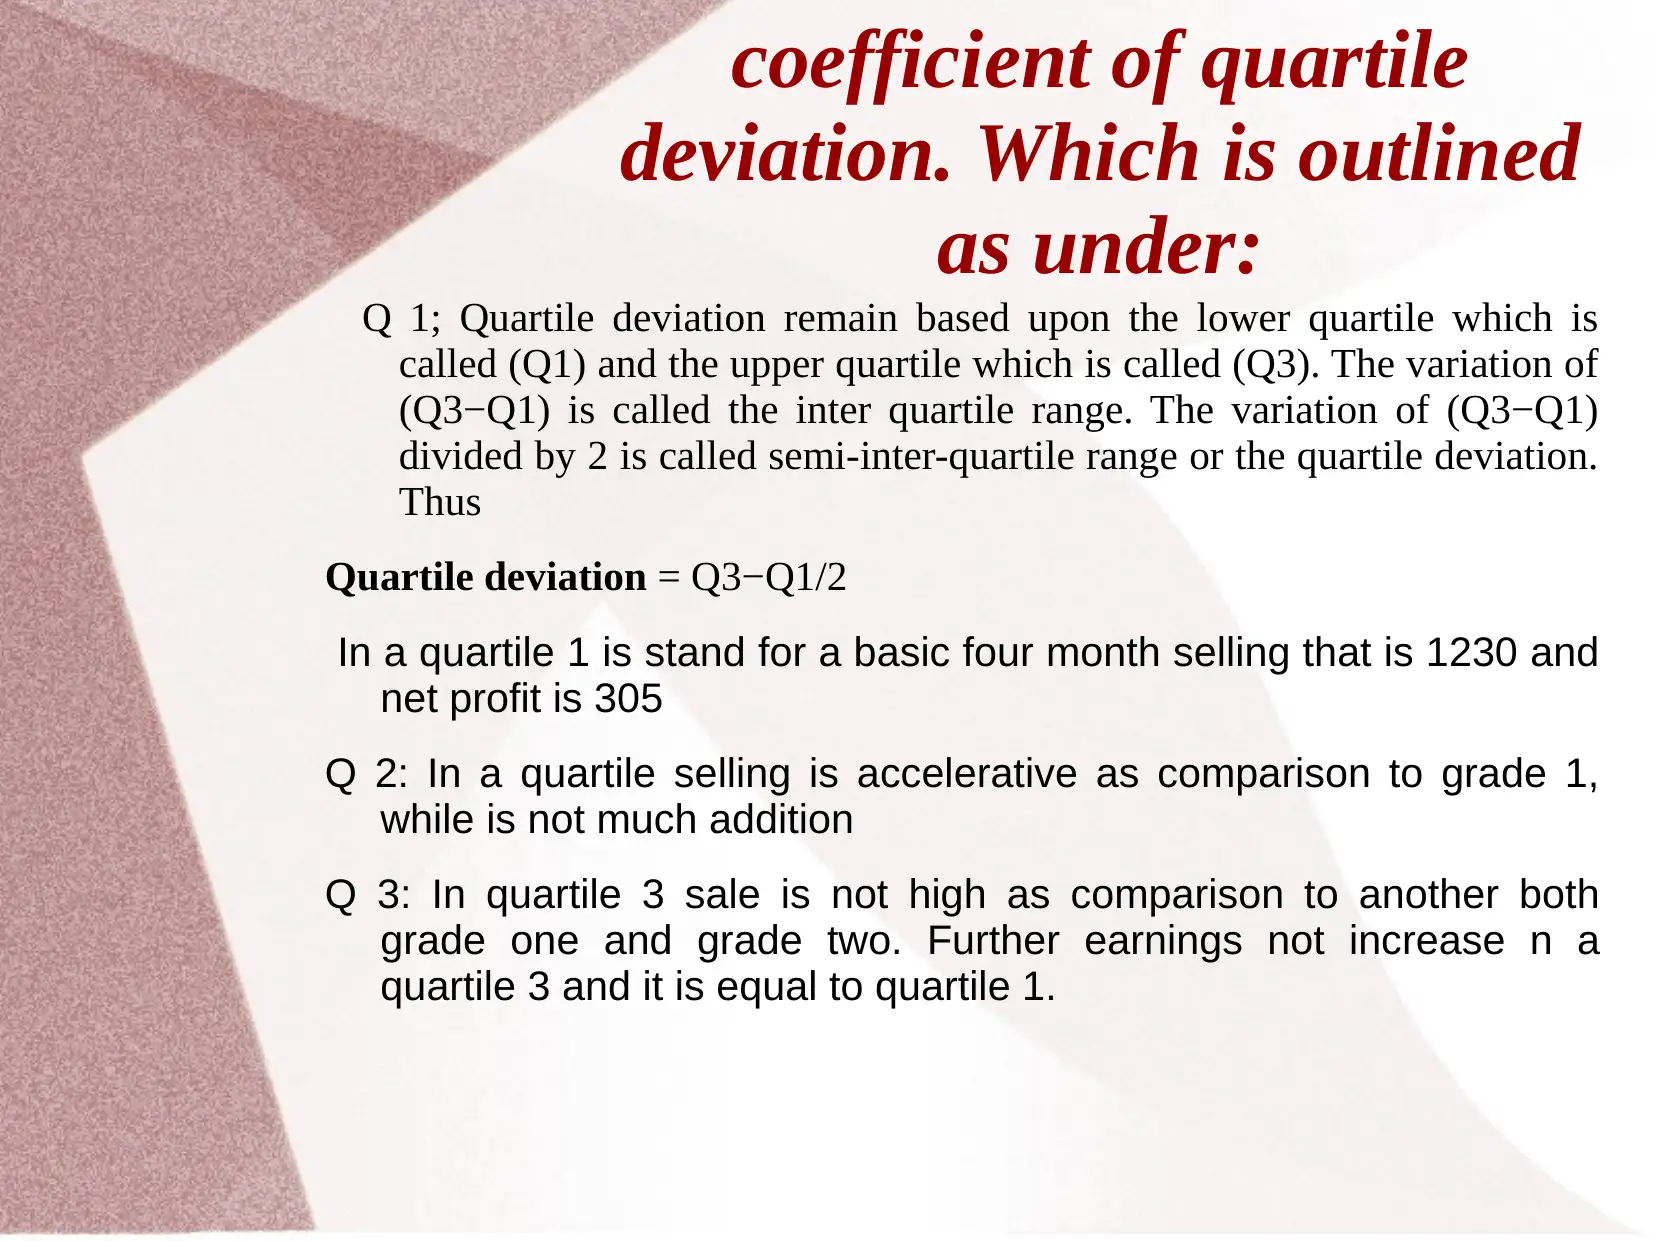
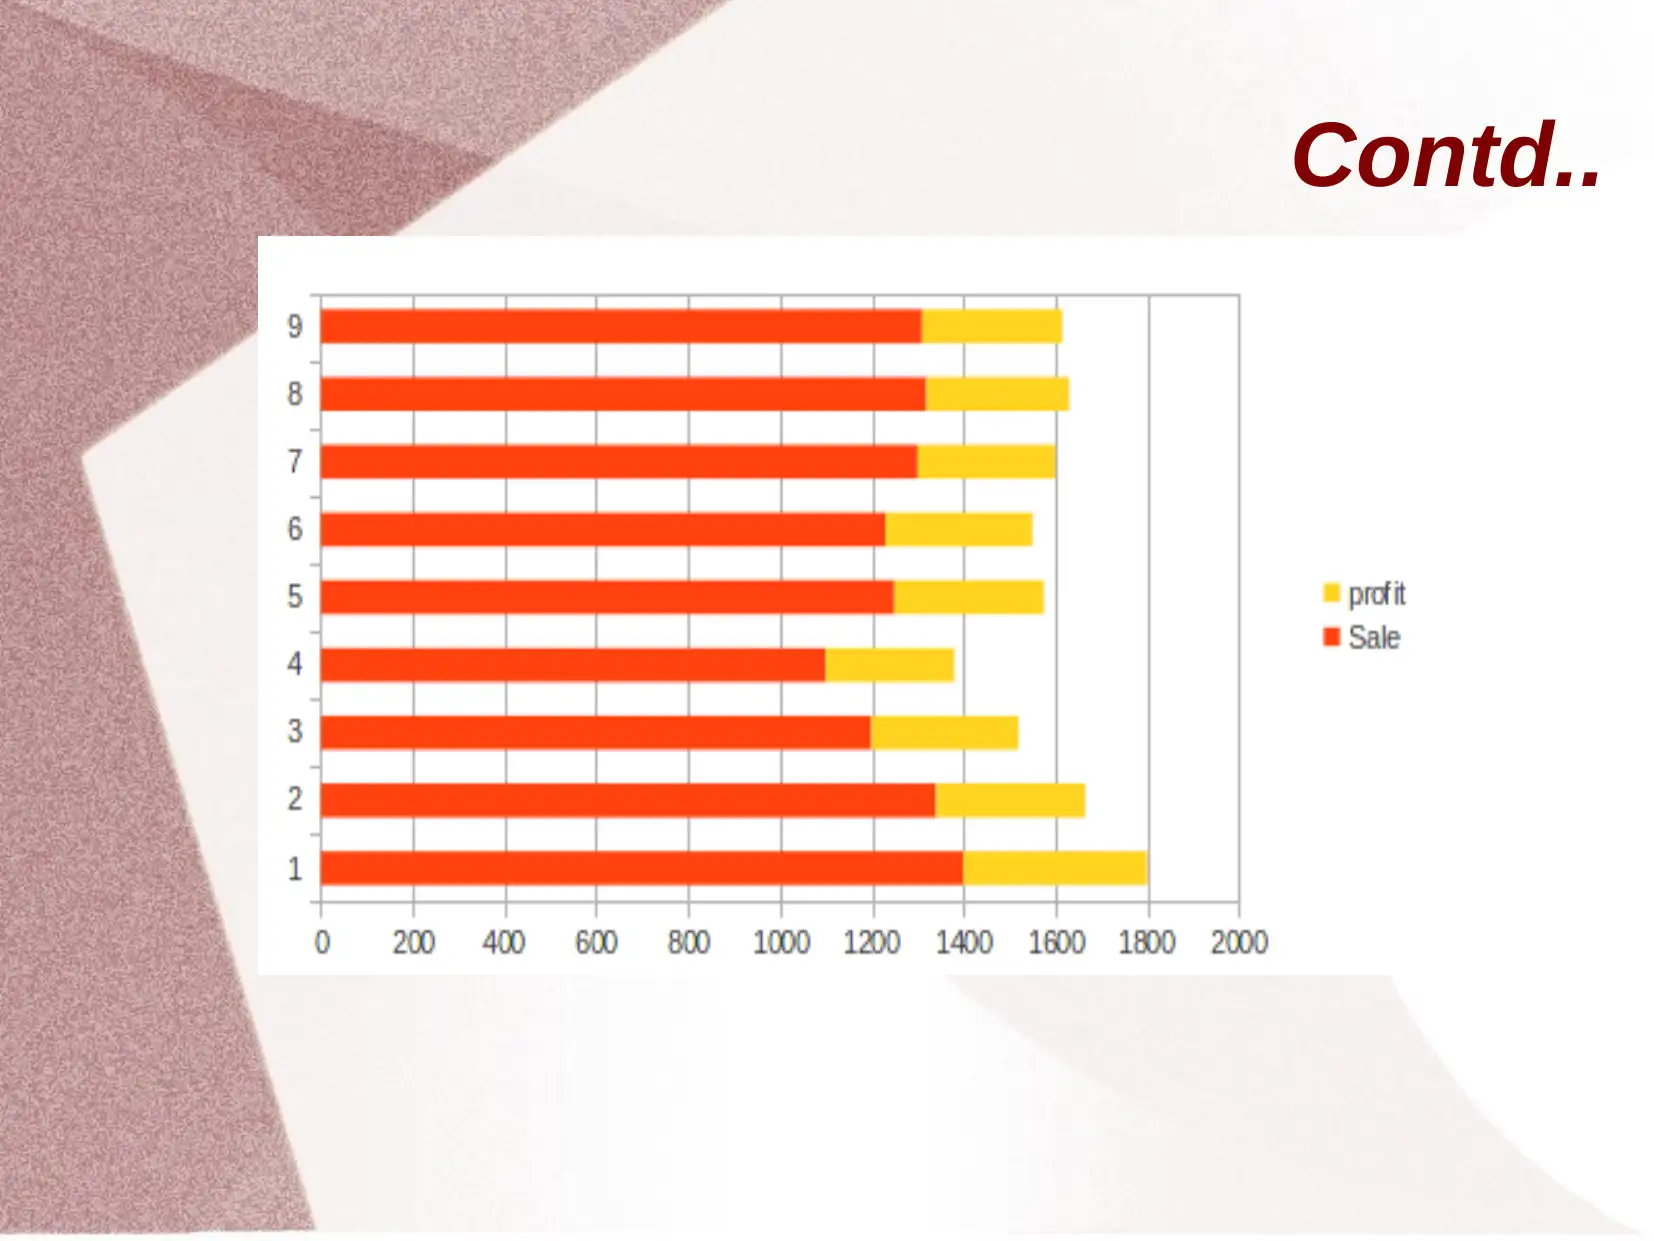
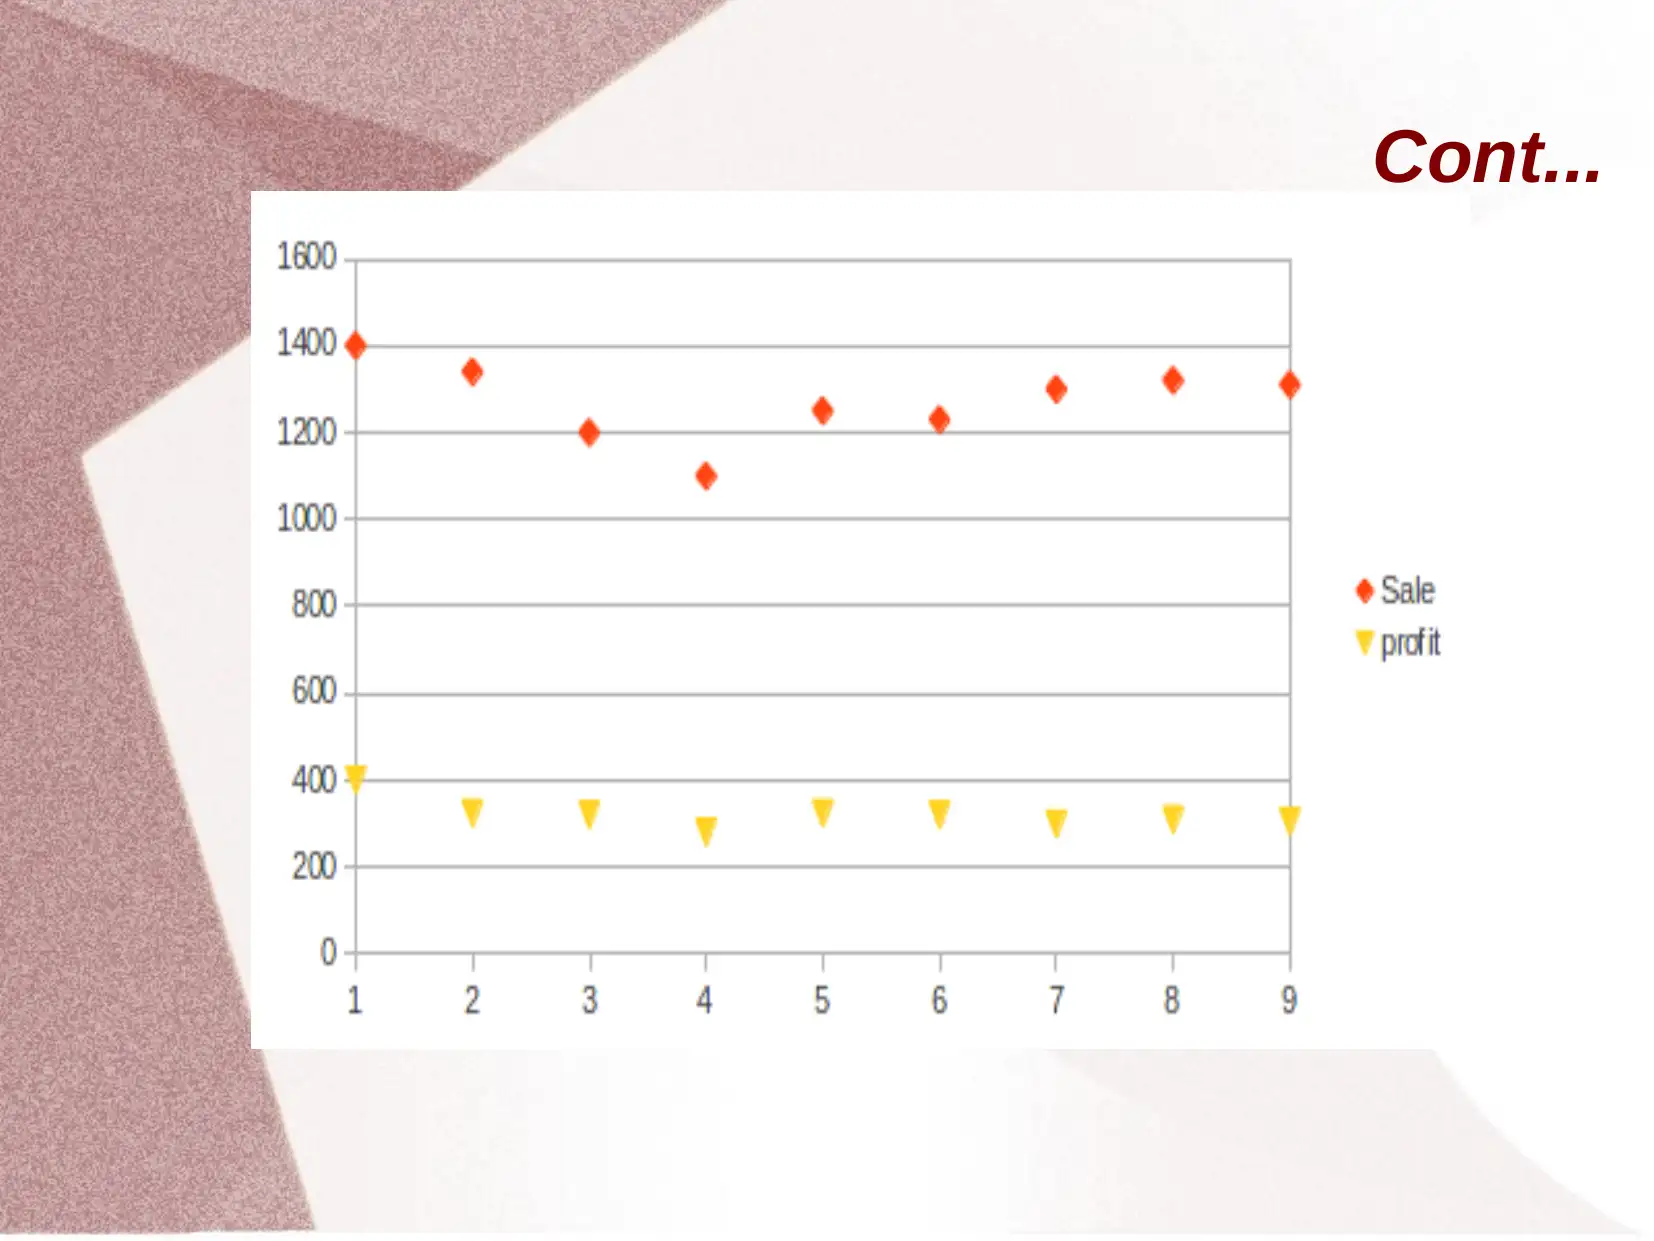
This report presents an analysis of Black Friars Restaurant, focusing on business decision-making through primary and secondary research methods. The assignment details the collection of primary data via surveys and interviews to understand customer preferences and demands. Secondary data, sourced from books and journals, complements the primary research by providing qualitative and quantitative information. The report explores survey methodologies used to analyze consumer needs and wants, including questionnaires and observations. Furthermore, it examines the restaurant's earnings and gross sales from 2008 to 2012, calculating mean, mode, median, standard deviation, percentile deviation, and quartile deviation to assess sales and profit trends. The analysis reveals insights into sales fluctuations, profit margins, and variations between advanced and lower sales periods. The report concludes with a list of references that support the research and analysis conducted.
Document Page
Part 3
Business decision Making
tabler-icon-diamond-filled.svg

Paraphrase This Document

Need a fresh take? Get an instant paraphrase of this document with our AI Paraphraser
Document Page
Primary Research
Primary data are all such data which are collected in first time in an
organisation. Primary data are collected by making effective survey,
interview, calls etc.
n this way, these methods are very useful to Black Friars restaurant, so
that by using such methods for collecting the primary data;
it provides enough information about there customers and there demand,
taste and preferences.
Primary Research Questionnaire
Document Page
Secondary Research
Secondary data are those data which are already collected but by
making some alternation collected information are used in the form of
secondary data.
In this all the information and data are collected by using books,
journals etc.
Another reason of collecting the secondary data is that it includes both
the qualitative and quantitative data for gathering the information, so
that it is beneficial for the Black friars restaurant.
Secondary Research Books, Journals etc.
Document Page
Survey Methodology:
In terms of making the operational development as well as expansion
of the business there is ned to analyse the preferences, choices and
wants of consumers.
Thus, with the help of various survey methodology the restaurant will
become able to make the adequate analyses of the needs and wants of
consumers such as questionnaire, interviews and the daily
observations.
tabler-icon-diamond-filled.svg

Paraphrase This Document

Need a fresh take? Get an instant paraphrase of this document with our AI Paraphraser
Document Page
2.1 The earnings and gross sales of
Blackfrier's restaurant :
Mean- Formula of Mean = sum of all values/ total numbers of values
From the above table sales and gains of Blackfrier's restaurant are given as
per years 2008-2012. In this table the sales was 1400 in 2008 which was
decreases but the mean of net sale is 1272 which refers that sales was
increases in 2012 while the profit for the same year was 325 that is not
high as the mean was 321.
Document Page
Mode
Mode- Mode is a value which are highly repeated in a series so that in
Sales there is no repetitive value so the the mode is 0 in sale but in profit
series 320 is highly repetitive value so that the mode is 320 in profit
series.
Mode = most common value
Document Page
Median-
Median in sale series was 1300 and in profit it is 320, which means the
sales was increases in 2008 to 2012 but there were no change in profit
which means that profit is not high during this period.
Median = n/2- CF /f(w)+Lm
Middle value (when the data are arranged)
tabler-icon-diamond-filled.svg

Paraphrase This Document

Need a fresh take? Get an instant paraphrase of this document with our AI Paraphraser
Document Page
2.3
Document Page
2.4
Standard deviation : It indicates a variation between advanced sale
and lower sale. In a sale form 2008 to 2016 standard deviation is
which display maximal and minimal selling of firm.
Percentile deviation – P1 = Value of (n+1)/100th item
P2 = value of 2(n+1)/100th item
Document Page
coefficient of quartile
deviation. Which is outlined
as under:
Q 1; Quartile deviation remain based upon the lower quartile which is
called (Q1) and the upper quartile which is called (Q3). The variation of
(Q3−Q1) is called the inter quartile range. The variation of (Q3−Q1)
divided by 2 is called semi-inter-quartile range or the quartile deviation.
Thus
Quartile deviation = Q3−Q1/2
In a quartile 1 is stand for a basic four month selling that is 1230 and
net profit is 305
Q 2: In a quartile selling is accelerative as comparison to grade 1,
while is not much addition
Q 3: In quartile 3 sale is not high as comparison to another both
grade one and grade two. Further earnings not increase n a
quartile 3 and it is equal to quartile 1.
tabler-icon-diamond-filled.svg

Paraphrase This Document

Need a fresh take? Get an instant paraphrase of this document with our AI Paraphraser
Document Page
Contd..
Document Page
Cont...
chevron_up_icon
1 out of 14
circle_padding
hide_on_mobile
zoom_out_icon
[object Object]