Investigating Black Friday Purchasing Patterns: Data Analysis Report
VerifiedAdded on  2023/01/19
|21
|3143
|68
Report
AI Summary
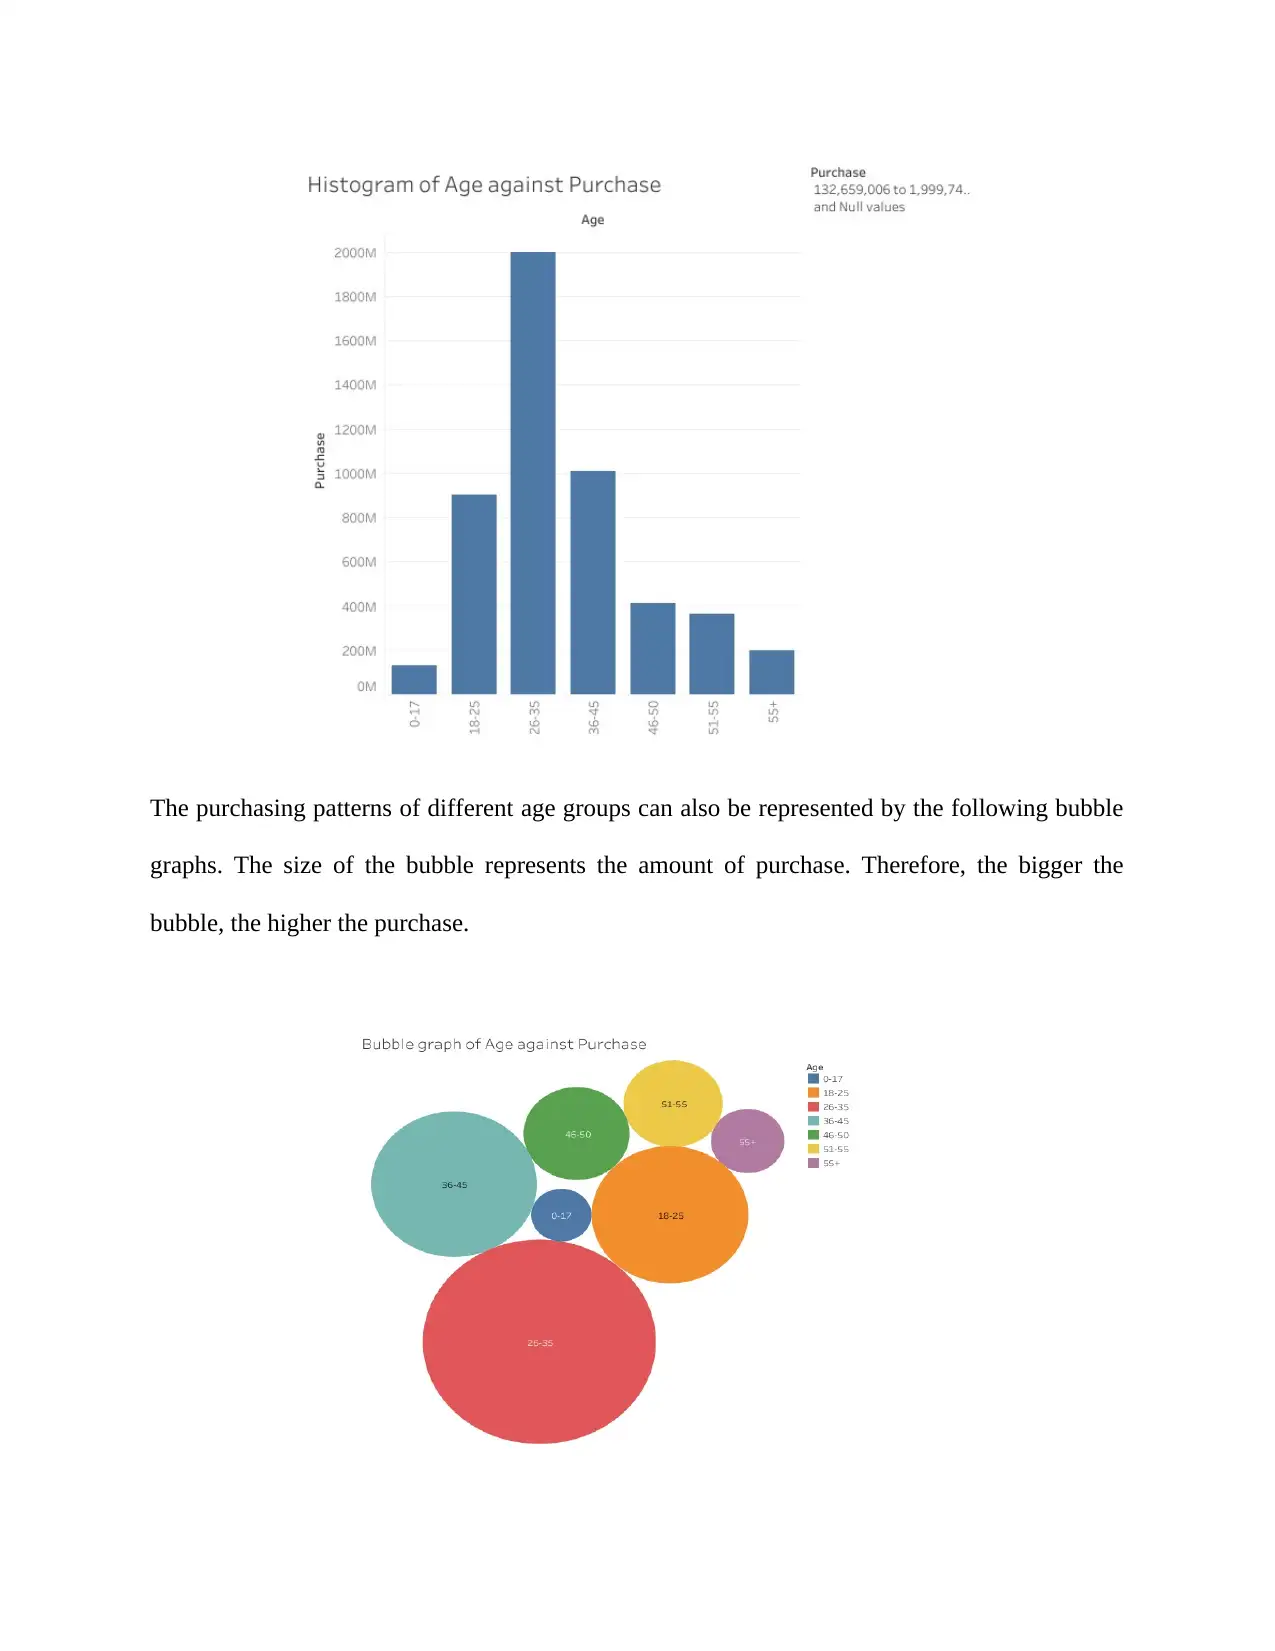
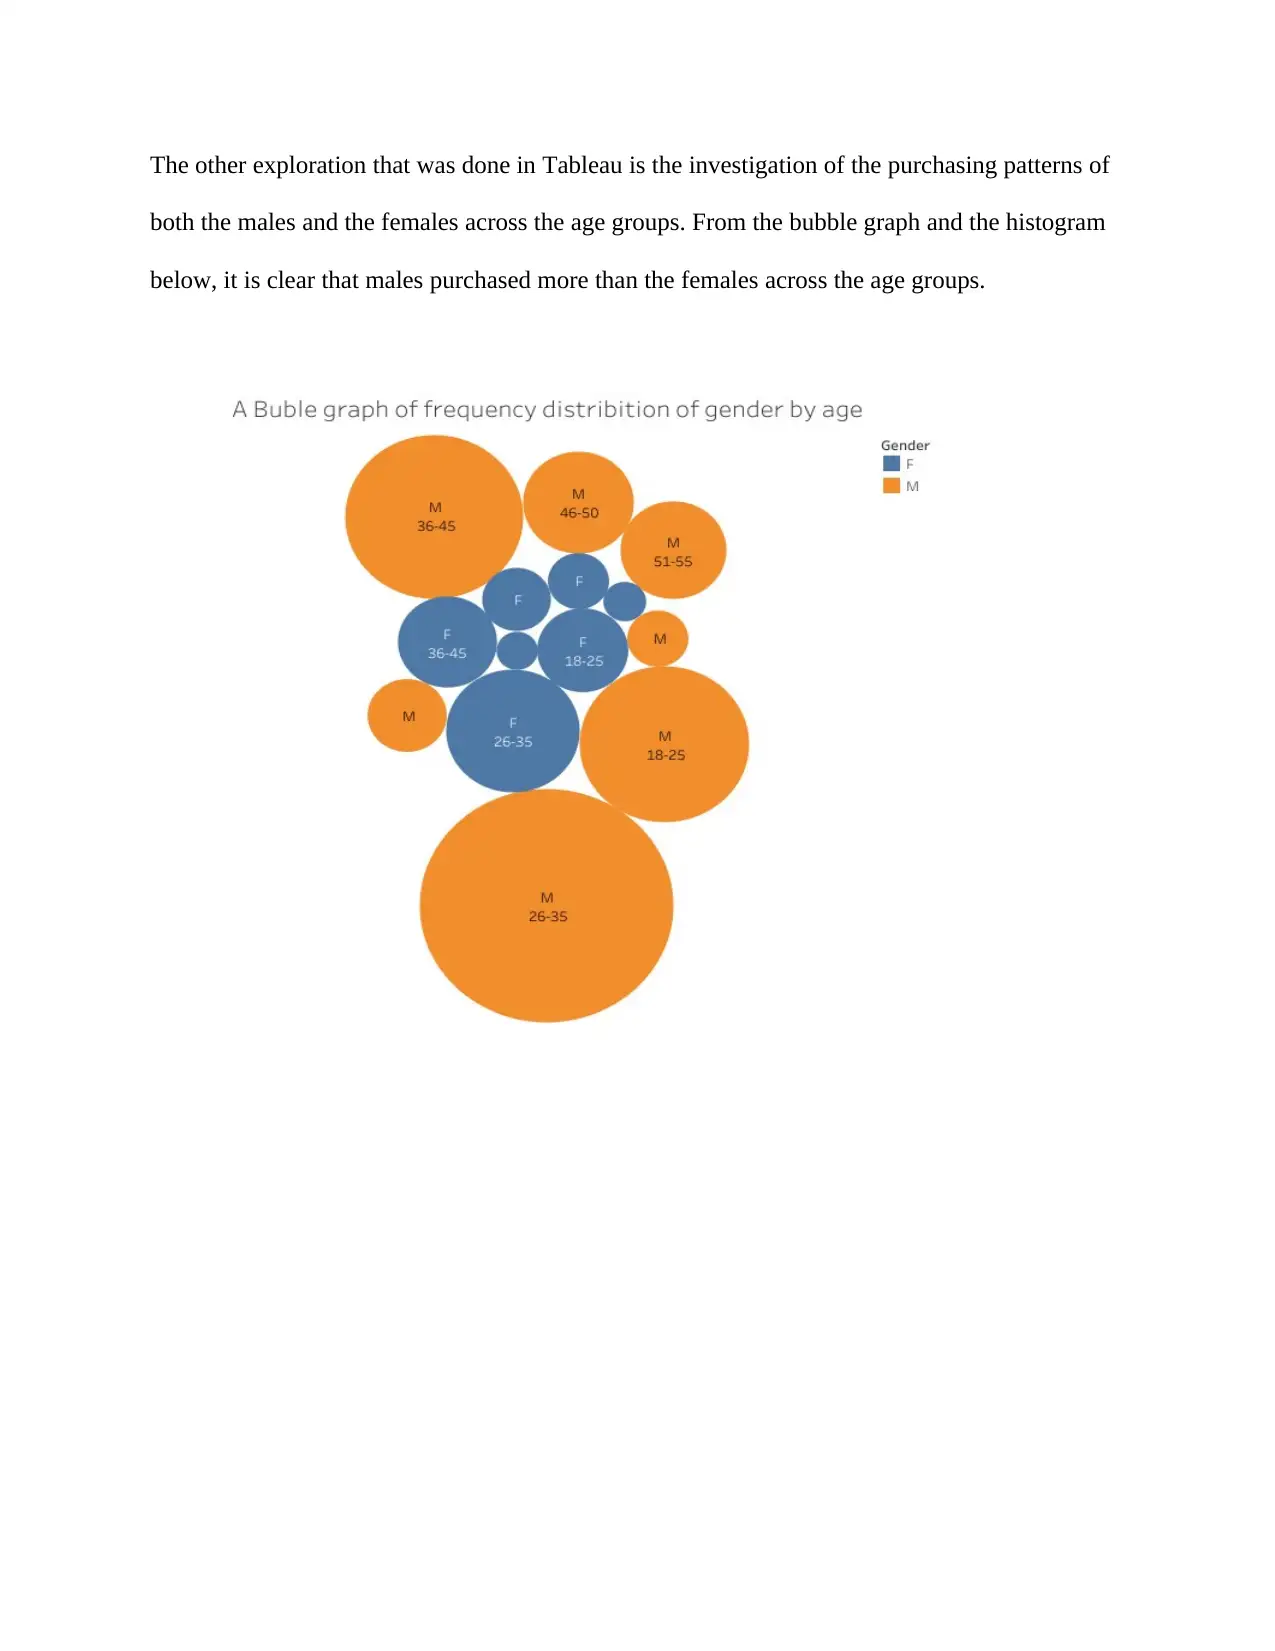
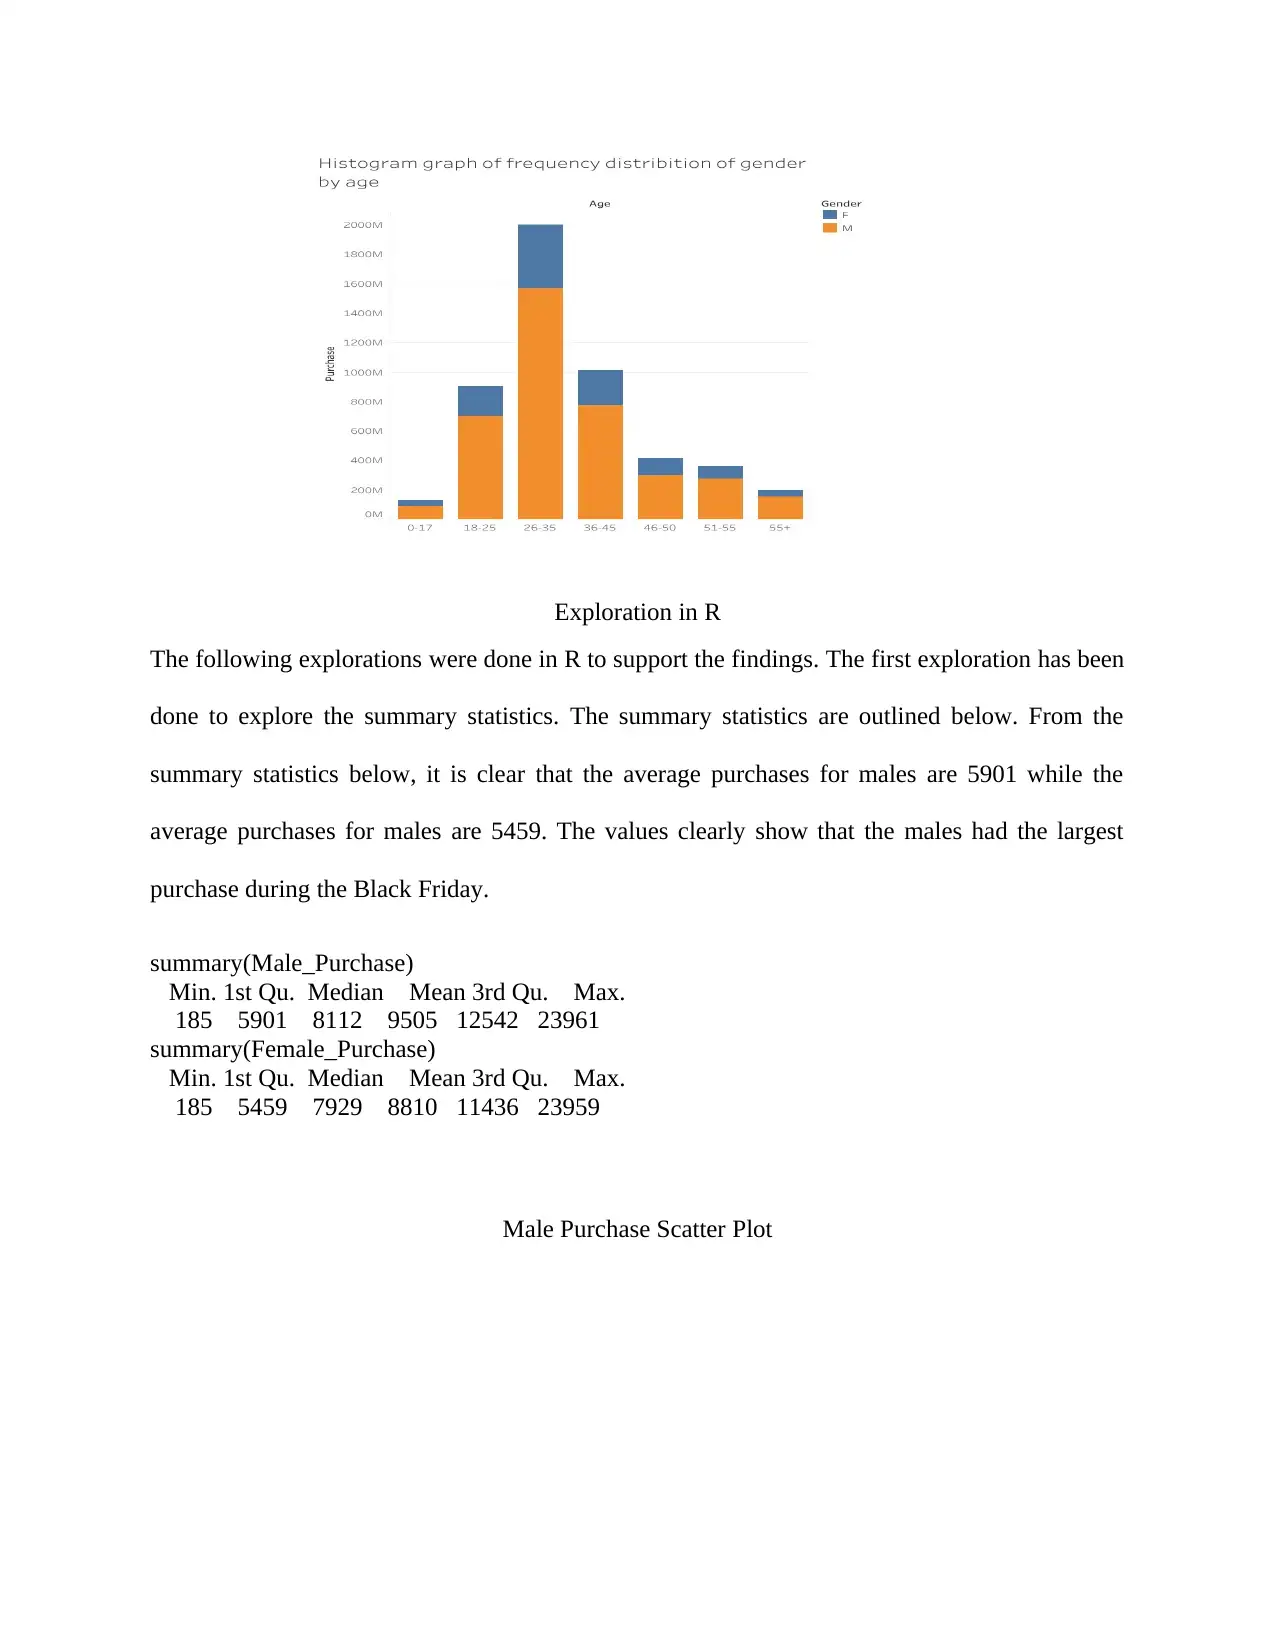
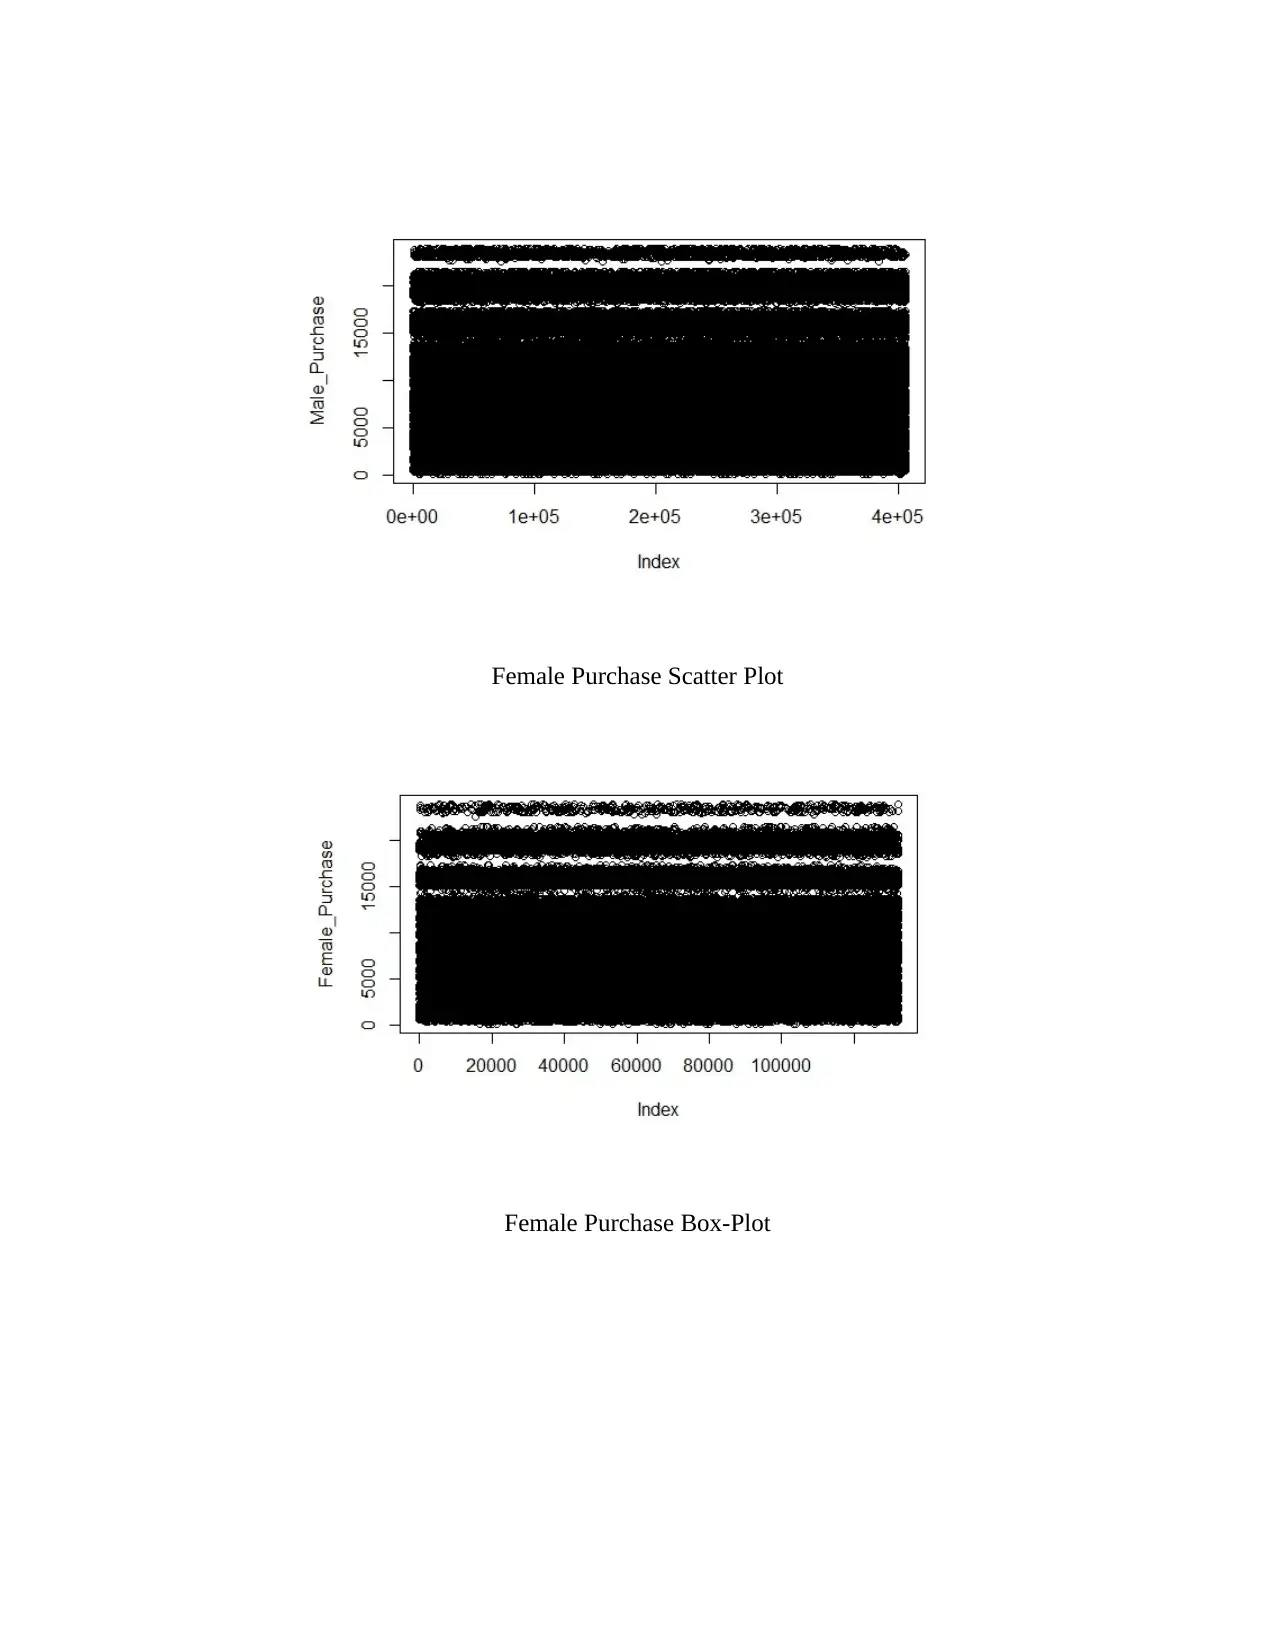
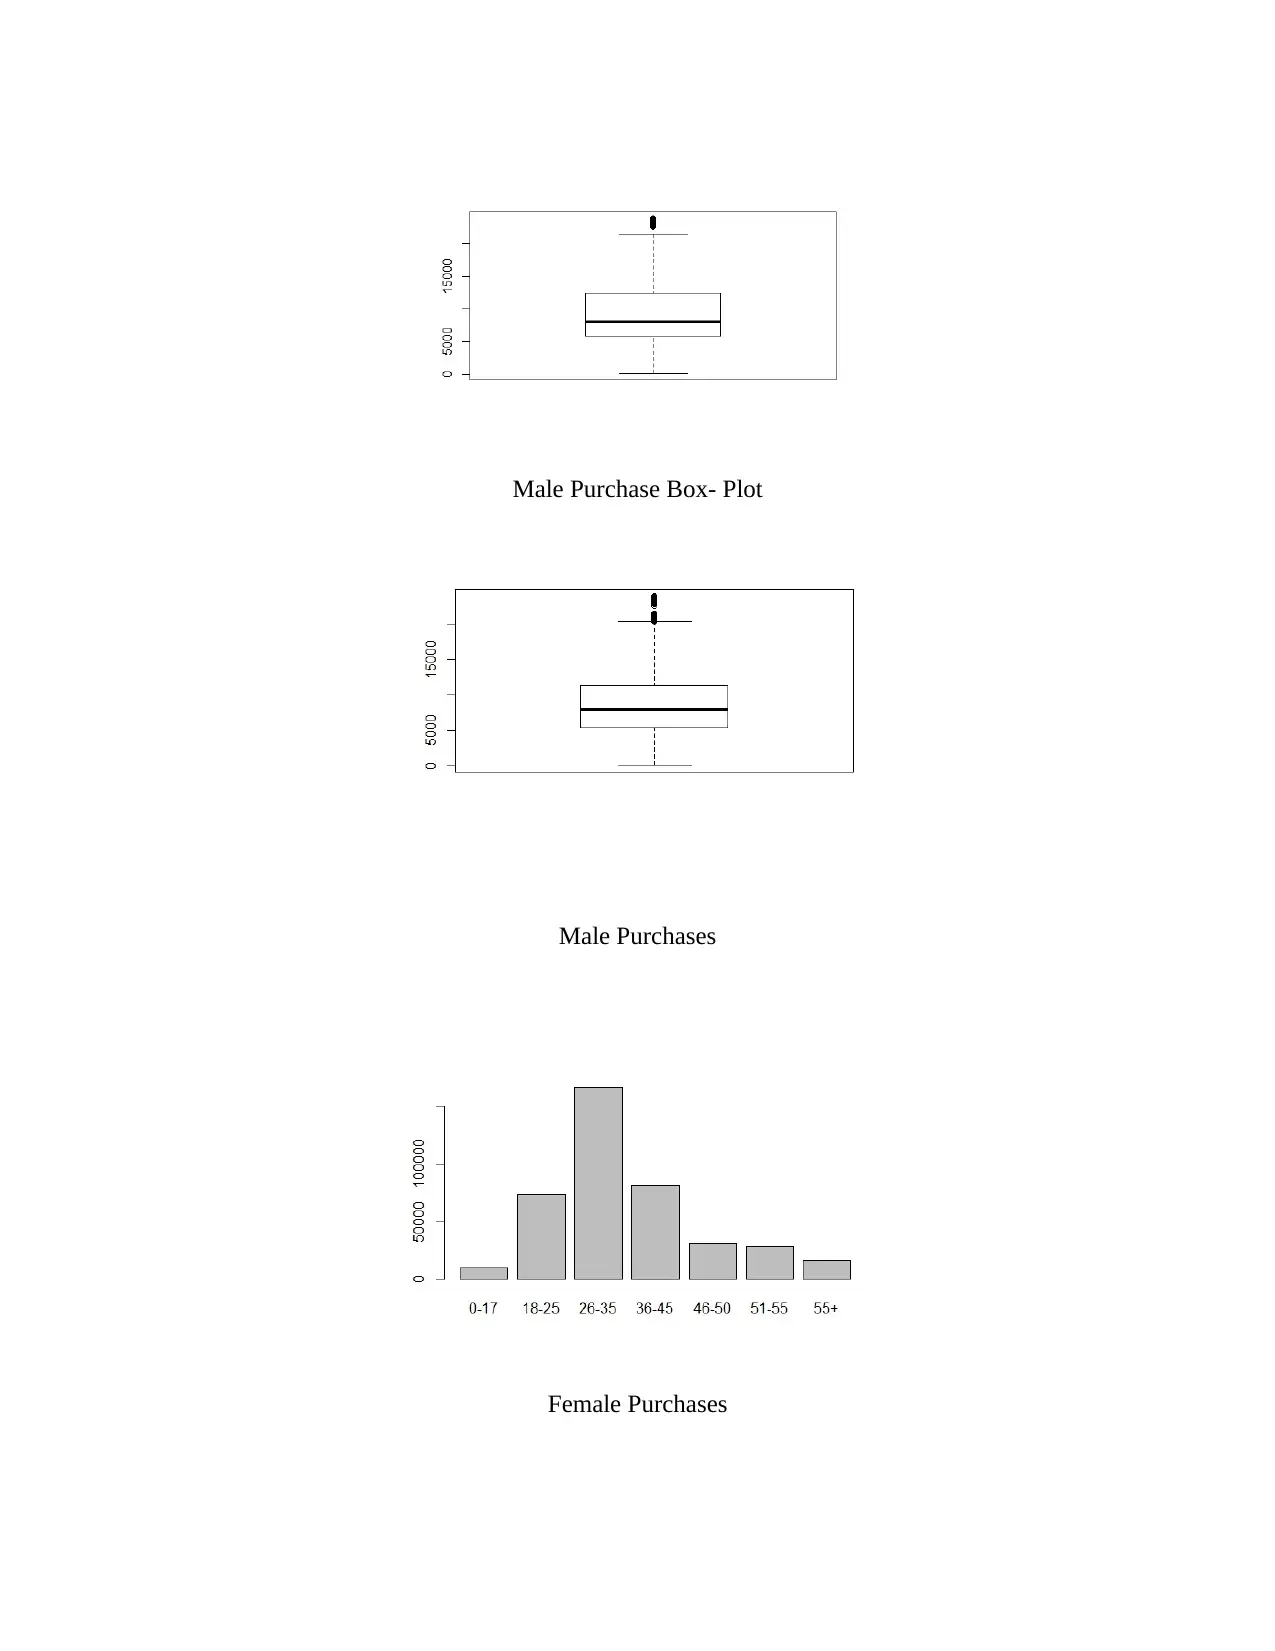
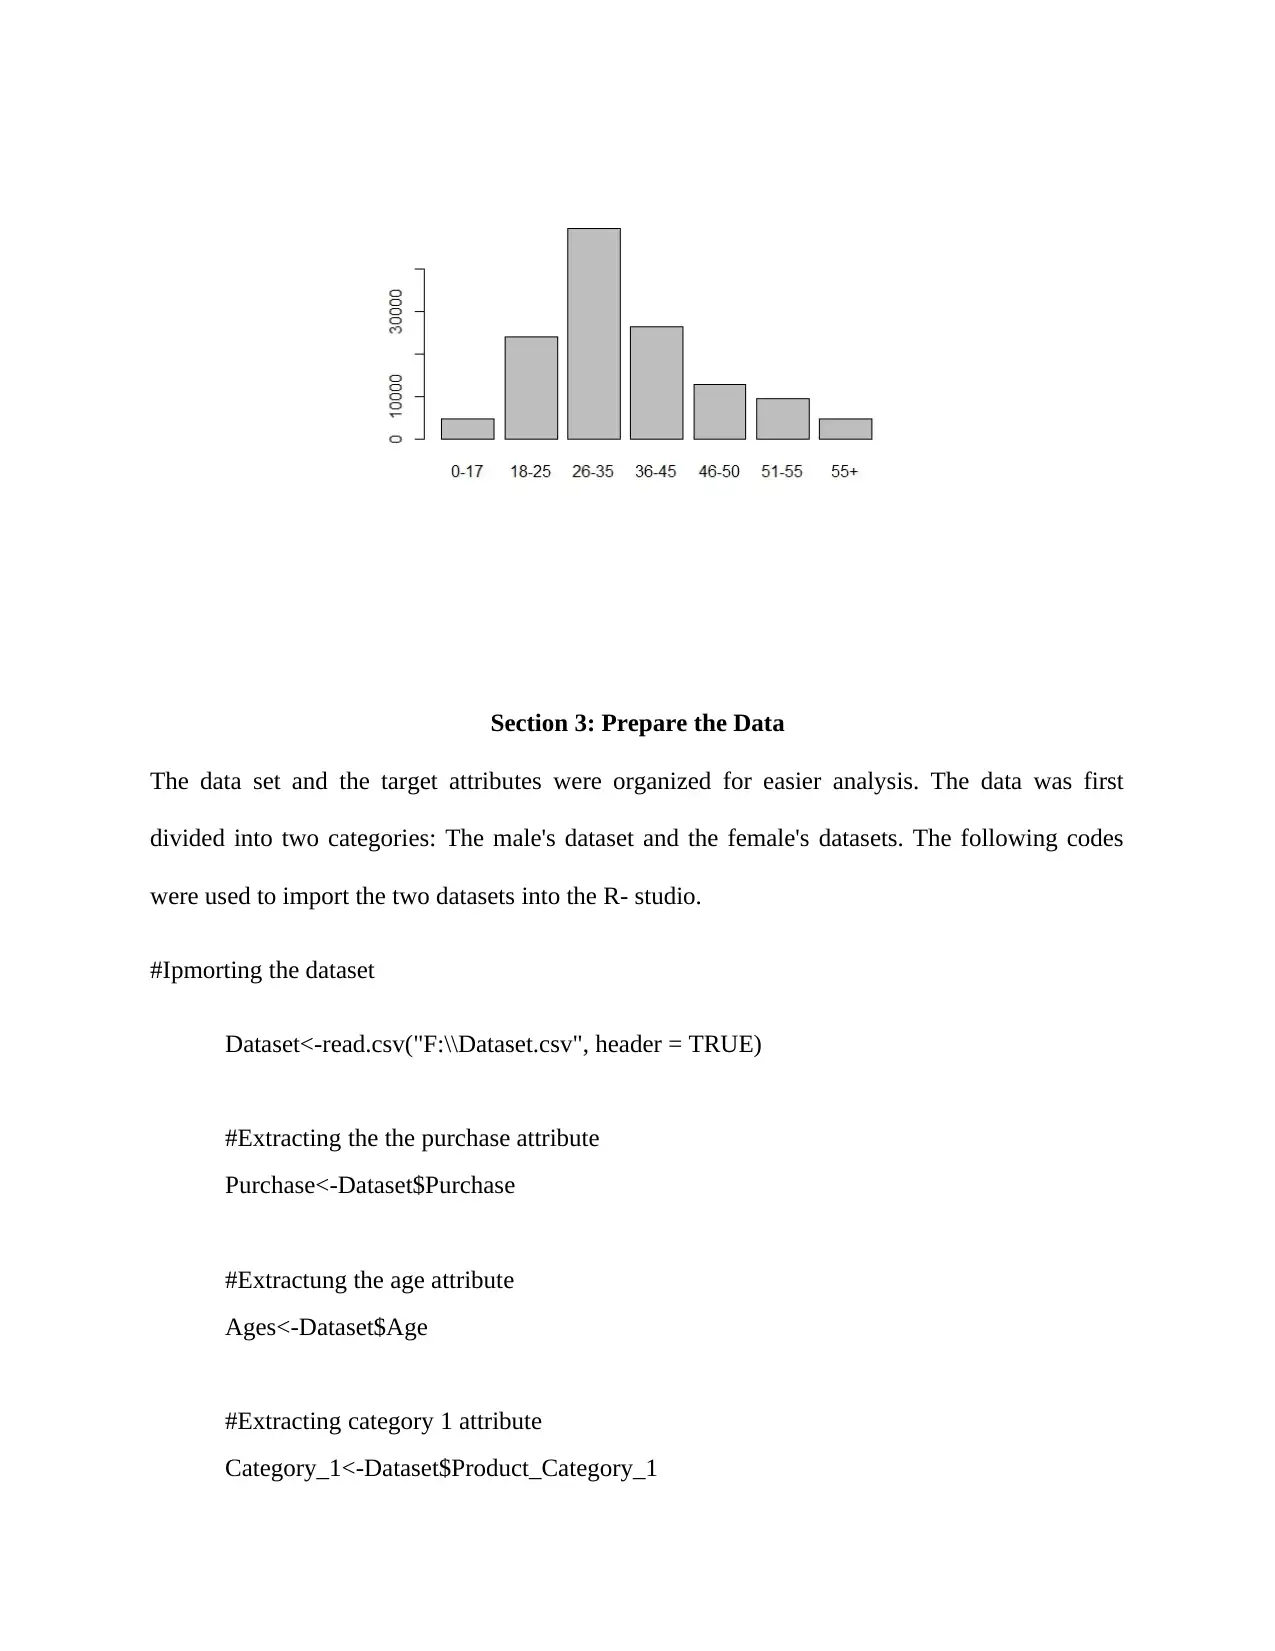
This report investigates the impact of Black Friday on the purchasing patterns of male and female customers. The analysis utilizes secondary sales data, examining customer demographics such as age and gender, alongside product categories and purchase amounts. The study employs data visualization techniques, including histograms and bubble charts, to explore purchasing trends across different age groups and genders. Furthermore, the report delves into statistical analysis, comparing average purchases between males and females. Predictive models, including linear regression, are generated to forecast purchasing behavior based on various attributes. The findings reveal that the 26-35 age group exhibits the highest purchasing activity, and males generally spend more than females during Black Friday sales. Based on these insights, the report recommends stocking strategies that align with the observed consumer preferences and provides actionable recommendations to businesses for optimizing sales and enhancing customer engagement during Black Friday events.

INVESTIGATING THE EFFECTS OF BLACK FRIDAYS ON THE PURCHASING
PATTERNS OF MALES AND FEMALES
Paraphrase This Document
Need a fresh take? Get an instant paraphrase of this document with our AI Paraphraser

Contents
Section 1: The Problem...............................................................................................................................3
Section 2: Understanding the Data..............................................................................................................4
Section 3: Prepare the Data........................................................................................................................11
Section 4: Generate and Test Prediction Models.......................................................................................12
Section 5: Problem Conclusions and Recommendations...........................................................................14
References.................................................................................................................................................15
Appendix...................................................................................................................................................17

Section 1: The Problem
A black Friday is a form of thanksgiving day for the businesses to their customers. Companies
choose to sell items at meagerer prices on a black Friday. Businesses organize Black Fridays for
different reasons. The important ideas for holding black Fridays include Advertising new
products, advertising existing products, the target for gaining new customers, a goal for retaining
existing customers by enhancing their loyalty to the business and its brands and a goal for
ensuring high volumes of sell.
A business would be interested in investigating or knowing whether any of the reason for
organizing a black Friday was met. The conclusion can be arrived at by analyzing sales data on a
black Friday. Therefore, the problem we have in this study is to investigate the purchasing
patterns of males and female customers on black Fridays. The question that we have to answer is
whether there is any significant difference in the purchasing powers of males and females of
different genders on a black Friday. The investigation has also been done on various product
categories. The inquiry into product categories is to investigate whether different product
categories experience any significant difference in purchasing powers on a black Friday.
The investigation is significant to the business owners in several ways. By knowing the
purchasing powers of both males and females, the businesses will be at a point of making
appropriate decisions on the number of stocks to maintain on a black Friday. Similarly, the
findings of the purchasing powers of different product categories will help the businesses to
know the types and amounts of products to have for a black Friday.
The data set that has been used in this report is secondary data. The data consists of black Friday
sales data that was obtained from the internet. Some of the parameters of the data include The id
of the customer, the age bracket of the customer, the gender of the customer, the product
⊘ This is a preview!⊘
Do you want full access?
Subscribe today to unlock all pages.

Trusted by 1+ million students worldwide

category that the customer's purchase and the amount of purchase. The target attributes or
parameters from the data set include The age of the customer, the gender of the customer, the
category of the product and the amount of purchase.
The gender of a customer is a target attribute because it will help in identifying the purchasing
patterns of both males and females for appropriate decision-making. The age will be used to
determine the age bracket of people who are enthusiastic about black Fridays. The product
category is essential in determining the group of products that are most preferred on a black
Friday. Similarly, the purchase will be used to analyze the patterns according to the other
attributes like age and gender.
Section 2: Understanding the Data
The dataset consists of 53758 rows and 12 columns. Therefore, the data consists of 12 attributes
and 53758 data points (entries). The columns representing the attributes are: The product id, the
customer id, the gender of the customer, the age of the customer, the current city of residence of
the customer, the city that the customer comes from, product category 1, product category 2,
product category 3, marital status of the customer and the amount of purchase of the customer.
On the other hand, the columns representing the data points or observation are the customers
who purchased on a black Friday.
Out of the twelve (12) attributes, only six (6) are relevant to this study. The six characteristics
include The gender of the customer, the age of the customer, product category 1, product
category 2, product category 3 and the amount of purchase. Therefore, the exploration of the data
will be done only on the six attributes.
Paraphrase This Document
Need a fresh take? Get an instant paraphrase of this document with our AI Paraphraser

The six attributes include both numerical and categorical data. The gender of the customer and
the three product categories are categorical. On the other hand, age and the amount of purchase
are numerical data. The exploration of the attributes have been done in Tableau and R. The
following three graphs shows the exploration in Tableau.
The first exploration is a histogram of purchase across the age groups. The histogram represents
the distribution of purchasing powers across the age groups. The bars represent the amount of
purchase. Therefore, the longer the bar, the larger the purchase and vice versa.
Therefore, from the histogram below, it is clear that the highest purchase was made by those in
the age bracket of 26-35 years while the least purchases were made by those in the age bracket of
0-17 and those who are above 55 years of age. The results are not surprising at all. Those in the
age brackets of 26 -35 are probably working or actively engaged in businesses, and hence they
have some disposable income. Moreover, they spend much of their time on the internet and have
much information about black Fridays.

The purchasing patterns of different age groups can also be represented by the following bubble
graphs. The size of the bubble represents the amount of purchase. Therefore, the bigger the
bubble, the higher the purchase.
graphs. The size of the bubble represents the amount of purchase. Therefore, the bigger the
bubble, the higher the purchase.
⊘ This is a preview!⊘
Do you want full access?
Subscribe today to unlock all pages.

Trusted by 1+ million students worldwide

The other exploration that was done in Tableau is the investigation of the purchasing patterns of
both the males and the females across the age groups. From the bubble graph and the histogram
below, it is clear that males purchased more than the females across the age groups.
both the males and the females across the age groups. From the bubble graph and the histogram
below, it is clear that males purchased more than the females across the age groups.
Paraphrase This Document
Need a fresh take? Get an instant paraphrase of this document with our AI Paraphraser

Exploration in R
The following explorations were done in R to support the findings. The first exploration has been
done to explore the summary statistics. The summary statistics are outlined below. From the
summary statistics below, it is clear that the average purchases for males are 5901 while the
average purchases for males are 5459. The values clearly show that the males had the largest
purchase during the Black Friday.
summary(Male_Purchase)
Min. 1st Qu. Median Mean 3rd Qu. Max.
185 5901 8112 9505 12542 23961
summary(Female_Purchase)
Min. 1st Qu. Median Mean 3rd Qu. Max.
185 5459 7929 8810 11436 23959
Male Purchase Scatter Plot

Female Purchase Scatter Plot
Female Purchase Box-Plot
⊘ This is a preview!⊘
Do you want full access?
Subscribe today to unlock all pages.

Trusted by 1+ million students worldwide

Male Purchase Box- Plot
Male Purchases
Female Purchases
Male Purchases
Female Purchases
Paraphrase This Document
Need a fresh take? Get an instant paraphrase of this document with our AI Paraphraser

Section 3: Prepare the Data
The data set and the target attributes were organized for easier analysis. The data was first
divided into two categories: The male's dataset and the female's datasets. The following codes
were used to import the two datasets into the R- studio.
#Ipmorting the dataset
Dataset<-read.csv("F:\\Dataset.csv", header = TRUE)
#Extracting the the purchase attribute
Purchase<-Dataset$Purchase
#Extractung the age attribute
Ages<-Dataset$Age
#Extracting category 1 attribute
Category_1<-Dataset$Product_Category_1

#Extracting category 2 attribute
Category_2<-Dataset$Product_Category_2
#Extracting category 3 attribute
Category_3<-Dataset$Product_Category_3
#Extracting the occupation attribute
Occupation<-Dataset$Occupation
Preparing the test and Training data
The following codes were used to prepare the train sample data sets:
#Data Manipulation
st_X<-Dataset[,2:8]
st_x1<-scale(st_X)
summary(st_x1)
library(class)
n<-nrow(Dataset)
n
#train datasets
train_data<-sample(n,0.7*n)
train_X<-st_x1[train_data]
train_X
train_Y<-Dataset[train_data,5]
train_Y
#test datasets
test_X<-st_x1[-train_data]
⊘ This is a preview!⊘
Do you want full access?
Subscribe today to unlock all pages.

Trusted by 1+ million students worldwide
1 out of 21
Related Documents

Your All-in-One AI-Powered Toolkit for Academic Success.
 +13062052269
info@desklib.com
Available 24*7 on WhatsApp / Email
Unlock your academic potential
Copyright © 2020–2025 A2Z Services. All Rights Reserved. Developed and managed by ZUCOL.